Nashville-Davidson, Tennessee, and Birmingham, Alabama, are two vibrant cities in the American Southeast with unique charms and challenges. Both cities offer significant cultural experiences, a rich history, and diverse culinary scenes. However, they differ in many areas such as cost of living, economic opportunities, safety, educational quality, and weather conditions. This comprehensive comparison looks into key aspects of life in both cities to provide a clear picture of what you can expect if you're considering a move or visit to either Nashville-Davidson or Birmingham.
Distance between
Nashville-Davidson, TN and
Birmingham, AL : 181.7 miles
Nashville-Davidson's population is larger by 244%. Its population has grown by 133,327 people (24.4%) since 2000. The population of Birmingham has decreased by 45,245 people (18.6%) during that time.
Safety is a chief concern for both residents and tourists. While neither Nashville-Davidson nor Birmingham ranks among the safest cities in the US, both have areas with lower crime rates. Nashville-Davidson has a higher crime rate than the national average, with property crime being the most common. However, targeted initiatives are in place to reduce these rates. Birmingham experiences higher crime rates than Nashville, particularly violent crime. Like many cities, safety can vary by neighborhood in both cities.
Cost of Living
Comparing the cost of living, Nashville-Davidson is generally more expensive than Birmingham. You can expect to pay more for housing, groceries, and health care in Nashville-Davidson. However, Nashville’s higher cost of living is offset by its stronger economy and higher per-capita income levels. Birmingham, while less costly, has a lower median household income compared to Nashville-Davidson.
Income Tax
As stated earlier, Tennessee, including Nashville-Davidson, does not levy a state-level income tax. This can lead to notable savings for residents, especially for those with higher incomes. On the other hand, Birmingham residents have to contend with both state and local income taxes.
Property Tax
Both cities collect property taxes, but rates differ. Property taxes in Nashville-Davidson are moderately high compared to the rest of the country, whereas Alabama has one of the lowest property tax rates nationwide, and Birmingham is no exception.
Sales Tax
Both Tennessee and Alabama have relatively high sales tax rates. However, while Tennessee does not levy a state-level income tax, Alabama residents pay state income taxes, which may offset the lower cost of living for some residents.
Income
Type
Nashville-Davidson
Birmingham
Estimated median household income
$64,857
$36,614
Estimated per capita income
$42,268
$27,211
Cost of living index (U.S. average is 100)
90.9
87.1
If you make $50,000 in Birmingham, you will have to make $52,181 in Nashville-Davidson to maintain the same standard of living.
Geographical Conditions
Nashville-Davidson and Birmingham have quite similar geographical conditions. Both are situated in the hilly region of the Southeastern U.S. Nashville is known for its beautiful landscapes and numerous parks, while Birmingham features scenic views marked by Red Mountain and Ruffner Mountain Nature Preserve.
Both Nashville-Davidson and Birmingham boast numerous highly-regarded schools and colleges. Nashville-Davidson is home to prestigious institutions such as Vanderbilt University, while Birmingham houses the renowned University of Alabama at Birmingham. Public schools in Nashville-Davidson are part of the Metropolitan Nashville Public Schools district while Birmingham's public schools fall under the Birmingham City Schools district. Both cities strive to provide quality education, though Nashville-Davidson tends to have higher-rated schools overall.
In terms of economy, Nashville-Davidson is known as a hub for the music industry, with opportunities in healthcare, education, and technology also being significant. Birmingham’s economy is more diversified with healthcare, banking, and manufacturing playing a pivotal role. The unemployment rate in Nashville-Davidson is lower than in Birmingham, and overall economic growth has been faster in Nashville-Davidson over recent years.
Biggest Employers
In Nashville-Davidson, the biggest employers are Vanderbilt University and Medical Center, followed by the Metropolitan Nashville-Davidson County Government and Nissan North America. Birmingham's major employers are the University of Alabama at Birmingham, Regions Financial Corporation, and St. Vincent's Health System, reflecting the prominent healthcare and financial sectors in the city.
There were 3,932 building permits issued in Nashville-Davidson in 2012 (2854 more than in 2011) compared to 90 building permits issued in Birmingham in 2012 (31 less than in 2011).
In Nashville-Davidson (Davidson County), 58.5% voted for Democrats and 39.9% for Republicans in 2012 Presidential Election. In Birmingham (Jefferson County), 52.7% voted for Democrats and 46.7% for Republicans.
Elections
Type
Democrats
Republicans
Other
Year
Nashville-Davidson
Birmingham
Nashville-Davidson
Birmingham
Nashville-Davidson
Birmingham
2020
65.0%
55.8%
32.6%
42.6%
2.3%
1.6%
2016
60.1%
51.6%
34.1%
44.3%
5.7%
4.1%
2012
58.5%
52.7%
39.9%
46.7%
1.6%
0.5%
2008
60.0%
52.6%
39.0%
47.4%
1.0%
0.0%
2004
54.9%
45.3%
44.6%
54.3%
0.4%
0.3%
2000
57.9%
47.6%
40.4%
50.8%
1.7%
1.6%
1996
79.3%
46.1%
18.1%
50.2%
2.6%
3.7%
Breakdown of population affiliated with a religious congregation
Type
Adherents
Congregations
Religion
Nashville-Davidson
Birmingham
Nashville-Davidson
Birmingham
SOUTHERN BAPTIST CONVENTION
14.1%
28.2%
19.6%
22.7%
CATHOLIC CHURCH
4.9%
8.4%
2.3%
2.7%
EPISCOPAL CHURCH
1.5%
2.1%
1.8%
1.4%
SEVENTH DAY ADVENTIST CHURCH
1.1%
0.6%
1.7%
1.2%
COPTIC ORTHODOX CHURCH
1.0%
0.0%
0.5%
0.1%
MUSLIM ESTIMATE
0.8%
0.5%
1.4%
0.6%
PRESBYTERIAN CHURCH IN AMERICA
0.8%
1.4%
0.9%
1.1%
CUMBERLAND PRESBYTERIAN CHURCH
0.4%
0.1%
1.3%
0.6%
Weather
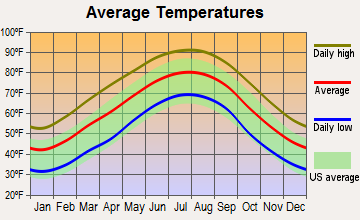
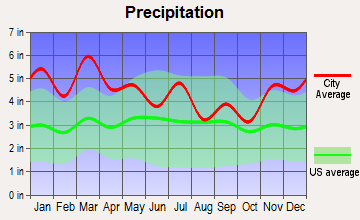
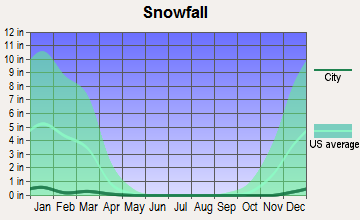
The weather in both Nashville-Davidson and Birmingham is characterized by hot, humid summers and mild winters. Nashville-Davidson experiences a slightly colder winter with temperatures often dipping below freezing. Birmingham, on the other hand, has slightly hotter, longer summers. Both cities receive a moderate amount of rainfall throughout the year with the occasional risk of tornadoes.
Weather and climate
Type
Nashville-Davidson
Birmingham
Temperature - Average
58.5°F
62.1°F
Humidity - Average morning or afternoon humidity
75.9%
75.5%
Humidity - Differences between morning and afternoon humidity
38%
38%
Humidity - Maximum monthly morning or afternoon humidity
89%
88%
Humidity - Minimum monthly morning or afternoon humidity
51%
50%
Precipitation - Yearly average
49 in
53.2 in
Snowfall - Yearly average
17.8 in
3.4 in
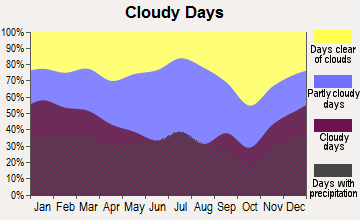
Clouds - Number of days clear of clouds
17.1%
16.4%
Sunshine amount - Average
59.7%
63.4%
Sunshine amount - Differences during a year
23%
21%
Sunshine amount - Maximum monthly
65%
67%
Sunshine amount - Minimum monthly
42%
46%
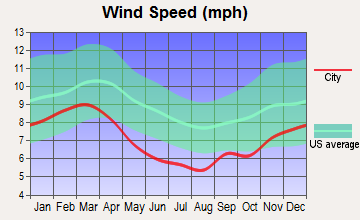
Wind speed - Average
7.7 mph
6.7 mph
Average climate in Nashville-Davidson, Tennessee
Average climate in Birmingham, Alabama
Air pollution
Type
AQI
CO
NO2
OZONE
PB
PM10
PM25
SO2
Year
Nashville-Davidson
Birmingham
Nashville-Davidson
Birmingham
Nashville-Davidson
Birmingham
Nashville-Davidson
Birmingham
Nashville-Davidson
Nashville-Davidson
Birmingham
Nashville-Davidson
Birmingham
Nashville-Davidson
Birmingham
2018
71
83
0.40
0.29
13.8
9.6
24.1
26.2
N/A
N/A
15.2
18.9
9.2
10.5
0.2
2.3
2017
70
91
0.38
0.35
14.4
10.0
26.8
24.2
N/A
N/A
15.3
18.9
8.7
11.0
0.1
2.7
2016
90
87
0.42
0.34
16.1
12.1
26.4
27.6
N/A
N/A
N/A
19.7
10.1
10.4
0.0
1.1
2015
68
84
0.43
0.33
15.5
10.9
23.6
24.5
N/A
N/A
N/A
19.3
10.8
10.6
0.1
1.1
2014
66
84
N/A
0.29
N/A
11.7
26.3
24.1
N/A
N/A
N/A
21.3
9.8
11.4
1.4
1.1
2013
62
82
N/A
0.22
N/A
N/A
N/A
21.4
N/A
N/A
N/A
19.2
9.7
10.9
N/A
1.2
2012
81
92
N/A
0.28
N/A
N/A
28.3
24.4
N/A
N/A
N/A
21.8
11.0
11.5
2.3
1.6
2011
81
104
N/A
0.33
N/A
N/A
25.9
24.9
N/A
N/A
N/A
24.3
11.0
13.0
1.7
1.9
2010
80
101
N/A
0.24
N/A
N/A
24.3
24.1
N/A
N/A
N/A
25.6
12.2
12.9
2.2
N/A
2009
72
94
N/A
0.51
N/A
N/A
22.5
21.5
N/A
N/A
N/A
25.1
11.5
12.5
2.4
N/A
2008
81
105
N/A
0.72
N/A
N/A
25.7
23.9
N/A
N/A
N/A
32.2
13.4
15.2
2.5
N/A
2007
99
124
N/A
0.82
N/A
N/A
27.4
24.6
N/A
N/A
N/A
41.6
15.5
17.5
2.7
N/A
2006
93
131
0.69
1.16
N/A
N/A
24.9
24.0
N/A
N/A
N/A
33.2
14.9
18.0
2.9
N/A
2005
104
131
0.56
0.95
N/A
N/A
23.5
21.8
N/A
N/A
N/A
38.0
16.9
18.4
3.1
N/A
2004
83
116
0.61
0.68
N/A
N/A
22.0
19.1
0.006
N/A
N/A
39.7
N/A
17.1
2.6
N/A
2003
93
123
0.67
0.53
N/A
N/A
18.5
18.2
0.005
N/A
N/A
42.1
15.8
16.1
3.8
N/A
2002
92
133
0.67
0.70
N/A
N/A
20.2
21.2
N/A
N/A
N/A
37.1
15.3
17.2
4.3
N/A
2001
95
175
0.89
1.69
N/A
N/A
19.5
19.6
N/A
N/A
N/A
32.3
15.6
N/A
4.5
N/A
2000
97
136
0.74
1.35
N/A
N/A
19.8
23.3
N/A
N/A
N/A
38.3
N/A
N/A
4.1
N/A
Natural disasters
Type
Nashville-Davidson
Birmingham
Tornado activity compared to U.S. average
169.1%
252.3%
Earthquake activity compared to U.S. average
296.1%
229.7%
Natural disasters compared to U.S. average
17%
32%
Transportation
Public transportation options in both cities are decent, though neither city is known for extraordinary public transit. Nashville-Davidson provides commuter services such as buses and a commuter train service. Birmingham also offers bus services as well as a new downtown streetcar line. Both cities are highly car-dependent, and traffic congestion can be significant, particularly in Nashville.
Transport
Type
Nashville-Davidson
Birmingham
Amtrak stations
0
1
Amtrak stations nearby
1
1
FAA registered aircraft
0
358
FAA registered aircraft manufacturers and dealers
0
4
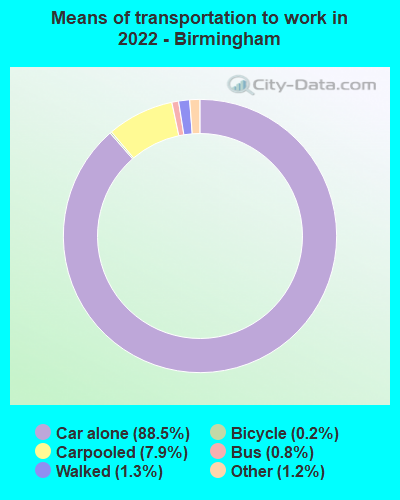
Means of transportation to work
Type
Nashville-Davidson
Birmingham
Bicycle
0.3%
0.2%
Bus
1.2%
0.4%
Carpooled
9.8%
7.4%
Car alone
85.5%
89.4%
Taxicab
0.1%
0.2%
Walked
1.8%
1.1%
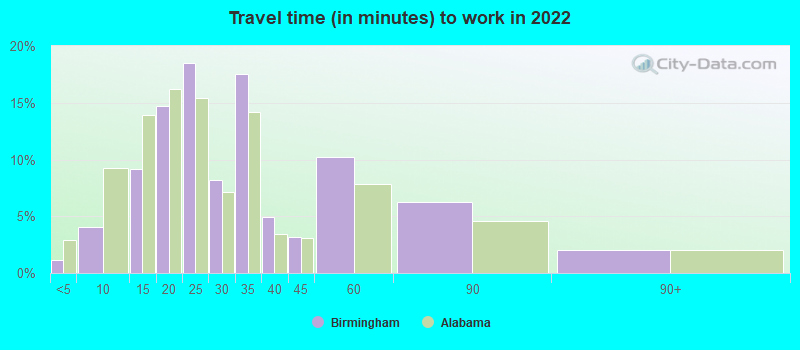
Average travel time to work
Type
Nashville-Davidson
Birmingham
Average
31.3 min
29.2 min
Other means
23.4 min
22.9 min
Public transportation
38.9 min
47 min
Private vehicle occupancy
Type
Nashville-Davidson
Birmingham
Average
1.2
1.2
Drove alone
88.7%
90.6%
In 2 person carpool
8.5%
7.4%
In 3 person carpool
1.6%
0.5%
In 4 person carpool
0.7%
0.6%
In 5-6 person carpool
0.5%
0.3%
In 7+ person carpool
0%
0.6%
How many people usually rode to work in the car, truck or van.
Real Estate
Real estate in Nashville-Davidson is more expensive than in Birmingham. The median home cost in Nashville-Davidson is considerably higher than in Birmingham, reflecting the city’s growing popularity and economic prosperity. However, Birmingham’s lower property prices are appealing for home buyers on a budget, and the city's real estate market offers considerable value for money.
Neighborhoods
Each city has a range of neighborhoods with distinct characteristics. In Nashville-Davidson, upscale neighborhoods include Belle Meade and Forest Hills while bohemian areas include East Nashville. In Birmingham, the affluent neighborhood of Mountain Brook and the trendy area of Avondale stand out. Both cities offer options for every type of renter or homeowner, varying in safety, amenities, and architectural style.
Houses and residents
Type
Nashville-Davidson
Birmingham
Houses
331,262
108,533
Average household size (people)
2.3
2.3
Median year apartment built
1986
1973
Median year house/condo built
1984
1959
Length of stay in the house since moving in
12.2 years
17.5 years
Houses occupied
305,247 (92.1%)
87,570 (80.7%)
Houses occupied by owners
162,426 (53.2%)
40,665 (46.4%)
Houses occupied by renters
142,821 (46.8%)
46,905 (53.6%)
Median rent asked for vacant for-rent units
$1,391
$620.56
Median monthly housing costs
$1,291
$820
Median price asked for vacant for-sale houses and condos
$221,129
$51,535
Estimated median house or condo value
$346,700
$117,600
Median numbers of rooms
5.2
5.2
Median number of rooms in apartments
4.2
4.5
Median number of rooms in houses and condos
6.3
6.2
Median house price - detached houses
$437,686
$178,184
Median house price - in 2-unit structures
$320,904
$97,076
Median house price - in 3-to-4-unit structures
$319,119
$231,741
Median house price - in 5 or more unit structures
$305,249
$220,662
Median house price - mobile homes
$133,346
$47,467
Median house price - Townhouses or other attached units
$328,258
$189,730
Median house price - All housing units
$412,434
$184,367
Median house age
35
57
Renting percentage
44.6%
50.7%
Housing density (houses/condos per square mile)
699.9
724
House value disparities
31%
42.2%
Household income disparities
45.4%
50.2%
Median household income for houses/condes with a mortgage
$93,092
$63,812
Median household income for apartments without a mortgage
$68,871
$42,701
Housing units without a mortgage
3,189 (2.8%)
652 (3.2%)
Housing units with both a second mortgage and home equity loan
10,988 (9.6%)
837 (4%)
Housing units with a mortgage
110,850 (97.2%)
20,029 (96.8%)
Housing units with a home equity loan
333 (0.3%)
0 (0%)
Housing units with a second mortgage
13,192 (11.6%)
1,439 (7%)
House/condo owner moved in on average (years ago)
9
18
House/condo renter moved in on average (years ago)
1
1
Housing units lacking complete kitchen facilities
1.3%
5.3%
Housing units lacking complete plumbing facilities
0.5%
4.4%
Housing units in structures
Housing units in structures
Nashville-Davidson
Birmingham
One, detached
50.9%
59.4%
One, attached
8.4%
2.1%
Two
3.3%
1.8%
3 or 4
3.1%
6.3%
5 to 9
7.1%
9.3%
10 to 19
8.7%
8.0%
20 to 49
5.3%
6.3%
50 or more
11.9%
6.1%
Mobile homes
1.2%
0.7%
Boats, RVs, vans, etc.
0.1%
0.0%
Median real estate property taxes paid for housing units
Self-employed workers in own not incorporated business
31,952
4,375
State government workers
15,693
5,819
Unpaid family workers
463
158
Industries and Occupations
Music and entertainment dominate Nashville-Davidson’s job market, but healthcare, education, and technology are also thriving sectors. For Birmingham, healthcare services and financial operations form a significant portion of the local economy. The city also has a historical association with the steel industry. In terms of occupations, both cities offer a variety of roles but Nashville-Davidson has a higher proportion of arts and entertainment occupations, reflecting its status as the “Music City”.
When it comes to healthcare, both Nashville-Davidson and Birmingham offer top-notch facilities. Nashville is home to the nationally ranked Vanderbilt University Medical Center, while Birmingham houses the highly-regarded University of Alabama at Birmingham Health System.
Health (county statistics)
Type
Nashville-Davidson
Birmingham
General health status score of residents in this county from 1 (poor) to 5 (excellent)
Nashville-Davidson boasts modern infrastructure with a well-maintained road network, airport, and public facilities. The city is also known for its hospitals and universities. Birmingham’s infrastructure, while decent, may not be as developed as Nashville’s. Nonetheless, Birmingham boasts a good road network and improved public facilities.
HMDA - Conventional home purchase loans - Applications denied
Year
Nashville-Davidson
Birmingham
1999
2,397
834
2000
1,451
835
2001
1,130
699
2002
1,075
548
2003
2,231
670
2004
2,731
928
2005
3,231
1,149
2006
3,720
1,235
2007
2,419
914
2008
952
426
2009
532
141
Culture and Food
Both Nashville-Davidson and Birmingham boast rich histories and diverse cultural scenes. Nashville-Davidson is known for its country music legacy, and a myriad of performance venues, music festivals, and record companies solidify its cultural reputation. Birmingham's history is tied to the Civil Rights Movement, and its arts scene is growing. Both cities have diverse culinary scenes specializing in Southern cuisine, with Nashville known for its hot chicken, and Birmingham offering a growing foodie scene marked by high-quality restaurants and innovative chefs.
Sports Teams
Nashville-Davidson is the home of the NFL’s Tennessee Titans, NHL’s Nashville Predators, and MLS’s Nashville SC. Birmingham is not home to any major league teams, but the Birmingham Barons, a Double-A affiliate of the Chicago White Sox, have a significant local following. The city is also a hotbed for college football with the University of Alabama nearby.


 Nashville-Davidson, TN and
  Birmingham, AL : 181.7 miles