Nashville-Davidson and Chattanooga both offer distinctive ways of life with unique attractions and characteristics for tourists and potential residents. Nashville-Davidson, the state capital, is renowned for its vibrant music scene and higher cost of living, while Chattanooga is feted for its outdoor recreational opportunities and lower living expenses. Below we further delve into the specifics of each city, covering a range of diverse categories such as crime and safety, weather, real-estate, and culture/food among others, to help you make an informed decision when comparing the two.
Distance between
Nashville-Davidson, TN and
Chattanooga, TN : 113.7 miles
Nashville-Davidson's population is larger by 273%. Its population has grown by 133,327 people (24.4%) since 2000. The population of Chattanooga has grown by 26,559 people (17.1%) during that time.
Crime rates have a significant impact on the quality of life in any city. Unfortunately, both Nashville-Davidson and Chattanooga struggle with crime rates higher than the national average, but are making ongoing efforts to improve these statistics through various initiatives. Safety isn't just crime statistics though; it also reflects a city's efforts in emergency preparedness, hospital accessibility, and traffic safety. Both cities are known for their excellent health care facilities and improved infrastructures aimed to ensure resident safety.
Cost of Living
Cost of living is generally more expensive in Nashville-Davidson compared to Chattanooga, especially in terms of housing and real estate, primarily due to its status as a state capital and a major economic hub.
Income Tax
Tennessee is one of the few states with no state income tax. This is applicable to both Nashville-Davidson and Chattanooga residents, reinforcing a pro-business environment for both cities.
Property Tax
Homeowners in Nashville-Davidson incur higher property taxes compared to Chattanooga due to the higher house values in the former city. However, Tennessee's overall property tax rates are fairly low compared to the national average.
Sales Tax
The sales tax in Nashville-Davidson is 9.25%, comprising 7% state tax and 2.25% city tax. Chattanooga also imposes the 7% state tax, with an additional 2.25% city sales tax, making it effectively the same as Nashville-Davidson.
Income
Type
Nashville-Davidson
Chattanooga
Estimated median household income
$64,857
$55,065
Estimated per capita income
$42,268
$34,297
Cost of living index (U.S. average is 100)
90.9
89.2
If you make $50,000 in Chattanooga, you will have to make $50,953 in Nashville-Davidson to maintain the same standard of living.
Geographical Conditions
Nashville-Davidson is characterized by mostly flat to rolling hills terrain, nestled on the Cumberland River. Chattanooga is situated between the mountain ridge and river, offering a scenic mountainous terrain ideal for outdoor activities.
Both cities have a diversified educational landscape, offering numerous public and private schools, as well as institutions of higher learning. Nashville-Davidson is home to the famous Vanderbilt University and several other colleges, while Chattanooga boasts the University of Tennessee at Chattanooga and Chattanooga State Community College.
Nashville's economy is heavily influenced by the music industry, healthcare, and tourism, while Chattanooga, being more industrialized, relies more on manufacturing. Both cities offer a wealth of job opportunities, though it largely depends on the specific industry one is interested in.
Biggest Employers
Major employers in Nashville-Davidson include Vanderbilt University and Medical Center, Nissan North America, and HCA Healthcare. Chattanooga's biggest employers are the BlueCross BlueShield of Tennessee, University of Tennessee at Chattanooga, and Volkswagen Group of America.
There were 3,932 building permits issued in Nashville-Davidson in 2012 (2854 more than in 2011) compared to 575 building permits issued in Chattanooga in 2012 (373 more than in 2011).
In Nashville-Davidson (Davidson County), 58.5% voted for Democrats and 39.9% for Republicans in 2012 Presidential Election. In Chattanooga (Hamilton County), 41.6% voted for Democrats and 56.6% for Republicans.
Elections
Type
Democrats
Republicans
Other
Year
Nashville-Davidson
Chattanooga
Nashville-Davidson
Chattanooga
Nashville-Davidson
Chattanooga
2020
65.0%
44.5%
32.6%
54.2%
2.3%
1.3%
2016
60.1%
39.1%
34.1%
55.6%
5.7%
5.4%
2012
58.5%
41.6%
39.9%
56.6%
1.6%
1.8%
2008
60.0%
43.4%
39.0%
55.2%
1.0%
1.3%
2004
54.9%
41.9%
44.6%
57.4%
0.4%
0.7%
2000
57.9%
43.1%
40.4%
55.5%
1.7%
1.3%
1996
79.3%
22.5%
18.1%
74.2%
2.6%
3.3%
Breakdown of population affiliated with a religious congregation
Type
Adherents
Congregations
Religion
Nashville-Davidson
Chattanooga
Nashville-Davidson
Chattanooga
SOUTHERN BAPTIST CONVENTION
14.1%
21.9%
19.6%
20.5%
CATHOLIC CHURCH
4.9%
3.8%
2.3%
1.1%
EPISCOPAL CHURCH
1.5%
1.8%
1.8%
2.1%
SEVENTH DAY ADVENTIST CHURCH
1.1%
3.1%
1.7%
3.8%
COPTIC ORTHODOX CHURCH
1.0%
0.0%
0.5%
0.2%
MUSLIM ESTIMATE
0.8%
0.6%
1.4%
1.3%
PRESBYTERIAN CHURCH IN AMERICA
0.8%
2.1%
0.9%
2.3%
CUMBERLAND PRESBYTERIAN CHURCH
0.4%
0.4%
1.3%
0.9%
LUTHERAN CHURCH
0.3%
0.4%
0.9%
0.9%
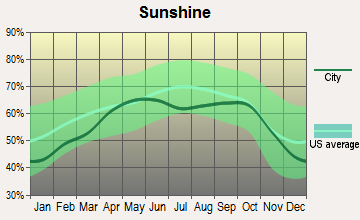
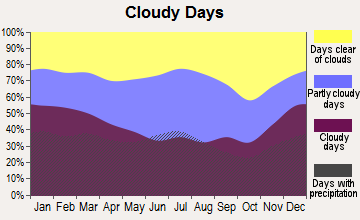
Weather
Both Nashville and Chattanooga experience a typical four-season climate, common to the Southeast region. Summers can be hot and humid while winters are usually mild. Nashville, being further inland, has slightly hotter summers and cooler winters compared to Chattanooga which is closer to the mountains.
Weather and climate
Type
Nashville-Davidson
Chattanooga
Temperature - Average
58.5°F
60°F
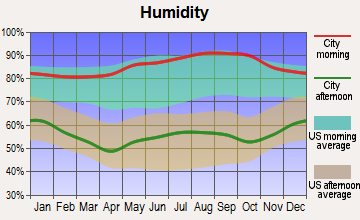
Humidity - Average morning or afternoon humidity
75.9%
76%
Humidity - Differences between morning and afternoon humidity
38%
42%
Humidity - Maximum monthly morning or afternoon humidity
89%
90%
Humidity - Minimum monthly morning or afternoon humidity
51%
48%
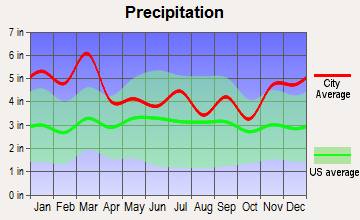
Precipitation - Yearly average
49 in
53.2 in
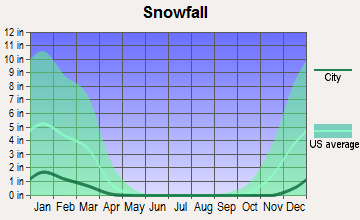
Snowfall - Yearly average
17.8 in
7.8 in
Clouds - Number of days clear of clouds
17.1%
17.3%
Sunshine amount - Average
59.7%
59.8%
Sunshine amount - Differences during a year
23%
19%
Sunshine amount - Maximum monthly
65%
63%
Sunshine amount - Minimum monthly
42%
44%
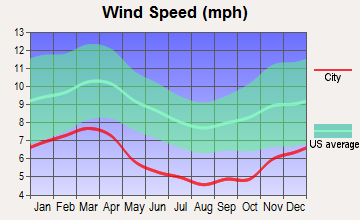
Wind speed - Average
7.7 mph
5.4 mph
Average climate in Nashville-Davidson, Tennessee
Average climate in Chattanooga, Tennessee
Air pollution
Type
AQI
CO
NO2
OZONE
PB
PM10
PM25
SO2
Year
Nashville-Davidson
Chattanooga
Nashville-Davidson
Chattanooga
Nashville-Davidson
Chattanooga
Nashville-Davidson
Chattanooga
Nashville-Davidson
Nashville-Davidson
Nashville-Davidson
Chattanooga
Nashville-Davidson
Chattanooga
2018
71
68
0.40
N/A
13.8
N/A
24.1
32.2
N/A
N/A
15.2
N/A
9.2
9.0
0.2
N/A
2017
70
74
0.38
N/A
14.4
N/A
26.8
32.8
N/A
N/A
15.3
N/A
8.7
9.5
0.1
N/A
2016
90
88
0.42
N/A
16.1
N/A
26.4
37.3
N/A
N/A
N/A
N/A
10.1
10.4
0.0
N/A
2015
68
76
0.43
N/A
15.5
N/A
23.6
31.5
N/A
N/A
N/A
N/A
10.8
9.7
0.1
N/A
2014
66
74
N/A
N/A
N/A
N/A
26.3
33.5
N/A
N/A
N/A
N/A
9.8
10.1
1.4
N/A
2013
62
77
N/A
N/A
N/A
N/A
N/A
33.0
N/A
N/A
N/A
N/A
9.7
10.2
N/A
N/A
2012
81
89
N/A
N/A
N/A
N/A
28.3
36.1
N/A
N/A
N/A
N/A
11.0
11.8
2.3
N/A
2011
81
91
N/A
N/A
N/A
N/A
25.9
35.6
N/A
N/A
N/A
N/A
11.0
13.8
1.7
N/A
2010
80
93
N/A
N/A
N/A
N/A
24.3
37.2
N/A
N/A
N/A
N/A
12.2
13.2
2.2
N/A
2009
72
81
N/A
N/A
N/A
N/A
22.5
33.0
N/A
N/A
N/A
N/A
11.5
11.8
2.4
N/A
2008
81
95
N/A
N/A
N/A
N/A
25.7
37.2
N/A
N/A
N/A
N/A
13.4
15.0
2.5
N/A
2007
99
118
N/A
N/A
N/A
N/A
27.4
41.7
N/A
N/A
N/A
N/A
15.5
N/A
2.7
N/A
2006
93
99
0.69
N/A
N/A
N/A
24.9
37.4
N/A
N/A
N/A
N/A
14.9
N/A
2.9
N/A
2005
104
93
0.56
N/A
N/A
5.5
23.5
34.5
N/A
N/A
N/A
N/A
16.9
N/A
3.1
1.5
2004
83
105
0.61
N/A
N/A
N/A
22.0
33.8
0.006
N/A
N/A
N/A
N/A
N/A
2.6
N/A
2003
93
95
0.67
N/A
N/A
N/A
18.5
27.2
0.005
N/A
N/A
N/A
15.8
N/A
3.8
N/A
2002
92
103
0.67
1.00
N/A
5.1
20.2
30.2
N/A
N/A
N/A
N/A
15.3
N/A
4.3
1.4
2001
95
110
0.89
N/A
N/A
N/A
19.5
27.8
N/A
N/A
N/A
N/A
15.6
N/A
4.5
N/A
2000
97
132
0.74
N/A
N/A
N/A
19.8
28.8
N/A
N/A
N/A
N/A
N/A
N/A
4.1
N/A
Natural disasters
Type
Nashville-Davidson
Chattanooga
Tornado activity compared to U.S. average
169.1%
149.2%
Earthquake activity compared to U.S. average
296.1%
214.8%
Natural disasters compared to U.S. average
17%
17%
Transportation
Nashville-Davidson boasts a comprehensive public transportation infrastructure with buses and trains, helping commuters navigate the city with ease. Chattanooga, on the other hand, is known for its free electric shuttle that runs downtown, making it convenient for locals and tourists alike.
Transport
Type
Nashville-Davidson
Chattanooga
Amtrak stations
0
1
Amtrak stations nearby
1
1
FAA registered aircraft
0
145
FAA registered aircraft manufacturers and dealers
0
13
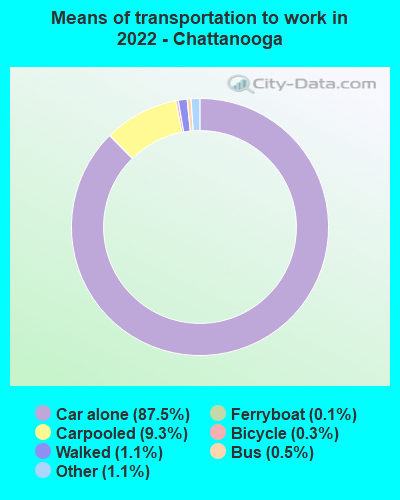
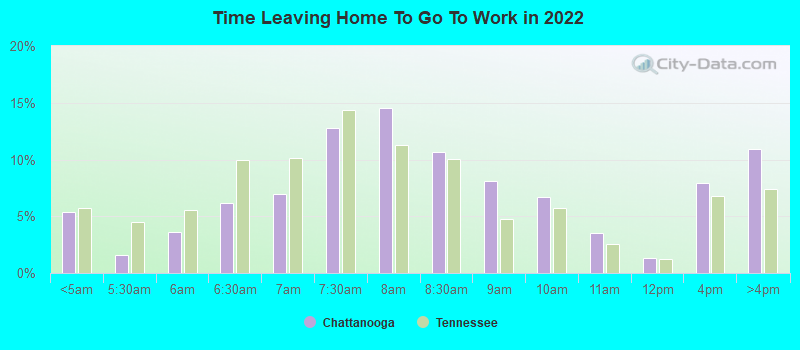
Means of transportation to work
Type
Nashville-Davidson
Chattanooga
Bicycle
0.3%
0.1%
Bus
1.2%
0.4%
Carpooled
9.8%
8.6%
Car alone
85.5%
89%
Motorcycle
0.1%
0.1%
Taxicab
0.1%
0.4%
Walked
1.8%
1%
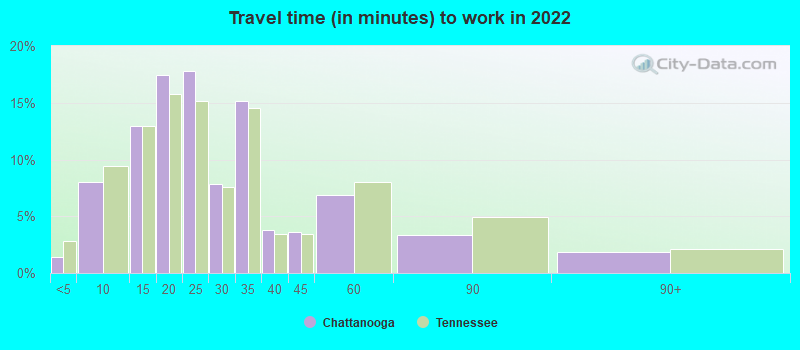
Average travel time to work
Type
Nashville-Davidson
Chattanooga
Average
31.3 min
27.1 min
Other means
23.4 min
20.4 min
Public transportation
38.9 min
34 min
Private vehicle occupancy
Type
Nashville-Davidson
Chattanooga
Average
1.2
1.1
Drove alone
88.7%
91%
In 2 person carpool
8.5%
7.1%
In 3 person carpool
1.6%
1.1%
In 4 person carpool
0.7%
0.5%
In 5-6 person carpool
0.5%
0.1%
How many people usually rode to work in the car, truck or van.
Real Estate
Nashville's real estate market is more expensive due to its status as a leading urban center, with property prices and rents being higher compared to Chattanooga, which is more affordable for newcomers looking to establish a home there.
Neighborhoods
Both cities host a variety of neighborhoods to choose from, lending to diverse living experiences. Nashville's upscale neighborhoods like Belle Meade and East Nashville offer trendy eateries and shopping districts, while Chattanooga's North Shore and Downtown are both historic and vibrant, with beautiful parklands and local businesses.
Houses and residents
Type
Nashville-Davidson
Chattanooga
Houses
331,262
86,385
Average household size (people)
2.3
2.3
Median year apartment built
1986
1979
Median year house/condo built
1984
1970
Length of stay in the house since moving in
12.2 years
13.4 years
Houses occupied
305,247 (92.1%)
77,299 (89.5%)
Houses occupied by owners
162,426 (53.2%)
41,455 (53.6%)
Houses occupied by renters
142,821 (46.8%)
35,844 (46.4%)
Median rent asked for vacant for-rent units
$1,391
$1,964
Median monthly housing costs
$1,291
$1,003
Median price asked for vacant for-sale houses and condos
$221,129
$160,185
Estimated median house or condo value
$346,700
$235,900
Median numbers of rooms
5.2
5.3
Median number of rooms in apartments
4.2
4.1
Median number of rooms in houses and condos
6.3
6.4
Median house price - detached houses
$437,686
$286,715
Median house price - in 2-unit structures
$320,904
$238,441
Median house price - in 3-to-4-unit structures
$319,119
$232,475
Median house price - in 5 or more unit structures
$305,249
$350,957
Median house price - mobile homes
$133,346
$45,777
Median house price - Townhouses or other attached units
$328,258
$525,041
Median house price - All housing units
$412,434
$289,858
Median house age
35
47
Renting percentage
44.6%
47.4%
Housing density (houses/condos per square mile)
699.9
638.9
House value disparities
31%
34%
Household income disparities
45.4%
47%
Median household income for houses/condes with a mortgage
$93,092
$93,442
Median household income for apartments without a mortgage
$68,871
$45,013
Housing units without a mortgage
3,189 (2.8%)
739 (2.9%)
Housing units with both a second mortgage and home equity loan
10,988 (9.6%)
1,674 (6.6%)
Housing units with a mortgage
110,850 (97.2%)
24,594 (97.1%)
Housing units with a home equity loan
333 (0.3%)
89 (0.4%)
Housing units with a second mortgage
13,192 (11.6%)
2,103 (8.3%)
House/condo owner moved in on average (years ago)
9
11
House/condo renter moved in on average (years ago)
1
1
Housing units lacking complete kitchen facilities
1.3%
3.1%
Housing units lacking complete plumbing facilities
0.5%
2.3%
Housing units in structures
Housing units in structures
Nashville-Davidson
Chattanooga
One, detached
50.9%
60.6%
One, attached
8.4%
3.7%
Two
3.3%
7.1%
3 or 4
3.1%
3.9%
5 to 9
7.1%
4.1%
10 to 19
8.7%
4.8%
20 to 49
5.3%
7.8%
50 or more
11.9%
7.1%
Mobile homes
1.2%
0.8%
Boats, RVs, vans, etc.
0.1%
0.0%
Median real estate property taxes paid for housing units
Self-employed workers in own not incorporated business
31,952
3,502
State government workers
15,693
4,173
Unpaid family workers
463
224
Industries and Occupations
Nashville's primary industries revolve around music production, healthcare, and finance, with many opportunities in these sectors. On the other hand, Chattanooga's main industries are manufacturing, warehousing, and utilities, offering a different set of job opportunities to its residents.
Both cities have strong health care sectors. Nashville, in particular, is a major healthcare hub with numerous specialized healthcare facilities. Chattanooga also has a robust health care system with CHI Memorial and Erlanger Health System being the top providers.
Health (county statistics)
Type
Nashville-Davidson
Chattanooga
General health status score of residents in this county from 1 (poor) to 5 (excellent)
Nashville-Davidson boasts a more developed and extensive infrastructure, significantly due to its larger size and status as the state's capital. However, Chattanooga is known for its high-speed internet, one of the country's first gigabit-speed networks, making it attractive to tech-savvy populations.
HMDA - Conventional home purchase loans - Applications denied
Year
Nashville-Davidson
Chattanooga
1999
2,397
893
2000
1,451
823
2001
1,130
614
2002
1,075
548
2003
2,231
603
2004
2,731
741
2005
3,231
874
2006
3,720
964
2007
2,419
638
2008
952
230
2009
532
167
Culture and Food
Nashville-Davidson's culture is proudly intertwined with music, being the home of country music. It also offers a wide variety of cuisines, with famous hot chicken being a local favorite. Chattanooga is known for its art scene, outdoor recreational opportunities, and Southern cooking, including the famous Chattanooga choo choo bbq.
Sports Teams
Nashville-Davidson is home to professional sports teams like the Titans (NFL), Predators (NHL), and Nashville SC (MLS). Contrastingly, Chattanooga has minor league teams such as the Lookouts (Baseball), Red Wolves (Soccer), and the Ironman competition.


 Nashville-Davidson, TN and
  Chattanooga, TN : 113.7 miles