Nashville-Davidson, Tennessee, and Durham, North Carolina, are both vibrant and dynamic cities in the Southeastern United States. They offer unique living experiences, filled with culture, notable sporting teams, historical attractions, and bustling economies. Nashville is famous for its country music, while Durham is praised for its academic institutions. When considering relocating or visiting, several factors such as safety, cost of living, education, climate, and health care, among others need to be taken into account. By comparing these areas, potential residents or tourists can make an informed decision based on their individual needs and preferences.
Distance between
Nashville-Davidson, TN and
Durham, NC : 438.7 miles
Nashville-Davidson's population is larger by 138%. Its population has grown by 133,327 people (24.4%) since 2000. The population of Durham has grown by 98,492 people (52.7%) during that time.
Nashville has seen a moderate increase in its crime rate in recent years, particularly in terms of property crimes. However, it's crucial to remember that like any city, crime rates vary by neighborhood. Meanwhile, Durham has a crime rate that is slightly higher than the national average but is on a downward trend. Both cities have police departments that are continually implementing programs to reduce crime and ensure the safety of residents.
Cost of Living
Living in Nashville is relatively affordable compared to many other large cities in the country. The cost of living in Durham, however, is slightly lower, making it even more suitable for people looking for a more economical place to live. Essential commodities in both cities are generally cheaper, and housing costs are also lower than in many other parts of the country.
Income Tax
Tennessee does not levy a state income tax, which can be an advantage for individuals relocating to Nashville. North Carolina, on the other hand, has a state income tax with rates ranging from 5.25%.
Property Tax
Property tax in Nashville is slightly higher than Durham. However, it may still be lower than in other major US cities. Generally, homeowners in both cities find property taxes to be manageable.
Sales Tax
Tennessee has a higher sales tax, with Nashville levying a combined state and local sales tax rate of 9.25%. In contrast, Durham's combined sales tax rate is 7.5%, making North Carolina one of the states with a lower sales tax.
Income
Type
Nashville-Davidson
Durham
Estimated median household income
$64,857
$71,343
Estimated per capita income
$42,268
$42,469
Cost of living index (U.S. average is 100)
90.9
94.1
If you make $50,000 in Nashville-Davidson, you will have to make $51,760 in Durham to maintain the same standard of living.
Geographical Conditions
Nashville is located in the heart of Tennessee and has a relatively flat landscape. Durham, on the other hand, is nestled in the rolling hills of North Carolina, offering beautiful scenic views.
Nashville is home to some prestigious educational institutions, including Vanderbilt University. Public schools in Nashville are part of the Metro Nashville Public Schools. Durham, with Duke University and North Carolina Central University, is renowned for its higher education, but its public school system, Durham Public Schools, has also garnered respect.
Nashville's economy is diverse, with significant sectors including healthcare, music and entertainment, finance, technology, and the automotive industry. Durham is part of the Research Triangle, boasting a strong economy with emphasis on education, health, and technology industries.
Biggest Employers
In Nashville, the biggest employers are Vanderbilt University and Medical Center, Nissan North America, and HCA Healthcare. In Durham, top employers include Duke University and Health System, IBM, and GlaxoSmithKline.
There were 3,932 building permits issued in Nashville-Davidson in 2012 (2854 more than in 2011) compared to 1,960 building permits issued in Durham in 2012 (1077 more than in 2011).
In Nashville-Davidson (Davidson County), 58.5% voted for Democrats and 39.9% for Republicans in 2012 Presidential Election. In Durham (Durham County), 75.8% voted for Democrats and 23.0% for Republicans.
Elections
Type
Democrats
Republicans
Other
Year
Nashville-Davidson
Durham
Nashville-Davidson
Durham
Nashville-Davidson
Durham
2020
65.0%
80.5%
32.6%
18.1%
2.3%
1.4%
2016
60.1%
77.7%
34.1%
18.2%
5.7%
4.2%
2012
58.5%
75.8%
39.9%
23.0%
1.6%
1.2%
2008
60.0%
75.8%
39.0%
23.7%
1.0%
0.5%
2004
54.9%
68.0%
44.6%
31.6%
0.4%
0.3%
2000
57.9%
63.8%
40.4%
35.7%
1.7%
0.5%
1996
79.3%
60.8%
18.1%
34.4%
2.6%
4.8%
Breakdown of population affiliated with a religious congregation
Type
Adherents
Congregations
Religion
Nashville-Davidson
Durham
Nashville-Davidson
Durham
SOUTHERN BAPTIST CONVENTION
14.1%
9.7%
19.6%
20.3%
CATHOLIC CHURCH
4.9%
3.9%
2.3%
1.3%
EPISCOPAL CHURCH
1.5%
1.0%
1.8%
2.0%
SEVENTH DAY ADVENTIST CHURCH
1.1%
0.4%
1.7%
2.0%
COPTIC ORTHODOX CHURCH
1.0%
0.0%
0.5%
0.0%
MUSLIM ESTIMATE
0.8%
0.7%
1.4%
1.6%
PRESBYTERIAN CHURCH IN AMERICA
0.8%
0.4%
0.9%
0.3%
CUMBERLAND PRESBYTERIAN CHURCH
0.4%
0.0%
1.3%
0.0%
EVANGELICAL LUTHERAN CHURCH IN AMERICA
0.2%
0.4%
0.8%
1.3%
AMERICAN BAPTIST CHURCHES IN THE USA
0.1%
3.2%
0.3%
2.9%
Weather
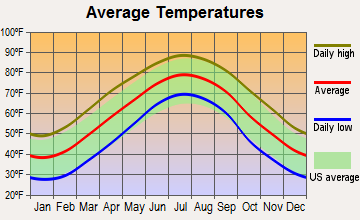
Nashville has a humid subtropical climate, with hot summers and generally mild winters. Durham, also having a humid subtropical climate, tends to be a bit milder. Both cities, however, are known to have quick temperature changes, so layering is a good strategy for visitors and residents alike.
Weather and climate
Type
Nashville-Davidson
Durham
Temperature - Average
58.5°F
59°F
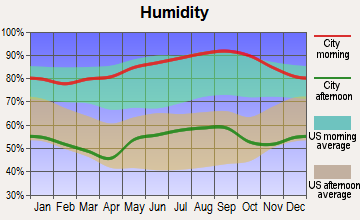
Humidity - Average morning or afternoon humidity
75.9%
73.7%
Humidity - Differences between morning and afternoon humidity
38%
44%
Humidity - Maximum monthly morning or afternoon humidity
89%
90%
Humidity - Minimum monthly morning or afternoon humidity
51%
46%
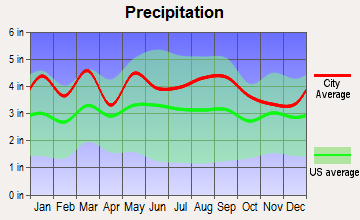
Precipitation - Yearly average
49 in
47.5 in
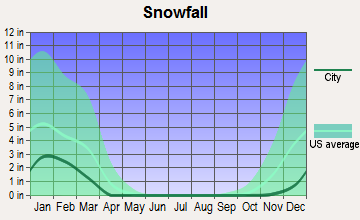
Snowfall - Yearly average
17.8 in
13.4 in
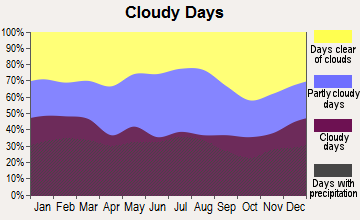
Clouds - Number of days clear of clouds
17.1%
18.5%
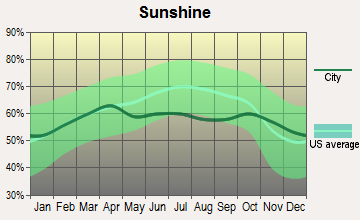
Sunshine amount - Average
59.7%
63.9%
Sunshine amount - Differences during a year
23%
13%
Sunshine amount - Maximum monthly
65%
64%
Sunshine amount - Minimum monthly
42%
51%
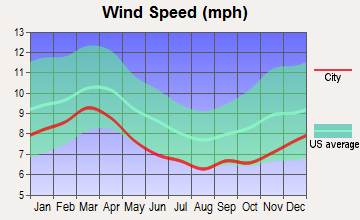
Wind speed - Average
7.7 mph
7.1 mph
Average climate in Nashville-Davidson, Tennessee
Average climate in Durham, North Carolina
Air pollution
Type
AQI
CO
NO2
OZONE
PB
PM10
PM25
SO2
Year
Nashville-Davidson
Durham
Nashville-Davidson
Durham
Nashville-Davidson
Durham
Nashville-Davidson
Durham
Nashville-Davidson
Nashville-Davidson
Durham
Nashville-Davidson
Durham
Nashville-Davidson
Durham
2018
71
70
0.40
0.23
13.8
8.0
24.1
27.9
N/A
N/A
15.2
12.7
9.2
8.8
0.2
0.3
2017
70
68
0.38
0.23
14.4
8.6
26.8
25.8
N/A
N/A
15.3
13.3
8.7
9.2
0.1
0.2
2016
90
79
0.42
0.23
16.1
8.5
26.4
25.8
N/A
N/A
N/A
7.9
10.1
9.4
0.0
0.3
2015
68
78
0.43
0.27
15.5
8.9
23.6
27.6
N/A
N/A
N/A
12.4
10.8
9.0
0.1
0.5
2014
66
74
N/A
0.26
N/A
9.7
26.3
29.7
N/A
N/A
N/A
N/A
9.8
8.2
1.4
0.3
2013
62
73
N/A
0.26
N/A
N/A
N/A
26.4
N/A
N/A
N/A
N/A
9.7
8.0
N/A
0.2
2012
81
77
N/A
0.28
N/A
N/A
28.3
29.0
N/A
N/A
N/A
N/A
11.0
8.4
2.3
0.6
2011
81
83
N/A
0.27
N/A
N/A
25.9
32.0
N/A
N/A
N/A
N/A
11.0
9.8
1.7
0.7
2010
80
94
N/A
0.30
N/A
N/A
24.3
31.2
N/A
N/A
N/A
N/A
12.2
10.1
2.2
1.0
2009
72
78
N/A
0.33
N/A
N/A
22.5
25.3
N/A
N/A
N/A
N/A
11.5
9.8
2.4
1.0
2008
81
95
N/A
0.39
N/A
N/A
25.7
30.1
N/A
N/A
N/A
N/A
13.4
13.1
2.5
1.5
2007
99
98
N/A
0.40
N/A
N/A
27.4
35.4
N/A
N/A
N/A
N/A
15.5
13.9
2.7
1.2
2006
93
90
0.69
0.43
N/A
N/A
24.9
30.1
N/A
N/A
N/A
N/A
14.9
13.5
2.9
0.9
2005
104
73
0.56
0.41
N/A
N/A
23.5
31.4
N/A
N/A
N/A
N/A
16.9
N/A
3.1
2.5
2004
83
63
0.61
0.44
N/A
N/A
22.0
27.9
0.006
N/A
N/A
N/A
N/A
N/A
2.6
3.7
2003
93
84
0.67
N/A
N/A
N/A
18.5
29.4
0.005
N/A
N/A
N/A
15.8
N/A
3.8
3.0
2002
92
89
0.67
N/A
N/A
N/A
20.2
35.3
N/A
N/A
N/A
N/A
15.3
N/A
4.3
2.6
2001
95
86
0.89
N/A
N/A
N/A
19.5
30.7
N/A
N/A
N/A
N/A
15.6
N/A
4.5
2.2
2000
97
102
0.74
0.65
N/A
N/A
19.8
32.4
N/A
N/A
N/A
N/A
N/A
N/A
4.1
N/A
Natural disasters
Type
Nashville-Davidson
Durham
Tornado activity compared to U.S. average
169.1%
84.9%
Earthquake activity compared to U.S. average
296.1%
55.7%
Natural disasters compared to U.S. average
17%
16%
Transportation
Nashville relies heavily on car transportation, but it does have a city bus system and a commuter rail service. Durham's transportation system is a bit more comprehensive with bus service, a free downtown shuttle, and an efficient highway system for car commuters.
Transport
Type
Nashville-Davidson
Durham
Amtrak stations
0
1
Amtrak stations nearby
1
2
FAA registered aircraft
0
100
FAA registered aircraft manufacturers and dealers
0
4
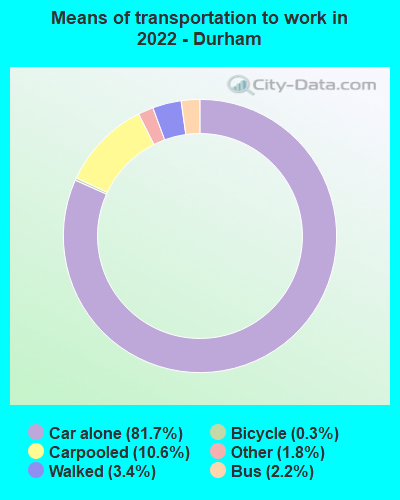
Means of transportation to work
Type
Nashville-Davidson
Durham
Bicycle
0.3%
0.6%
Bus
1.2%
1.3%
Carpooled
9.8%
9.3%
Car alone
85.5%
84.4%
Railroad
0%
0.1%
Taxicab
0.1%
0.2%
Walked
1.8%
2.1%
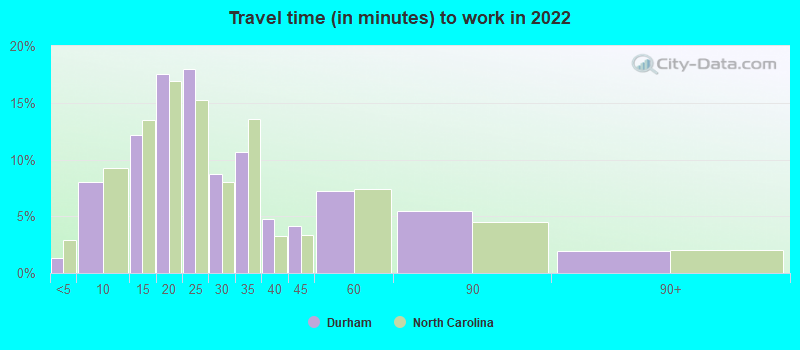
Average travel time to work
Type
Nashville-Davidson
Durham
Average
31.3 min
27.4 min
Other means
23.4 min
21.3 min
Public transportation
38.9 min
36.9 min
Private vehicle occupancy
Type
Nashville-Davidson
Durham
Average
1.2
1.2
Drove alone
88.7%
89.5%
In 2 person carpool
8.5%
7.9%
In 3 person carpool
1.6%
2.2%
In 4 person carpool
0.7%
0.1%
In 5-6 person carpool
0.5%
0%
In 7+ person carpool
0%
0.4%
How many people usually rode to work in the car, truck or van.
Real Estate
The real estate market in both cities is booming. Nashville, with a slightly more significant growth rate, is becoming a desirable location for homebuyers looking for urban living. In comparison, Durham offers a more serene setting with affordability, making it attractive for families and retirees.
Neighborhoods
Each city has a variety of neighborhoods to suit different needs and lifestyles. In Nashville, you'll find areas like East Nashville for artsy types, Belle Meade for upscale living, and The Gulch for young professionals. Durham has areas like Ninth Street for students, Watts-Hillandale for historical charm, and Southpoint for shopping and entertainment.
Houses and residents
Type
Nashville-Davidson
Durham
Houses
331,262
131,917
Average household size (people)
2.3
2.3
Median year apartment built
1986
1994
Median year house/condo built
1984
1995
Length of stay in the house since moving in
12.2 years
10.7 years
Houses occupied
305,247 (92.1%)
122,412 (92.8%)
Houses occupied by owners
162,426 (53.2%)
62,550 (51.1%)
Houses occupied by renters
142,821 (46.8%)
59,862 (48.9%)
Median rent asked for vacant for-rent units
$1,391
$2,314
Median monthly housing costs
$1,291
$1,261
Median price asked for vacant for-sale houses and condos
$221,129
$117,283
Estimated median house or condo value
$346,700
$325,000
Median numbers of rooms
5.2
5.1
Median number of rooms in apartments
4.2
4
Median number of rooms in houses and condos
6.3
6.6
Median house price - detached houses
$437,686
$361,977
Median house price - in 2-unit structures
$320,904
$169,611
Median house price - in 3-to-4-unit structures
$319,119
$259,774
Median house price - in 5 or more unit structures
$305,249
$194,008
Median house price - mobile homes
$133,346
$83,086
Median house price - Townhouses or other attached units
$328,258
$286,940
Median house price - All housing units
$412,434
$350,027
Median house age
35
26
Renting percentage
44.6%
50.2%
Housing density (houses/condos per square mile)
699.9
1,394
House value disparities
31%
29.7%
Household income disparities
45.4%
44.4%
Median household income for houses/condes with a mortgage
$93,092
$106,360
Median household income for apartments without a mortgage
$68,871
$79,496
Housing units without a mortgage
3,189 (2.8%)
1,538 (3.1%)
Housing units with both a second mortgage and home equity loan
10,988 (9.6%)
3,157 (6.4%)
Housing units with a mortgage
110,850 (97.2%)
47,533 (96.9%)
Housing units with a home equity loan
333 (0.3%)
99 (0.2%)
Housing units with a second mortgage
13,192 (11.6%)
3,728 (7.6%)
House/condo owner moved in on average (years ago)
9
6
House/condo renter moved in on average (years ago)
1
1
Housing units lacking complete kitchen facilities
1.3%
1.1%
Housing units lacking complete plumbing facilities
0.5%
0.6%
Housing units in structures
Housing units in structures
Nashville-Davidson
Durham
One, detached
50.9%
50.1%
One, attached
8.4%
9.8%
Two
3.3%
2.5%
3 or 4
3.1%
5.2%
5 to 9
7.1%
8.5%
10 to 19
8.7%
11.1%
20 to 49
5.3%
4.5%
50 or more
11.9%
8.1%
Mobile homes
1.2%
0.3%
Boats, RVs, vans, etc.
0.1%
0.0%
Median real estate property taxes paid for housing units
Self-employed workers in own not incorporated business
31,952
5,381
State government workers
15,693
13,743
Unpaid family workers
463
371
Industries and Occupations
In Nashville, the health care industry is the largest non-governmental employer, contributing billions to the city's economy. The music and entertainment industry also plays a significant role. In Durham, the tech industry is flourishing, with several start-ups and global companies making Durham their home.
Both cities are known for their high-quality healthcare facilities and services. Nashville is home to the Vanderbilt University Medical Center, rated one of the best in the nation. Durham has the Duke University Hospital, which is also considered one of the top hospitals in the country.
Health (county statistics)
Type
Nashville-Davidson
Durham
General health status score of residents in this county from 1 (poor) to 5 (excellent)
Nashville's infrastructure includes an international airport, an interstate highway system, and a city-wide bus system. Durham also has a robust infrastructure with an excellent road network, an international airport, and a reliable public transit system.
HMDA - Conventional home purchase loans - Applications denied
Year
Nashville-Davidson
Durham
1999
2,397
991
2000
1,451
666
2001
1,130
510
2002
1,075
440
2003
2,231
369
2004
2,731
485
2005
3,231
593
2006
3,720
846
2007
2,419
610
2008
952
231
2009
532
144
Culture and Food
Nashville is known worldwide as "Music City" for its rich musical heritage, especially country music. It's also famous for its Southern comfort food and barbecue. Durham has a strong arts scene, with multiple theaters, galleries, and music venues. The city also has a rising food scene, with numerous restaurants and notable culinary festivals.
Sports Teams
Nashville is home to the NFL's Tennessee Titans and NHL's Nashville Predators. It also recently welcomed an MLS team, Nashville SC. Durham has minor league baseball with the Durham Bulls and college basketball at Duke University.


 Nashville-Davidson, TN and
  Durham, NC : 438.7 miles