Both Nashville-Davidson and Knoxville are vibrant cities in Tennessee, each offering a unique blend of southern charm and city living. With a larger population and a more extensive entertainment scene, Nashville-Davidson stands as a more metropolitan city compared to the quieter, more laid-back ambiance of Knoxville. Comparing living in Nashville-Davidson to Knoxville entails looking at crime/safety, weather, cost of living, education, work and economy, infrastructure, industries and occupations, biggest employers, real-estate, neighborhoods, and many more. Let's delve into these variables to properly assess the cities' offerings.
Distance between
Nashville-Davidson, TN and
Knoxville, TN : 158.0 miles
Nashville-Davidson's population is larger by 252%. Its population has grown by 133,327 people (24.4%) since 2000. The population of Knoxville has grown by 18,758 people (10.8%) during that time.
Nashville-Davidson's crime rate is significantly higher than the national average, and also higher than in Knoxville. Violent and property crimes are more common in the former, making it less safe. On the other hand, Knoxville has a slightly lower crime rate than the national average and puts substantial emphasis on community policing initiatives, making it relatively safer for visitors and potential residents alike.
Cost of Living
Nashville-Davidson's cost of living is considerably higher than Knoxville's. Housing, in particular, is more expensive in Nashville, with median home costs significantly surpassing those in Knoxville. Other areas, such as health care, groceries, and transportation, are all higher in Nashville-Davidson as well. Knoxville offers a more affordable lifestyle with its lower overall cost of living.
Income Tax
Tennessee does not impose a state income tax, which applies to both Nashville-Davidson and Knoxville. This is a beneficial factor for residents considering the move to either city.
Property Tax
Nashville-Davidson's property tax rates are higher than those in Knoxville. For homeowners, this is an important consideration, making Knoxville the more affordable option for home ownership.
Sales Tax
Both cities impose the state's sales tax of 7%, but Nashville-Davidson's total sales tax is higher due to an additional local sales tax. This makes Knoxville more tax-friendly for purchases.
Income
Type
Nashville-Davidson
Knoxville
Estimated median household income
$64,857
$45,700
Estimated per capita income
$42,268
$31,855
Cost of living index (U.S. average is 100)
90.9
86.5
If you make $50,000 in Knoxville, you will have to make $52,543 in Nashville-Davidson to maintain the same standard of living.
Geographical Conditions
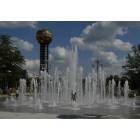
Both cities are located in hill country, but Knoxville, tucked in the Great Smoky Mountains, offers more opportunities for hiking and mountain biking. Nashville-Davidson, in the Cumberland River Valley, provides extensive parklands for outdoor enthusiasts.
Both cities house some notable institutes of higher education. Nashville-Davidson is home to Vanderbilt University, one of the top-ranked universities in the nation. Conversely, Knoxville houses the University of Tennessee, which is known for its research programs. However, Nashville has a slightly higher high school graduation rate compared to Knoxville.
The economy of Nashville-Davidson is more diversified and robust than that of Knoxville, with sectors like healthcare, finance, and music playing key roles. Meanwhile, Knoxville's economy relies heavily on retail trade, healthcare, and education. The unemployment rate is generally lower in Nashville.
Biggest Employers
Vanderbilt University Medical Center, Nissan North America, and HCA Healthcare are amongst the largest employers in Nashville-Davidson. As for Knoxville, the University of Tennessee, Covenant Health, and the U.S. Department of Energy's Oak Ridge facilities provide many job opportunities.
There were 3,932 building permits issued in Nashville-Davidson in 2012 (2854 more than in 2011) compared to 261 building permits issued in Knoxville in 2012 (94 more than in 2011).
In Nashville-Davidson (Davidson County), 58.5% voted for Democrats and 39.9% for Republicans in 2012 Presidential Election. In Knoxville (Knox County), 34.5% voted for Democrats and 63.7% for Republicans.
Elections
Type
Democrats
Republicans
Other
Year
Nashville-Davidson
Knoxville
Nashville-Davidson
Knoxville
Nashville-Davidson
Knoxville
2020
65.0%
41.8%
32.6%
56.9%
2.3%
1.3%
2016
60.1%
34.9%
34.1%
58.8%
5.7%
6.3%
2012
58.5%
34.5%
39.9%
63.7%
1.6%
1.8%
2008
60.0%
37.8%
39.0%
60.9%
1.0%
1.3%
2004
54.9%
37.0%
44.6%
62.1%
0.4%
0.9%
2000
57.9%
40.6%
40.4%
57.9%
1.7%
1.5%
1996
79.3%
22.6%
18.1%
74.4%
2.6%
3.0%
Breakdown of population affiliated with a religious congregation
Type
Adherents
Congregations
Religion
Nashville-Davidson
Knoxville
Nashville-Davidson
Knoxville
SOUTHERN BAPTIST CONVENTION
14.1%
29.7%
19.6%
32.9%
CATHOLIC CHURCH
4.9%
5.1%
2.3%
1.3%
EPISCOPAL CHURCH
1.5%
1.0%
1.8%
1.4%
SEVENTH DAY ADVENTIST CHURCH
1.1%
0.3%
1.7%
1.3%
COPTIC ORTHODOX CHURCH
1.0%
0.0%
0.5%
0.2%
MUSLIM ESTIMATE
0.8%
0.2%
1.4%
0.5%
PRESBYTERIAN CHURCH IN AMERICA
0.8%
0.4%
0.9%
0.7%
CUMBERLAND PRESBYTERIAN CHURCH
0.4%
0.5%
1.3%
1.3%
LUTHERAN CHURCH
0.3%
0.4%
0.9%
0.5%
EVANGELICAL LUTHERAN CHURCH IN AMERICA
0.2%
0.5%
0.8%
0.9%
Weather
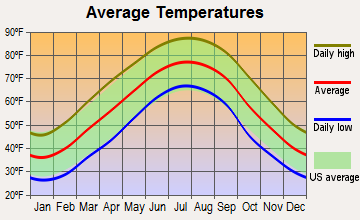
Both cities experience a humid subtropical climate. Knoxville sees colder winters due to its location in the Appalachian Mountains, and its summers are a bit cooler as well, making it ideal for outdoor activities. Nashville-Davidson, in contrast, enjoys a slightly milder climate due to its position in the central part of the state, yet the differences are not profoundly significant.
Weather and climate
Type
Nashville-Davidson
Knoxville
Temperature - Average
58.5°F
57.4°F
Humidity - Average morning or afternoon humidity
75.9%
76.7%
Humidity - Differences between morning and afternoon humidity
38%
39%
Humidity - Maximum monthly morning or afternoon humidity
89%
90%
Humidity - Minimum monthly morning or afternoon humidity
51%
51%
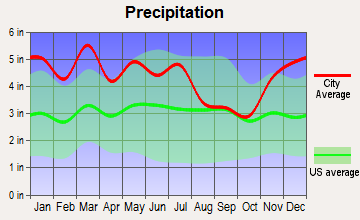
Precipitation - Yearly average
49 in
52.1 in
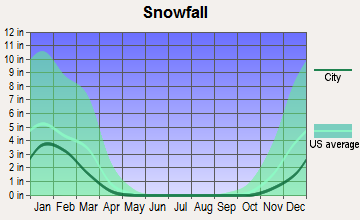
Snowfall - Yearly average
17.8 in
18 in
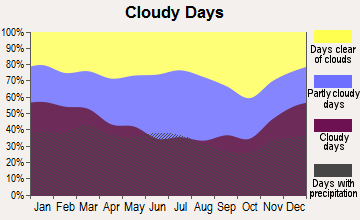
Clouds - Number of days clear of clouds
17.1%
16.8%
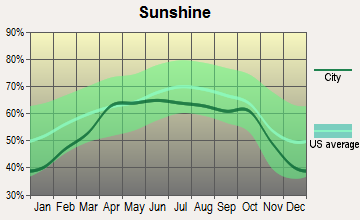
Sunshine amount - Average
59.7%
62.4%
Sunshine amount - Differences during a year
23%
26%
Sunshine amount - Maximum monthly
65%
67%
Sunshine amount - Minimum monthly
42%
41%
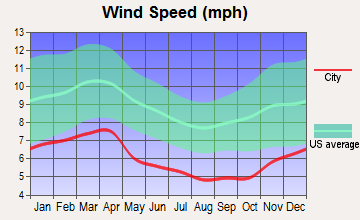
Wind speed - Average
7.7 mph
6.5 mph
Average climate in Nashville-Davidson, Tennessee
Average climate in Knoxville, Tennessee
Air pollution
Type
AQI
CO
NO2
OZONE
PB
PM10
PM25
SO2
Year
Nashville-Davidson
Knoxville
Nashville-Davidson
Knoxville
Nashville-Davidson
Knoxville
Nashville-Davidson
Knoxville
Nashville-Davidson
Knoxville
Nashville-Davidson
Knoxville
Nashville-Davidson
Knoxville
Nashville-Davidson
Knoxville
2018
71
71
0.40
0.17
13.8
0.6
24.1
28.8
N/A
N/A
15.2
17.0
9.2
9.4
0.2
0.6
2017
70
68
0.38
0.16
14.4
0.6
26.8
30.6
N/A
N/A
15.3
16.5
8.7
8.5
0.1
0.2
2016
90
71
0.42
0.18
16.1
0.8
26.4
32.7
N/A
N/A
N/A
19.1
10.1
N/A
0.0
0.5
2015
68
68
0.43
0.17
15.5
0.8
23.6
28.8
N/A
0.009
N/A
26.0
10.8
N/A
0.1
1.8
2014
66
62
N/A
0.14
N/A
N/A
26.3
29.2
N/A
0.011
N/A
23.7
9.8
N/A
1.4
1.6
2013
62
60
N/A
0.14
N/A
N/A
N/A
28.9
N/A
N/A
N/A
22.3
9.7
N/A
N/A
0.6
2012
81
92
N/A
0.16
N/A
N/A
28.3
32.1
N/A
N/A
N/A
24.9
11.0
N/A
2.3
0.4
2011
81
91
N/A
0.20
N/A
N/A
25.9
34.0
N/A
N/A
N/A
28.1
11.0
N/A
1.7
0.6
2010
80
94
N/A
0.18
N/A
0.9
24.3
32.3
N/A
N/A
N/A
29.2
12.2
N/A
2.2
0.9
2009
72
66
N/A
0.17
N/A
0.7
22.5
28.7
N/A
0.018
N/A
23.6
11.5
N/A
2.4
0.7
2008
81
96
N/A
0.18
N/A
N/A
25.7
33.2
N/A
0.023
N/A
32.5
13.4
N/A
2.5
1.5
2007
99
105
N/A
0.16
N/A
N/A
27.4
35.5
N/A
0.017
N/A
36.0
15.5
N/A
2.7
1.6
2006
93
98
0.69
N/A
N/A
N/A
24.9
30.2
N/A
0.024
N/A
36.3
14.9
N/A
2.9
2.3
2005
104
108
0.56
N/A
N/A
N/A
23.5
27.7
N/A
N/A
N/A
34.6
16.9
N/A
3.1
N/A
2004
83
103
0.61
N/A
N/A
N/A
22.0
24.9
0.006
0.015
N/A
41.2
N/A
N/A
2.6
N/A
2003
93
112
0.67
N/A
N/A
N/A
18.5
23.4
0.005
0.010
N/A
40.7
15.8
N/A
3.8
2.8
2002
92
112
0.67
N/A
N/A
N/A
20.2
28.3
N/A
N/A
N/A
35.1
15.3
N/A
4.3
3.4
2001
95
109
0.89
N/A
N/A
N/A
19.5
28.9
N/A
N/A
N/A
35.6
15.6
N/A
4.5
3.3
2000
97
122
0.74
N/A
N/A
11.8
19.8
25.2
N/A
N/A
N/A
34.2
N/A
N/A
4.1
2.5
Natural disasters
Type
Nashville-Davidson
Knoxville
Tornado activity compared to U.S. average
169.1%
64.8%
Earthquake activity compared to U.S. average
296.1%
177.6%
Natural disasters compared to U.S. average
17%
13%
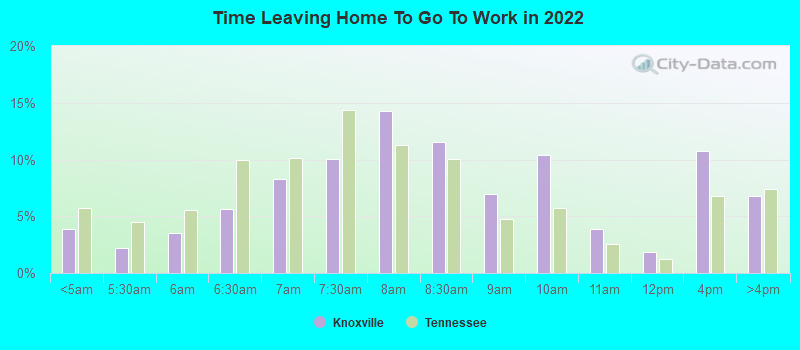
Transportation
Nashville has a more extensive public transit system, including buses and commuter trains, but traffic can be challenging due to its large population. Knoxville has a decent bus system operated by Knoxville Area Transit, but it’s more car-centric. Both cities offer bike-sharing programs.
Transport
Type
Nashville-Davidson
Knoxville
Amtrak stations nearby
1
0
FAA registered aircraft
0
366
FAA registered aircraft manufacturers and dealers
0
19
Means of transportation to work
Type
Nashville-Davidson
Knoxville
Bicycle
0.3%
0%
Bus
1.2%
0.6%
Carpooled
9.8%
5.5%
Car alone
85.5%
91.4%
Taxicab
0.1%
0.1%
Walked
1.8%
1.5%
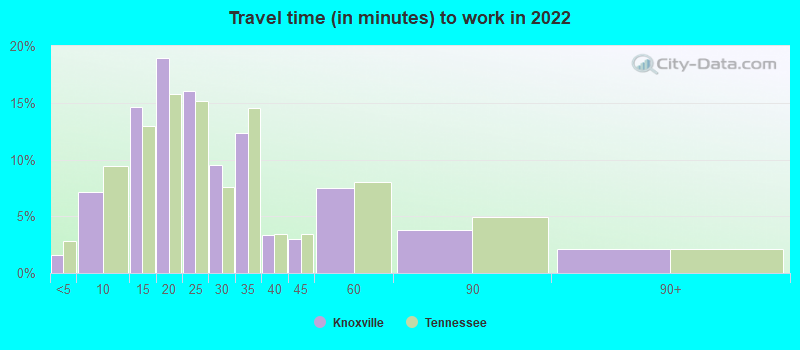
Average travel time to work
Type
Nashville-Davidson
Knoxville
Average
31.3 min
26.5 min
Other means
23.4 min
20.9 min
Public transportation
38.9 min
33.4 min
Private vehicle occupancy
Type
Nashville-Davidson
Knoxville
Average
1.2
1.1
Drove alone
88.7%
91.4%
In 2 person carpool
8.5%
6.8%
In 3 person carpool
1.6%
0.7%
In 4 person carpool
0.7%
0.5%
In 5-6 person carpool
0.5%
0.2%
How many people usually rode to work in the car, truck or van.
Real Estate
Real estate in Nashville-Davidson, while more expensive, is in high demand due to its vibrant culture and economy, resulting in better-investing prospects. Knoxville's market, on the other hand, is more affordable and stable, offering good value for money.
Neighborhoods
Nashville-Davidson's neighborhoods range from trendy urban areas like East Nashville to upscale locales like Belle Meade. This variety caters to different lifestyle and budget preferences. Knoxville's neighborhoods, such as Fort Sanders and Old City, offer a quieter, more community-oriented atmosphere.
Houses and residents
Type
Nashville-Davidson
Knoxville
Houses
331,262
94,457
Average household size (people)
2.3
2.2
Median year apartment built
1986
1978
Median year house/condo built
1984
1964
Length of stay in the house since moving in
12.2 years
13.2 years
Houses occupied
305,247 (92.1%)
85,151 (90.1%)
Houses occupied by owners
162,426 (53.2%)
40,535 (47.6%)
Houses occupied by renters
142,821 (46.8%)
44,616 (52.4%)
Median rent asked for vacant for-rent units
$1,391
$882.25
Median monthly housing costs
$1,291
$945
Median price asked for vacant for-sale houses and condos
$221,129
$134,979
Estimated median house or condo value
$346,700
$193,600
Median numbers of rooms
5.2
5
Median number of rooms in apartments
4.2
4.1
Median number of rooms in houses and condos
6.3
6.2
Median house price - detached houses
$437,686
$261,152
Median house price - in 2-unit structures
$320,904
$185,738
Median house price - in 3-to-4-unit structures
$319,119
$206,216
Median house price - in 5 or more unit structures
$305,249
$237,681
Median house price - mobile homes
$133,346
$92,571
Median house price - Townhouses or other attached units
$328,258
$225,200
Median house price - All housing units
$412,434
$256,619
Median house age
35
49
Renting percentage
44.6%
50.8%
Housing density (houses/condos per square mile)
699.9
1,019.4
House value disparities
31%
34.8%
Household income disparities
45.4%
47.9%
Median household income for houses/condes with a mortgage
$93,092
$76,198
Median household income for apartments without a mortgage
$68,871
$58,442
Housing units without a mortgage
3,189 (2.8%)
497 (1.9%)
Housing units with both a second mortgage and home equity loan
10,988 (9.6%)
1,206 (4.7%)
Housing units with a mortgage
110,850 (97.2%)
25,330 (98.1%)
Housing units with a home equity loan
333 (0.3%)
167 (0.6%)
Housing units with a second mortgage
13,192 (11.6%)
1,649 (6.4%)
House/condo owner moved in on average (years ago)
9
10
House/condo renter moved in on average (years ago)
1
1
Housing units lacking complete kitchen facilities
1.3%
2.6%
Housing units lacking complete plumbing facilities
0.5%
1.8%
Housing units in structures
Housing units in structures
Nashville-Davidson
Knoxville
One, detached
50.9%
54.1%
One, attached
8.4%
5.2%
Two
3.3%
3.2%
3 or 4
3.1%
4.2%
5 to 9
7.1%
8.3%
10 to 19
8.7%
9.2%
20 to 49
5.3%
6.5%
50 or more
11.9%
8.7%
Mobile homes
1.2%
0.7%
Boats, RVs, vans, etc.
0.1%
0.0%
Median real estate property taxes paid for housing units
Self-employed workers in own not incorporated business
31,952
6,351
State government workers
15,693
7,257
Unpaid family workers
463
197
Industries and Occupations
The music and entertainment industry is a prominent part of Nashville-Davidson's economy, providing many jobs. Healthcare and retail trade are strong sectors as well. In Knoxville, while the healthcare and retail trade sectors are also significant, the education sector, particularly through the University of Tennessee, is a major employer.
Nashville-Davidson, with its network of hospitals including the highly-rated Vanderbilt University Medical Center, excels in healthcare services. Knoxville, while having a number of good hospitals like the University of Tennessee Medical Center, is slightly behind Nashville in healthcare infrastructure and quality.
Health (county statistics)
Type
Nashville-Davidson
Knoxville
General health status score of residents in this county from 1 (poor) to 5 (excellent)
Nashville-Davidson's infrastructure is more developed and dense due to its larger population. It has a more expansive road network, more public buildings, and larger airports. Knoxville, although smaller and less populated, does have a solid infrastructure, but it pales in comparison with Nashville's.
HMDA - Conventional home purchase loans - Applications denied
Year
Nashville-Davidson
Knoxville
1999
2,397
1,372
2000
1,451
1,152
2001
1,130
886
2002
1,075
1,367
2003
2,231
1,014
2004
2,731
1,080
2005
3,231
1,218
2006
3,720
1,159
2007
2,419
701
2008
952
329
2009
532
222
Culture and Food
Nashville is renowned as the heart of country music and offers a vibrant food scene with a wide variety of cuisines. Knoxville, while also offering a variety of food options, has a quieter cultural scene colored by its artisan atmosphere and active outdoor community.
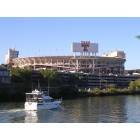
Sports Teams
Nashville-Davidson is home to NFL's Tennessee Titans and NHL's Nashville Predators. Knoxville doesn't host any major league sports teams but maintains a passionate sports culture around the University of Tennessee’s teams, particularly its football team, the Volunteers.


 Nashville-Davidson, TN and
  Knoxville, TN : 158.0 miles