Comparing Nashville-Davidson, TN, and New Orleans, LA, brings to light significant differences and unique aspects for both cities. Key areas such as crime and safety, weather, cost of living, and work and economy play pivotal roles in making a decision whether for relocation or for a visit. These two southern cities offer a variety of facilities, cultural richness, regional cuisines, and sports experiences. Let's dive deep into these cities' features to have a better comparative understanding.
Distance between
Nashville-Davidson, TN and
New Orleans, LA : 467.7 miles
Nashville-Davidson's population is larger by 80%. Its population has grown by 133,327 people (24.4%) since 2000. The population of New Orleans has decreased by 107,703 people (22.2%) during that time.
Both Nashville-Davidson and New Orleans have higher crime rates than the national average, with New Orleans typically ranking higher. While both cities have implemented numerous initiatives to mitigate crime, prospective residents and visitors should be aware of their surroundings. Neighborhoods vary widely in both cities, and crime rates can change drastically from one area to another.
Cost of Living
In comparison to New Orleans, Nashville-Davidson generally has a higher cost of living, particularly when it comes to housing. Groceries, utilities, and transportation, however, are comparatively lower in Nashville-Davidson. Both cities offer a range of options for different budgets.
Income Tax
Tennessee, including Nashville-Davidson, does not have a state income tax. Louisiana has a state income tax with rates ranging from 2% to 6% depending on income level.
Property Tax
Property taxes are moderate in both cities. Nashville-Davidson has a rate of 0.742%, while New Orleans’ rate is 0.855%.
Sales Tax
Nashville-Davidson has a combined city and state sales tax rate of 9.75%, while New Orleans has a higher combined tax rate of 9.45%. These are among the highest sales taxes in the US.
Income
Type
Nashville-Davidson
New Orleans
Estimated median household income
$64,857
$46,942
Estimated per capita income
$42,268
$35,587
Cost of living index (U.S. average is 100)
90.9
97.9
If you make $50,000 in Nashville-Davidson, you will have to make $53,850 in New Orleans to maintain the same standard of living.
Geographical Conditions
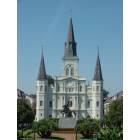
Nashville-Davidson is located in central Tennessee and is known for its rolling hills and Cumberland River. New Orleans is located in southeastern Louisiana and is known for being below sea level, its proximity to the Gulf of Mexico, the Mississippi River and its bayous.
Both Nashville-Davidson and New Orleans have robust education systems with numerous public, private, and charter schools. Nashville's Vanderbilt University is nationally renowned, while New Orleans is home to Tulane University, one of the top ranking universities in the US.
Nashville-Davidson benefits from a diverse economy with strong healthcare, education, and music industries. New Orleans’ economy leans heavily on tourism, shipping, and petroleum. Both cities offer a range of job opportunities but the key industries vary.
Biggest Employers
The biggest employers in Nashville-Davidson include Vanderbilt University and Medical Center, Nissan North America, and HCA Healthcare. In New Orleans, Ochsner Health System, Tulane University, and the U.S. Naval Air Station Joint Reserve Base are amongst the largest employers.
There were 3,932 building permits issued in Nashville-Davidson in 2012 (2854 more than in 2011) compared to 716 building permits issued in New Orleans in 2012 (1 less than in 2011).
In Nashville-Davidson (Davidson County), 58.5% voted for Democrats and 39.9% for Republicans in 2012 Presidential Election. In New Orleans (Orleans Parish), 80.5% voted for Democrats and 17.8% for Republicans.
Elections
Type
Democrats
Republicans
Other
Year
Nashville-Davidson
New Orleans
Nashville-Davidson
New Orleans
Nashville-Davidson
New Orleans
2020
65.0%
83.6%
32.6%
15.1%
2.3%
1.3%
2016
60.1%
81.1%
34.1%
14.7%
5.7%
4.2%
2012
58.5%
80.5%
39.9%
17.8%
1.6%
1.7%
2008
60.0%
79.6%
39.0%
19.1%
1.0%
1.3%
2004
54.9%
77.8%
44.6%
21.8%
0.4%
0.4%
2000
57.9%
76.2%
40.4%
21.8%
1.7%
2.0%
1996
79.3%
90.7%
18.1%
8.2%
2.6%
1.2%
Breakdown of population affiliated with a religious congregation
Type
Adherents
Congregations
Religion
Nashville-Davidson
New Orleans
Nashville-Davidson
New Orleans
SOUTHERN BAPTIST CONVENTION
14.1%
4.3%
19.6%
13.0%
CATHOLIC CHURCH
4.9%
30.9%
2.3%
16.0%
EPISCOPAL CHURCH
1.5%
1.5%
1.8%
4.2%
SEVENTH DAY ADVENTIST CHURCH
1.1%
1.1%
1.7%
1.8%
COPTIC ORTHODOX CHURCH
1.0%
0.0%
0.5%
0.3%
MUSLIM ESTIMATE
0.8%
0.5%
1.4%
1.8%
PRESBYTERIAN CHURCH IN AMERICA
0.8%
0.1%
0.9%
0.6%
CUMBERLAND PRESBYTERIAN CHURCH
0.4%
0.0%
1.3%
0.0%
LUTHERAN CHURCH
0.3%
0.5%
0.9%
3.9%
AMERICAN BAPTIST CHURCHES IN THE USA
0.1%
0.6%
0.3%
0.6%
Weather
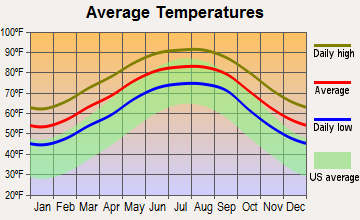
Nashville-Davidson experiences four distinct seasons with hot, humid summers, and mild winters. New Orleans, on the other hand, experiences a subtropical climate with long, hot, and humid summers and short, mild winters. Both cities can experience occasional heavy rains and storms.
Weather and climate
Type
Nashville-Davidson
New Orleans
Temperature - Average
58.5°F
69.6°F
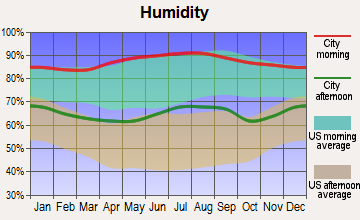
Humidity - Average morning or afternoon humidity
75.9%
80.8%
Humidity - Differences between morning and afternoon humidity
38%
32%
Humidity - Maximum monthly morning or afternoon humidity
89%
91%
Humidity - Minimum monthly morning or afternoon humidity
51%
59%
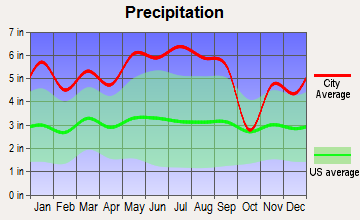
Precipitation - Yearly average
49 in
62.2 in
Snowfall - Yearly average
17.8 in
0.2 in
Clouds - Number of days clear of clouds
17.1%
16.9%
Sunshine amount - Average
59.7%
63.7%
Sunshine amount - Differences during a year
23%
22%
Sunshine amount - Maximum monthly
65%
70%
Sunshine amount - Minimum monthly
42%
48%
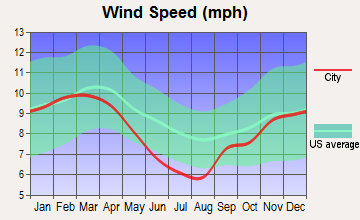
Wind speed - Average
7.7 mph
8.7 mph
Average climate in Nashville-Davidson, Tennessee
Average climate in New Orleans, Louisiana
Air pollution
Type
AQI
CO
NO2
OZONE
PB
PM10
PM25
SO2
Year
Nashville-Davidson
New Orleans
Nashville-Davidson
New Orleans
Nashville-Davidson
New Orleans
Nashville-Davidson
New Orleans
Nashville-Davidson
Nashville-Davidson
New Orleans
Nashville-Davidson
New Orleans
Nashville-Davidson
New Orleans
2018
71
75
0.40
N/A
13.8
5.5
24.1
27.9
N/A
N/A
15.2
19.6
9.2
9.5
0.2
1.1
2017
70
73
0.38
N/A
14.4
6.0
26.8
27.6
N/A
N/A
15.3
18.8
8.7
9.5
0.1
1.6
2016
90
71
0.42
N/A
16.1
6.7
26.4
29.1
N/A
N/A
N/A
16.5
10.1
9.4
0.0
1.7
2015
68
76
0.43
N/A
15.5
6.3
23.6
26.5
N/A
N/A
N/A
17.5
10.8
8.8
0.1
1.3
2014
66
79
N/A
N/A
N/A
6.7
26.3
25.6
N/A
N/A
N/A
17.7
9.8
7.7
1.4
2.0
2013
62
73
N/A
N/A
N/A
6.5
N/A
25.8
N/A
N/A
N/A
17.8
9.7
7.4
N/A
2.6
2012
81
84
N/A
N/A
N/A
7.8
28.3
26.8
N/A
N/A
N/A
24.0
11.0
10.0
2.3
2.5
2011
81
93
N/A
N/A
N/A
7.8
25.9
27.0
N/A
N/A
N/A
24.9
11.0
8.8
1.7
2.1
2010
80
89
N/A
N/A
N/A
7.8
24.3
27.5
N/A
N/A
N/A
26.7
12.2
9.5
2.2
2.9
2009
72
81
N/A
N/A
N/A
7.6
22.5
26.5
N/A
N/A
N/A
N/A
11.5
9.1
2.4
2.8
2008
81
81
N/A
N/A
N/A
9.3
25.7
27.3
N/A
N/A
N/A
N/A
13.4
10.0
2.5
3.0
2007
99
97
N/A
N/A
N/A
9.1
27.4
28.4
N/A
N/A
N/A
N/A
15.5
10.2
2.7
3.6
2006
93
93
0.69
N/A
N/A
9.7
24.9
28.7
N/A
N/A
N/A
N/A
14.9
11.2
2.9
N/A
2005
104
93
0.56
0.58
N/A
9.0
23.5
24.7
N/A
N/A
N/A
N/A
16.9
10.6
3.1
N/A
2004
83
96
0.61
0.68
N/A
9.5
22.0
21.3
0.006
N/A
N/A
N/A
N/A
10.3
2.6
N/A
2003
93
91
0.67
0.84
N/A
9.9
18.5
19.5
0.005
N/A
N/A
N/A
15.8
11.5
3.8
N/A
2002
92
68
0.67
0.61
N/A
9.3
20.2
20.2
N/A
N/A
N/A
N/A
15.3
N/A
4.3
N/A
2001
95
88
0.89
0.81
N/A
10.2
19.5
20.6
N/A
N/A
N/A
N/A
15.6
N/A
4.5
N/A
2000
97
105
0.74
0.55
N/A
11.3
19.8
24.5
N/A
N/A
N/A
N/A
N/A
N/A
4.1
N/A
Natural disasters
Type
Nashville-Davidson
New Orleans
Tornado activity compared to U.S. average
169.1%
125.4%
Earthquake activity compared to U.S. average
296.1%
44.4%
Natural disasters compared to U.S. average
17%
21%
Transportation
Nashville-Davidson has a considerably developed transit system, with buses and commuter trains, including the Music City Star. New Orleans offers bus, tram and ferry services but fewer commuter rail services. Both cities suffer from traffic congestion and are best navigated with a private vehicle.
Transport
Type
Nashville-Davidson
New Orleans
Amtrak stations
0
1
Amtrak stations nearby
1
1
FAA registered aircraft
0
201
FAA registered aircraft manufacturers and dealers
0
2
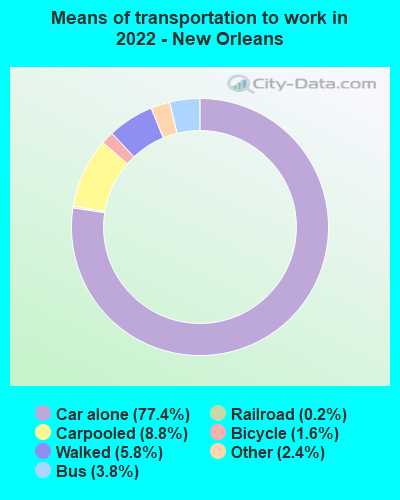
Means of transportation to work
Type
Nashville-Davidson
New Orleans
Bicycle
0.3%
1.4%
Bus
1.2%
3.3%
Carpooled
9.8%
9%
Car alone
85.5%
79.9%
Ferryboat
0%
0.1%
Motorcycle
0.1%
0.1%
Railroad
0%
0.2%
Taxicab
0.1%
0.5%
Walked
1.8%
3.6%
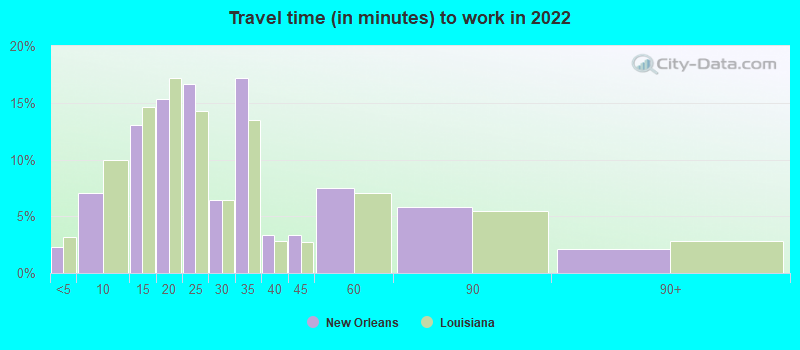
Average travel time to work
Type
Nashville-Davidson
New Orleans
Average
31.3 min
27.7 min
Other means
23.4 min
23.4 min
Public transportation
38.9 min
42.3 min
Private vehicle occupancy
Type
Nashville-Davidson
New Orleans
Average
1.2
1.2
Drove alone
88.7%
89.9%
In 2 person carpool
8.5%
8.2%
In 3 person carpool
1.6%
0.8%
In 4 person carpool
0.7%
0.4%
In 5-6 person carpool
0.5%
0.1%
In 7+ person carpool
0%
0.6%
How many people usually rode to work in the car, truck or van.
Real Estate
Real estate is pricier in Nashville-Davidson while New Orleans offers more affordability. Both cities provide a variety of property types, from downtown condos to historic houses, suitable for different needs and budgets.
Neighborhoods
Nashville-Davidson offers diverse neighborhoods ranging from hip and artsy East Nashville to upscale Green Hills. New Orleans is known for its unique neighborhoods such as the iconic French Quarter and the laid-back, artsy Bywater district.
Houses and residents
Type
Nashville-Davidson
New Orleans
Houses
331,262
194,701
Average household size (people)
2.3
2.3
Median year apartment built
1986
1966
Median year house/condo built
1984
1960
Length of stay in the house since moving in
12.2 years
15.5 years
Houses occupied
305,247 (92.1%)
158,827 (81.6%)
Houses occupied by owners
162,426 (53.2%)
83,516 (52.6%)
Houses occupied by renters
142,821 (46.8%)
75,311 (47.4%)
Median rent asked for vacant for-rent units
$1,391
$1,126
Median monthly housing costs
$1,291
$1,106
Median price asked for vacant for-sale houses and condos
$221,129
$470,732
Estimated median house or condo value
$346,700
$279,100
Median numbers of rooms
5.2
5.2
Median number of rooms in apartments
4.2
4.4
Median number of rooms in houses and condos
6.3
6.3
Median house price - detached houses
$437,686
$360,278
Median house price - in 2-unit structures
$320,904
$499,015
Median house price - in 3-to-4-unit structures
$319,119
$347,348
Median house price - in 5 or more unit structures
$305,249
$400,453
Median house price - mobile homes
$133,346
$25,502
Median house price - Townhouses or other attached units
$328,258
$365,362
Median house price - All housing units
$412,434
$369,282
Median house age
35
61
Renting percentage
44.6%
52.2%
Housing density (houses/condos per square mile)
699.9
1,078.3
House value disparities
31%
38.2%
Household income disparities
45.4%
53.1%
Median household income for houses/condes with a mortgage
$93,092
$89,566
Median household income for apartments without a mortgage
$68,871
$53,790
Housing units without a mortgage
3,189 (2.8%)
629 (1.3%)
Housing units with both a second mortgage and home equity loan
10,988 (9.6%)
3,326 (6.9%)
Housing units with a mortgage
110,850 (97.2%)
47,733 (98.7%)
Housing units with a home equity loan
333 (0.3%)
296 (0.6%)
Housing units with a second mortgage
13,192 (11.6%)
4,588 (9.5%)
House/condo owner moved in on average (years ago)
9
14
House/condo renter moved in on average (years ago)
1
3
Housing units lacking complete kitchen facilities
1.3%
5.6%
Housing units lacking complete plumbing facilities
0.5%
4.6%
Housing units in structures
Housing units in structures
Nashville-Davidson
New Orleans
One, detached
50.9%
48.0%
One, attached
8.4%
9.7%
Two
3.3%
15.1%
3 or 4
3.1%
6.9%
5 to 9
7.1%
4.1%
10 to 19
8.7%
3.8%
20 to 49
5.3%
3.9%
50 or more
11.9%
8.1%
Mobile homes
1.2%
0.4%
Boats, RVs, vans, etc.
0.1%
0.0%
Median real estate property taxes paid for housing units
Self-employed workers in own not incorporated business
31,952
9,492
State government workers
15,693
9,130
Unpaid family workers
463
527
Industries and Occupations
Nashville-Davidson is known for its music industry, health care services, and higher education. New Orleans' key industries include tourism, port operations, and oil and petrochemical production. The occupational opportunities in both cities reflect their industrial focus.
Both cities offer robust healthcare facilities. Nashville-Davidson is a healthcare hub, home to over 300 health care companies. New Orleans has several prominent hospitals and a strong network of healthcare services.
Health (county statistics)
Type
Nashville-Davidson
New Orleans
General health status score of residents in this county from 1 (poor) to 5 (excellent)
Nashville-Davidson offers modern infrastructure with a well-established transport network, municipal services, and public facilities. New Orleans is known for its historical architecture and infrastructure, still rebounding from Hurricane Katrina. Both cities have made significant investments in improving their overall infrastructure.
HMDA - Conventional home purchase loans - Applications denied
Year
Nashville-Davidson
New Orleans
1999
2,397
1,021
2000
1,451
942
2001
1,130
820
2002
1,075
820
2003
2,231
991
2004
2,731
1,379
2005
3,231
1,899
2006
3,720
1,426
2007
2,419
1,245
2008
952
683
2009
532
378
Culture and Food
Both cities boast a rich cultural panorama. Nashville-Davidson is renowned for its music scene, especially country music, and New Orleans is famous for its culinary scene, jazz, and Mardi Gras. Both cities operate numerous museums, galleries, theaters, and music venues.
Sports Teams
Nashville has professional NFL and NHL teams: the Tennessee Titans and the Nashville Predators. New Orleans is home to the NFL’s Saints and the NBA's Pelicans. Both cities also have a strong college sports scene.


 Nashville-Davidson, TN and
  New Orleans, LA : 467.7 miles