Nashville-Davidson, TN and Pittsburgh, PA, while both bustling cities in their own right, offer distinctly different living experiences. Whether it's the southern hospitality found in Nashville or the industrious spirit of Pittsburgh, potential transplants and tourists alike will find these cities cater to various lifestyles and needs. Below, we'll dive into various important aspects ranging from crime and safety to sports teams and healthcare, providing a comprehensive comparison.
Distance between
Nashville-Davidson, TN and
Pittsburgh, PA : 472.0 miles
Nashville-Davidson's population is larger by 126%. Its population has grown by 133,327 people (24.4%) since 2000. The population of Pittsburgh has decreased by 34,132 people (10.2%) during that time.
Nashville-Davidson has a higher crime rate compared to Pittsburgh. However, certain neighborhoods in both cities are considered safer than others. Pittsburgh, on the other hand, boasts numerous safe neighborhoods and a lower overall crime rate, making it a safer pick for families. Tourists visiting both cities are advised to remain vigilant and stay in well-trafficked areas.
Cost of Living
The cost of living in Nashville is generally higher than in Pittsburgh. This includes things like housing prices, groceries, and transportation costs. However, wages tend to be higher in Nashville, but it's important to remember that this higher income often goes hand in hand with the cost of living.
Income Tax
Tennessee has no state income tax, which can mean more take-home pay for residents in Nashville compared to those in Pittsburgh, where state and local income taxes apply.
Property Tax
Property tax rates in Pittsburgh are generally higher than in Nashville-Davidson. However, this can vary based on the specific area within the cities.
Sales Tax
Tennessee’s state sales tax is higher than Pennsylvania’s. On top of that, Nashville imposes additional local sales taxes which make the combined rate one of the highest in the nation. Pittsburgh's combined sales tax is considerably lower.
Income
Type
Nashville-Davidson
Pittsburgh
Estimated median household income
$64,857
$57,821
Estimated per capita income
$42,268
$39,779
Cost of living index (U.S. average is 100)
90.9
95.2
If you make $50,000 in Nashville-Davidson, you will have to make $52,365 in Pittsburgh to maintain the same standard of living.
Geographical Conditions
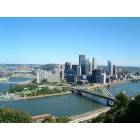
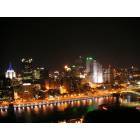
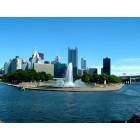
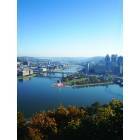
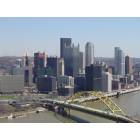
Nashville is located within the central basin of Tennessee, giving it a flat topography, while Pittsburgh sits between the Allegheny and Monongahela rivers, resulting in hilly conditions and the nickname "The City of Bridges."
Both cities are home to several esteemed higher educational institutions. Pittsburgh houses top-tier universities like Carnegie Mellon and the University of Pittsburgh, while Nashville is home to Vanderbilt University. As for K-12 education, Pittsburgh generally scores higher in education rankings.
Nashville's economy is growing rapidly, with a focus on healthcare, music, and entertainment industries. Pittsburgh, once known for steel production, has diversified its economy in recent years, with strong growth in healthcare, education, and technology sectors.
Biggest Employers
In Nashville, some of the biggest employers are Vanderbilt University Medical Center and Nissan North America. Pittsburgh's major employers include the University of Pittsburgh Medical Center and Highmark Health.
There were 3,932 building permits issued in Nashville-Davidson in 2012 (2854 more than in 2011) compared to 198 building permits issued in Pittsburgh in 2012 (86 less than in 2011).
In Nashville-Davidson (Davidson County), 58.5% voted for Democrats and 39.9% for Republicans in 2012 Presidential Election. In Pittsburgh (Allegheny County), 56.5% voted for Democrats and 42.0% for Republicans.
Elections
Type
Democrats
Republicans
Other
Year
Nashville-Davidson
Pittsburgh
Nashville-Davidson
Pittsburgh
Nashville-Davidson
Pittsburgh
2020
65.0%
59.4%
32.6%
39.0%
2.3%
1.5%
2016
60.1%
55.9%
34.1%
39.5%
5.7%
4.6%
2012
58.5%
56.5%
39.9%
42.0%
1.6%
1.5%
2008
60.0%
57.1%
39.0%
41.7%
1.0%
1.2%
2004
54.9%
57.2%
44.6%
42.2%
0.4%
0.6%
2000
57.9%
56.6%
40.4%
40.4%
1.7%
2.9%
1996
79.3%
52.8%
18.1%
37.9%
2.6%
9.3%
Breakdown of population affiliated with a religious congregation
Type
Adherents
Congregations
Religion
Nashville-Davidson
Pittsburgh
Nashville-Davidson
Pittsburgh
SOUTHERN BAPTIST CONVENTION
14.1%
0.2%
19.6%
2.8%
CATHOLIC CHURCH
4.9%
37.7%
2.3%
15.6%
EPISCOPAL CHURCH
1.5%
0.6%
1.8%
1.7%
SEVENTH DAY ADVENTIST CHURCH
1.1%
0.2%
1.7%
0.5%
COPTIC ORTHODOX CHURCH
1.0%
0.0%
0.5%
0.0%
MUSLIM ESTIMATE
0.8%
0.5%
1.4%
0.9%
PRESBYTERIAN CHURCH IN AMERICA
0.8%
0.1%
0.9%
0.7%
CUMBERLAND PRESBYTERIAN CHURCH
0.4%
0.0%
1.3%
0.0%
LUTHERAN CHURCH
0.3%
0.3%
0.9%
1.8%
EVANGELICAL LUTHERAN CHURCH IN AMERICA
0.2%
2.0%
0.8%
6.7%
AMERICAN BAPTIST CHURCHES IN THE USA
0.1%
1.4%
0.3%
3.7%
SALVATION ARMY
0.1%
0.3%
0.5%
0.8%
Weather
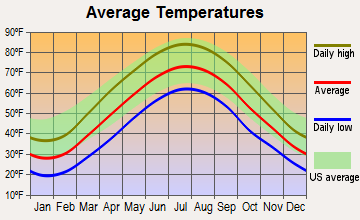
Potential transplants will find Nashville's weather warmer with a humid subtropical climate, resulting in hot summers and mild winters. Pittsburgh experiences a humid continental climate with cold winters and warm summers. Those sensitive to colder temperatures might find Nashville's climate more enjoyable and vice versa.
Weather and climate
Type
Nashville-Davidson
Pittsburgh
Temperature - Average
58.5°F
51.3°F
Humidity - Average morning or afternoon humidity
75.9%
73.7%
Humidity - Differences between morning and afternoon humidity
38%
36%
Humidity - Maximum monthly morning or afternoon humidity
89%
86%
Humidity - Minimum monthly morning or afternoon humidity
51%
50%
Precipitation - Yearly average
49 in
38.6 in
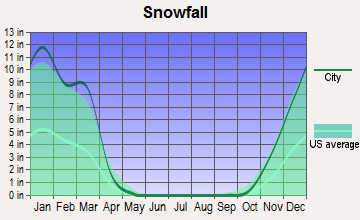
Snowfall - Yearly average
17.8 in
87.7 in
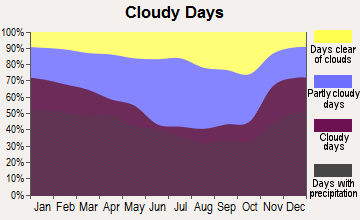
Clouds - Number of days clear of clouds
17.1%
9.8%
Sunshine amount - Average
59.7%
46%
Sunshine amount - Differences during a year
23%
31%
Sunshine amount - Maximum monthly
65%
54%
Sunshine amount - Minimum monthly
42%
23%
Wind speed - Average
7.7 mph
8.5 mph
Average climate in Nashville-Davidson, Tennessee
Average climate in Pittsburgh, Pennsylvania
Air pollution
Type
AQI
CO
NO2
OZONE
PB
PM10
PM25
SO2
Year
Nashville-Davidson
Pittsburgh
Nashville-Davidson
Pittsburgh
Nashville-Davidson
Pittsburgh
Nashville-Davidson
Pittsburgh
Nashville-Davidson
Pittsburgh
Nashville-Davidson
Pittsburgh
Nashville-Davidson
Pittsburgh
Nashville-Davidson
Pittsburgh
2018
71
105
0.40
0.26
13.8
5.7
24.1
24.7
N/A
N/A
15.2
15.1
9.2
11.8
0.2
0.6
2017
70
102
0.38
0.25
14.4
5.7
26.8
26.2
N/A
N/A
15.3
16.4
8.7
9.5
0.1
0.6
2016
90
100
0.42
0.27
16.1
6.5
26.4
25.9
N/A
0.002
N/A
15.6
10.1
10.4
0.0
0.7
2015
68
110
0.43
0.26
15.5
7.5
23.6
24.8
N/A
0.007
N/A
18.6
10.8
11.0
0.1
1.0
2014
66
107
N/A
0.30
N/A
9.3
26.3
23.1
N/A
0.042
N/A
18.1
9.8
10.4
1.4
1.2
2013
62
99
N/A
0.27
N/A
10.8
N/A
25.1
N/A
0.164
N/A
16.6
9.7
10.3
N/A
2.4
2012
81
120
N/A
0.33
N/A
13.0
28.3
25.4
N/A
N/A
N/A
19.5
11.0
10.3
2.3
2.5
2011
81
118
N/A
0.29
N/A
13.3
25.9
24.5
N/A
N/A
N/A
16.6
11.0
12.2
1.7
2.6
2010
80
151
N/A
0.37
N/A
13.6
24.3
24.5
N/A
N/A
N/A
20.2
12.2
12.1
2.2
5.0
2009
72
129
N/A
0.23
N/A
12.9
22.5
23.0
N/A
0.017
N/A
18.5
11.5
14.9
2.4
4.0
2008
81
135
N/A
0.26
N/A
16.1
25.7
22.3
N/A
0.017
N/A
20.6
13.4
16.7
2.5
4.8
2007
99
140
N/A
0.39
N/A
15.6
27.4
22.8
N/A
0.010
N/A
21.7
15.5
19.0
2.7
5.9
2006
93
149
0.69
0.35
N/A
16.2
24.9
20.2
N/A
0.028
N/A
19.3
14.9
16.1
2.9
6.6
2005
104
107
0.56
0.33
N/A
19.1
23.5
20.0
N/A
0.031
N/A
20.9
16.9
N/A
3.1
7.4
2004
83
93
0.61
0.41
N/A
18.9
22.0
19.7
0.006
0.019
N/A
21.0
N/A
N/A
2.6
6.6
2003
93
102
0.67
0.36
N/A
19.6
18.5
21.3
0.005
0.032
N/A
21.3
15.8
N/A
3.8
8.7
2002
92
111
0.67
0.32
N/A
20.1
20.2
21.7
N/A
0.017
N/A
20.2
15.3
N/A
4.3
9.2
2001
95
107
0.89
0.60
N/A
21.2
19.5
21.1
N/A
0.017
N/A
26.0
15.6
N/A
4.5
8.5
2000
97
102
0.74
0.62
N/A
22.0
19.8
19.8
N/A
0.016
N/A
22.8
N/A
N/A
4.1
9.1
Natural disasters
Type
Nashville-Davidson
Pittsburgh
Tornado activity compared to U.S. average
169.1%
80.2%
Earthquake activity compared to U.S. average
296.1%
44.6%
Natural disasters compared to U.S. average
17%
15%
Transportation
While Nashville's public transit system is developing, it's not as robust as Pittsburgh's, which includes buses and light rail ("The T"). Commuting is more comfortable in Pittsburgh due to its more comprehensive public transit system.
Transport
Type
Nashville-Davidson
Pittsburgh
Amtrak stations
0
1
Amtrak stations nearby
1
1
FAA registered aircraft
0
233
FAA registered aircraft manufacturers and dealers
0
3
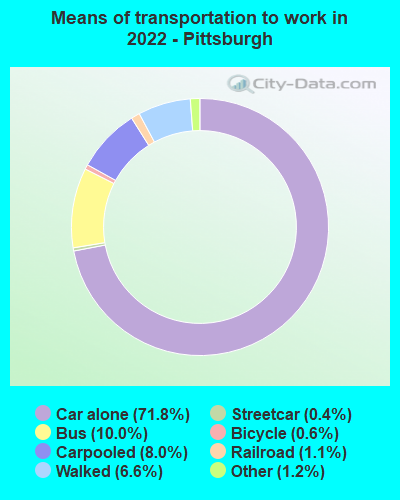
Means of transportation to work
Type
Nashville-Davidson
Pittsburgh
Bicycle
0.3%
0.8%
Bus
1.2%
9.3%
Carpooled
9.8%
7.4%
Car alone
85.5%
74%
Railroad
0%
0.7%
Streetcar
0%
0.6%
Taxicab
0.1%
0.1%
Walked
1.8%
4.8%
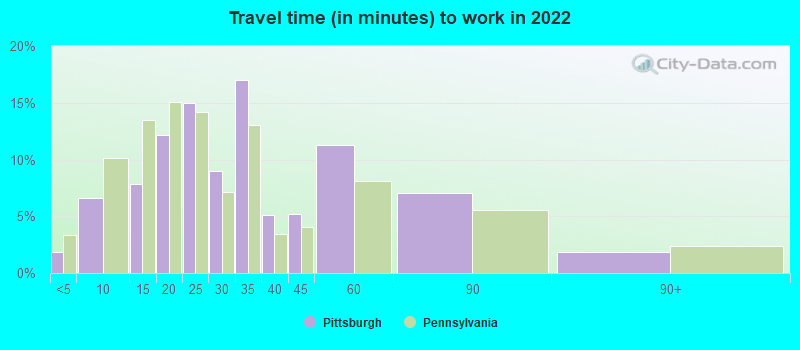
Average travel time to work
Type
Nashville-Davidson
Pittsburgh
Average
31.3 min
31 min
Other means
23.4 min
21.6 min
Public transportation
38.9 min
33.4 min
Private vehicle occupancy
Type
Nashville-Davidson
Pittsburgh
Average
1.2
1.1
Drove alone
88.7%
90.3%
In 2 person carpool
8.5%
8%
In 3 person carpool
1.6%
0.8%
In 4 person carpool
0.7%
0.5%
In 5-6 person carpool
0.5%
0%
In 7+ person carpool
0%
0.3%
How many people usually rode to work in the car, truck or van.
Real Estate
Real estate in Nashville has seen a significant upswing in recent years, owing to the city’s rapid growth and popularity. On the other hand, Pittsburgh's real estate market is more stable and affordable, making it an attractive option for homebuyers on a budget.
Neighborhoods
Nashville boasts vibrant neighborhoods like East Nashville and The Gulch filled with music venues, hip restaurants, and unique shops. Pittsburgh’s neighborhoods such as Squirrel Hill and Shadyside offer historic charm combined with modern amenities.
Houses and residents
Type
Nashville-Davidson
Pittsburgh
Houses
331,262
159,435
Average household size (people)
2.3
2.1
Median year apartment built
1986
1954
Length of stay in the house since moving in
12.2 years
16.4 years
Houses occupied
305,247 (92.1%)
136,747 (85.8%)
Houses occupied by owners
162,426 (53.2%)
66,729 (48.8%)
Houses occupied by renters
142,821 (46.8%)
70,018 (51.2%)
Median rent asked for vacant for-rent units
$1,391
$1,381
Median monthly housing costs
$1,291
$985
Median price asked for vacant for-sale houses and condos
$221,129
$325,759
Estimated median house or condo value
$346,700
$181,100
Median numbers of rooms
5.2
5.2
Median number of rooms in apartments
4.2
4
Median number of rooms in houses and condos
6.3
6.3
Median house price - detached houses
$437,686
$256,260
Median house price - in 2-unit structures
$320,904
$174,463
Median house price - in 3-to-4-unit structures
$319,119
$299,629
Median house price - in 5 or more unit structures
$305,249
$310,273
Median house price - mobile homes
$133,346
$187,764
Median house price - Townhouses or other attached units
$328,258
$258,331
Median house price - All housing units
$412,434
$257,793
Median house age
35
80
Renting percentage
44.6%
52.4%
Housing density (houses/condos per square mile)
699.9
2,868.3
House value disparities
31%
43.1%
Household income disparities
45.4%
49.5%
Median household income for houses/condes with a mortgage
$93,092
$97,230
Median household income for apartments without a mortgage
$68,871
$58,579
Housing units without a mortgage
3,189 (2.8%)
2,260 (5.6%)
Housing units with both a second mortgage and home equity loan
10,988 (9.6%)
4,417 (11%)
Housing units with a mortgage
110,850 (97.2%)
37,784 (94.4%)
Housing units with a home equity loan
333 (0.3%)
297 (0.7%)
Housing units with a second mortgage
13,192 (11.6%)
4,975 (12.4%)
House/condo owner moved in on average (years ago)
9
15
House/condo renter moved in on average (years ago)
1
1
Housing units lacking complete kitchen facilities
1.3%
3%
Housing units lacking complete plumbing facilities
0.5%
2.8%
Housing units in structures
Housing units in structures
Nashville-Davidson
Pittsburgh
One, detached
50.9%
43.7%
One, attached
8.4%
15.6%
Two
3.3%
8.9%
3 or 4
3.1%
6.2%
5 to 9
7.1%
4.8%
10 to 19
8.7%
4.3%
20 to 49
5.3%
4.3%
50 or more
11.9%
11.5%
Mobile homes
1.2%
0.6%
Boats, RVs, vans, etc.
0.1%
0.0%
Median real estate property taxes paid for housing units
Self-employed workers in own not incorporated business
31,952
5,977
State government workers
15,693
5,427
Unpaid family workers
463
73
Industries and Occupations
Nashville-Davidson thrives on its music industry with a vast array of occupations related to music and entertainment. Healthcare is another prominent industry. In Pittsburgh, the healthcare, education, and technology sectors are dominating, with companies like Google establishing offices here.
Healthcare in both cities is top-rated with renowned institutions. Nashville is known for the Vanderbilt University Medical Center, and Pittsburgh for the University of Pittsburgh Medical Center.
Health (county statistics)
Type
Nashville-Davidson
Pittsburgh
General health status score of residents in this county from 1 (poor) to 5 (excellent)
Pittsburgh's infrastructure is older, with many historic buildings and bridges. However, it continues to invest in modernizing its infrastructure. Nashville, though also rich in history, has newer infrastructure due to its recent growth and urban expansion.
HMDA - Conventional home purchase loans - Applications denied
Year
Nashville-Davidson
Pittsburgh
1999
2,397
576
2000
1,451
539
2001
1,130
443
2002
1,075
378
2003
2,231
523
2004
2,731
614
2005
3,231
761
2006
3,720
807
2007
2,419
671
2008
952
347
2009
532
210
Culture and Food
Nashville is globally recognized for its music scene, particularly country music, and its delicious southern comfort food. Pittsburgh, with its ethnically diverse background, boasts a rich cultural scene and a unique food palette featuring Pierogies and Primanti Bros. sandwiches.
Sports Teams
Both cities have passionate sports fans. Nashville is home to the Tennessee Titans (NFL) and the Nashville Predators (NHL). Pittsburgh has a rich sports heritage with successful teams like the Pittsburgh Steelers (NFL), the Pittsburgh Penguins (NHL), and the Pittsburgh Pirates (MLB).


 Nashville-Davidson, TN and
  Pittsburgh, PA : 472.0 miles