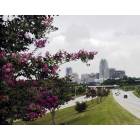
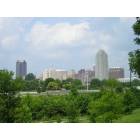
Comparing Nashville-Davidson, TN and Raleigh, NC, you will find that both cities offer a unique and compelling lifestyle. From educational opportunities, cost of living, to the economic climate, each city has its own charms. They offer different experiences in terms of culture, food, sports, and the individual industries and job opportunities. However, picking between these beautiful locations will depend largely on what you value most in a living space or a holiday destination.
Distance between
Nashville-Davidson, TN and
Raleigh, NC : 454.3 miles
Nashville-Davidson's population is larger by 45%. Its population has grown by 133,327 people (24.4%) since 2000. The population of Raleigh has grown by 193,031 people (69.9%) during that time.
Both Nashville and Raleigh have crime rates that are, unfortunately, higher than the national average. However, Raleigh compared to Nashville has a lower crime rate with focus on property crime. In contrast, Nashville's crime rates include a slightly higher amount crime, although the city has been investing in security measures and community programs to help mitigate this. It's always important to research specific neighborhoods and areas when considering safety.
Cost of Living
The cost of living between the two cities is somewhat similar, however, Nashville tends to be a slightly more expensive city to live in overall. This stems mainly from higher costs in housing and transportation. Raleigh is considered more affordable with lower grocery costs, health costs, and housing costs. Both cities, however, have a higher cost of living compared to the national average.
Income Tax
The state of Tennessee, including Nashville, does not levy a personal income tax on salaries and wages. In contrast, Raleigh residents are subject to a state income tax with rates ranging from 5.25% - 8.25% depending on income level.
Property Tax
The property tax rate is slightly lower in Nashville-Davidson county than in Raleigh. However, this could be offset by the generally higher property values in Nashville compared to Raleigh, leading to higher out-of-pocket costs overall.
Sales Tax
Tennessee's sales tax, which Nashville follows, is higher than the North Carolina sales tax that Raleigh adheres to. The sales tax in Tennessee is 9.25% (including both state and local taxes) while in North Carolina it is 6.75% - 7.5% depending on location.
Income
Type
Nashville-Davidson
Raleigh
Estimated median household income
$64,857
$74,612
Estimated per capita income
$42,268
$44,001
Cost of living index (U.S. average is 100)
90.9
95.1
If you make $50,000 in Nashville-Davidson, you will have to make $52,310 in Raleigh to maintain the same standard of living.
Geographical Conditions
Nashville is known for its beautiful landscapes with rolling hills and is located near the Cumberland River. On the other hand, Raleigh is part of North Carolina's Coastal Plain region, resulting in flat and low-lying geography, although it is near the Appalachian mountains offering plenty of outdoor activities.
Education in both cities is renowned, with both hosting higher education institutions that attract students from across the country. Nashville is home to the esteemed Vanderbilt University amongst others, making it a hub for students in the medical and entertainment fields. Raleigh is known as part of the "Research Triangle" which includes Duke University and University of North Carolina Chapel Hill, attracting students in technology, research, and development fields.
There are ample job opportunities in both cities. Nashville’s economy is diversified with healthcare, music, publishing, banking, transportation industries, etc. Raleigh’s economy, on the other hand, is anchored in the technology and biosciences, with a major hub for startups and innovative companies. Median incomes in both cities are comparable with a slight edge to Raleigh due to lower cost of living.
Biggest Employers
Nashville's largest employers include Vanderbilt University & Medical Center, Nissan North America, and HCA Healthcare. Meanwhile, Raleigh's largest employers are in the tech industry, led by tech giants such as IBM Corporation, SAS Institute Inc., and Cisco Systems, as well as the state government.
There were 3,932 building permits issued in Nashville-Davidson in 2012 (2854 more than in 2011) compared to 1,354 building permits issued in Raleigh in 2012 (366 more than in 2011).
In Nashville-Davidson (Davidson County), 58.5% voted for Democrats and 39.9% for Republicans in 2012 Presidential Election. In Raleigh (Wake County), 54.9% voted for Democrats and 43.5% for Republicans.
Elections
Type
Democrats
Republicans
Other
Year
Nashville-Davidson
Raleigh
Nashville-Davidson
Raleigh
Nashville-Davidson
Raleigh
2020
65.0%
62.3%
32.6%
35.9%
2.3%
1.8%
2016
60.1%
57.4%
34.1%
37.2%
5.7%
5.5%
2012
58.5%
54.9%
39.9%
43.5%
1.6%
1.6%
2008
60.0%
56.8%
39.0%
42.3%
1.0%
0.9%
2004
54.9%
48.7%
44.6%
50.9%
0.4%
0.4%
2000
57.9%
46.1%
40.4%
53.2%
1.7%
0.7%
1996
79.3%
45.9%
18.1%
48.2%
2.6%
5.9%
Breakdown of population affiliated with a religious congregation
Type
Adherents
Congregations
Religion
Nashville-Davidson
Raleigh
Nashville-Davidson
Raleigh
SOUTHERN BAPTIST CONVENTION
14.1%
9.0%
19.6%
22.5%
CATHOLIC CHURCH
4.9%
11.0%
2.3%
2.4%
EPISCOPAL CHURCH
1.5%
1.1%
1.8%
1.8%
SEVENTH DAY ADVENTIST CHURCH
1.1%
0.2%
1.7%
1.0%
COPTIC ORTHODOX CHURCH
1.0%
0.1%
0.5%
0.1%
MUSLIM ESTIMATE
0.8%
1.1%
1.4%
1.0%
PRESBYTERIAN CHURCH IN AMERICA
0.8%
0.2%
0.9%
1.5%
CUMBERLAND PRESBYTERIAN CHURCH
0.4%
0.0%
1.3%
0.0%
LUTHERAN CHURCH
0.3%
0.4%
0.9%
0.6%
EVANGELICAL LUTHERAN CHURCH IN AMERICA
0.2%
0.6%
0.8%
1.1%
AMERICAN BAPTIST CHURCHES IN THE USA
0.1%
0.4%
0.3%
0.6%
Weather
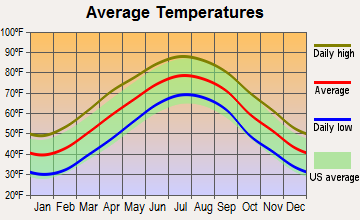
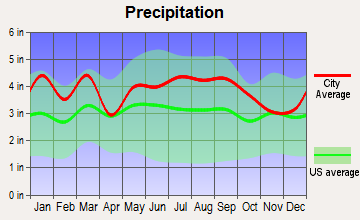
Weather is a major factor when comparing these two cities. Nashville experiences a traditional humid subtropical climate with average temperatures ranging from 28.9°F in the colder months to 78°F in the warmer months. Raleigh, however, has a similar humid subtropical climate, but with slightly warmer temperatures ranging from 30°F in colder months to 80°F during the warmer months. Both cities see rainfall throughout the year with Nashville receiving slightly more rainfall percentage.
Weather and climate
Type
Nashville-Davidson
Raleigh
Temperature - Average
58.5°F
59.8°F
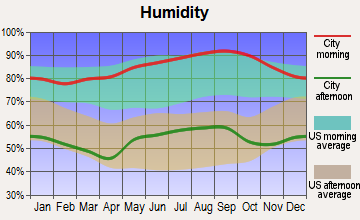
Humidity - Average morning or afternoon humidity
75.9%
73.7%
Humidity - Differences between morning and afternoon humidity
38%
44%
Humidity - Maximum monthly morning or afternoon humidity
89%
90%
Humidity - Minimum monthly morning or afternoon humidity
51%
46%
Precipitation - Yearly average
49 in
46.2 in
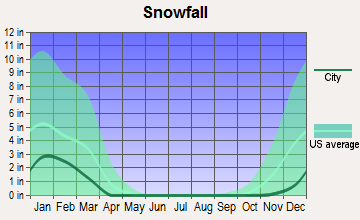
Snowfall - Yearly average
17.8 in
13.4 in
Clouds - Number of days clear of clouds
17.1%
18.5%
Sunshine amount - Average
59.7%
63.9%
Sunshine amount - Differences during a year
23%
13%
Sunshine amount - Maximum monthly
65%
64%
Sunshine amount - Minimum monthly
42%
51%
Wind speed - Average
7.7 mph
7.1 mph
Average climate in Nashville-Davidson, Tennessee
Average climate in Raleigh, North Carolina
Air pollution
Type
AQI
CO
NO2
OZONE
PB
PM10
PM25
SO2
Year
Nashville-Davidson
Raleigh
Nashville-Davidson
Raleigh
Nashville-Davidson
Raleigh
Nashville-Davidson
Raleigh
Nashville-Davidson
Nashville-Davidson
Raleigh
Nashville-Davidson
Raleigh
Nashville-Davidson
Raleigh
2018
71
71
0.40
0.23
13.8
4.9
24.1
27.5
N/A
N/A
15.2
14.6
9.2
9.5
0.2
0.2
2017
70
70
0.38
0.23
14.4
5.5
26.8
25.8
N/A
N/A
15.3
14.7
8.7
9.3
0.1
0.2
2016
90
80
0.42
0.23
16.1
5.6
26.4
26.9
N/A
N/A
N/A
8.7
10.1
10.0
0.0
0.3
2015
68
79
0.43
0.27
15.5
5.7
23.6
28.6
N/A
N/A
N/A
12.4
10.8
11.0
0.1
0.3
2014
66
74
N/A
0.26
N/A
6.0
26.3
29.9
N/A
N/A
N/A
N/A
9.8
11.2
1.4
0.3
2013
62
72
N/A
0.26
N/A
N/A
N/A
26.9
N/A
N/A
N/A
N/A
9.7
10.7
N/A
0.4
2012
81
80
N/A
0.28
N/A
N/A
28.3
29.7
N/A
N/A
N/A
N/A
11.0
9.5
2.3
0.6
2011
81
84
N/A
0.27
N/A
N/A
25.9
32.9
N/A
N/A
N/A
N/A
11.0
10.3
1.7
0.7
2010
80
89
N/A
0.30
N/A
N/A
24.3
32.4
N/A
N/A
N/A
N/A
12.2
10.9
2.2
1.0
2009
72
77
N/A
0.30
N/A
N/A
22.5
27.8
N/A
N/A
N/A
N/A
11.5
10.3
2.4
1.0
2008
81
99
N/A
0.36
N/A
N/A
25.7
32.3
N/A
N/A
N/A
N/A
13.4
12.5
2.5
1.4
2007
99
98
N/A
0.40
N/A
N/A
27.4
35.7
N/A
N/A
N/A
N/A
15.5
13.9
2.7
1.2
2006
93
90
0.69
0.44
N/A
N/A
24.9
31.9
N/A
N/A
N/A
N/A
14.9
13.5
2.9
0.9
2005
104
80
0.56
0.38
N/A
N/A
23.5
33.9
N/A
N/A
N/A
N/A
16.9
N/A
3.1
2.5
2004
83
82
0.61
0.40
N/A
N/A
22.0
28.4
0.006
N/A
N/A
N/A
N/A
N/A
2.6
2.6
2003
93
82
0.67
N/A
N/A
N/A
18.5
29.9
0.005
N/A
N/A
N/A
15.8
N/A
3.8
3.0
2002
92
89
0.67
N/A
N/A
N/A
20.2
36.1
N/A
N/A
N/A
N/A
15.3
N/A
4.3
2.6
2001
95
128
0.89
N/A
N/A
N/A
19.5
34.5
N/A
N/A
N/A
N/A
15.6
N/A
4.5
N/A
2000
97
115
0.74
0.64
N/A
N/A
19.8
34.1
N/A
N/A
N/A
N/A
N/A
N/A
4.1
N/A
Natural disasters
Type
Nashville-Davidson
Raleigh
Tornado activity compared to U.S. average
169.1%
95.1%
Earthquake activity compared to U.S. average
296.1%
52.6%
Natural disasters compared to U.S. average
17%
18%
Transportation
Transportation varies between both cities. Nashville has the MTA bus system and music city star rail service, but the city is also very car-centric. Raleigh, on the other hand, has a higher emphasis on public transportation including the GoRaleigh bus service and the R-Line, a free downtown circulator bus service.
Transport
Type
Nashville-Davidson
Raleigh
Amtrak stations
0
1
Amtrak stations nearby
1
3
FAA registered aircraft
0
499
FAA registered aircraft manufacturers and dealers
0
12
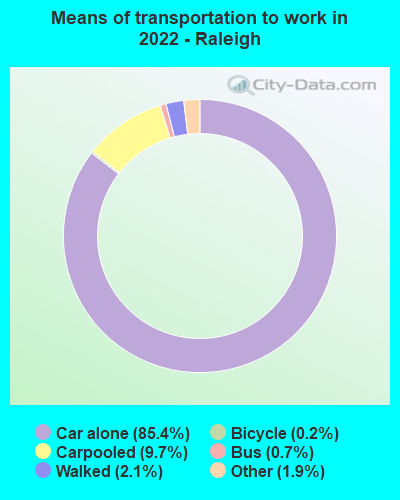
Means of transportation to work
Type
Nashville-Davidson
Raleigh
Bicycle
0.3%
0.2%
Bus
1.2%
1.1%
Carpooled
9.8%
8.5%
Car alone
85.5%
87.4%
Motorcycle
0.1%
0.1%
Taxicab
0.1%
0.3%
Walked
1.8%
1.1%
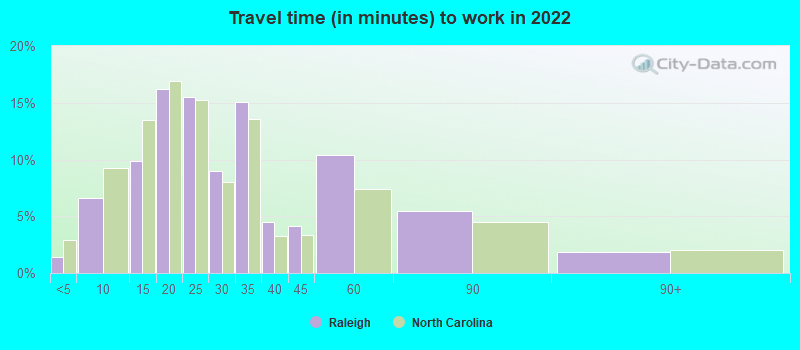
Average travel time to work
Type
Nashville-Davidson
Raleigh
Average
31.3 min
29.4 min
Other means
23.4 min
22.5 min
Public transportation
38.9 min
39.9 min
Private vehicle occupancy
Type
Nashville-Davidson
Raleigh
Average
1.2
1.1
Drove alone
88.7%
90.1%
In 2 person carpool
8.5%
7.6%
In 3 person carpool
1.6%
1.4%
In 4 person carpool
0.7%
0.3%
In 5-6 person carpool
0.5%
0.6%
How many people usually rode to work in the car, truck or van.
Real Estate
Real estate is fairly expensive in both cities, with Nashville having a slightly higher median home price. Nashville’s real estate market is growing due to its diversified economy and the influx of people. In contrast, Raleigh has more affordable housing options with a strong real estate market driven by growth in its tech sector and the presence of high-ranking universities.
Neighborhoods
Both Nashville and Raleigh boast lovely neighborhoods with diverse demographics. Nashville neighborhoods such as East Nashville or The Gulch, have a vibrant arts scene and historic charm. Raleigh's neighborhoods, like the Warehouse District or Oakwood, offer a balance of cultural offerings and quiet, family-friendly environments.
Houses and residents
Type
Nashville-Davidson
Raleigh
Houses
331,262
217,866
Average household size (people)
2.3
2.4
Median year apartment built
1986
1995
Median year house/condo built
1984
1995
Length of stay in the house since moving in
12.2 years
11.5 years
Houses occupied
305,247 (92.1%)
194,917 (89.5%)
Houses occupied by owners
162,426 (53.2%)
103,367 (53%)
Houses occupied by renters
142,821 (46.8%)
91,550 (47%)
Median rent asked for vacant for-rent units
$1,391
$1,740
Median monthly housing costs
$1,291
$1,298
Median price asked for vacant for-sale houses and condos
$221,129
$302,120
Estimated median house or condo value
$346,700
$340,200
Median numbers of rooms
5.2
5.1
Median number of rooms in apartments
4.2
3.9
Median number of rooms in houses and condos
6.3
6.7
Median house price - detached houses
$437,686
$446,507
Median house price - in 2-unit structures
$320,904
$403,968
Median house price - in 3-to-4-unit structures
$319,119
$170,635
Median house price - in 5 or more unit structures
$305,249
$306,998
Median house price - mobile homes
$133,346
$31,622
Median house price - Townhouses or other attached units
$328,258
$292,086
Median house price - All housing units
$412,434
$404,828
Median house age
35
26
Renting percentage
44.6%
46.5%
Housing density (houses/condos per square mile)
699.9
1,901.1
House value disparities
31%
30.8%
Household income disparities
45.4%
45.4%
Median household income for houses/condes with a mortgage
$93,092
$114,680
Median household income for apartments without a mortgage
$68,871
$81,716
Housing units without a mortgage
3,189 (2.8%)
1,689 (2.1%)
Housing units with both a second mortgage and home equity loan
10,988 (9.6%)
6,627 (8.2%)
Housing units with a mortgage
110,850 (97.2%)
78,923 (97.9%)
Housing units with a home equity loan
333 (0.3%)
0 (0%)
Housing units with a second mortgage
13,192 (11.6%)
7,783 (9.7%)
House/condo owner moved in on average (years ago)
9
8
House/condo renter moved in on average (years ago)
1
1
Housing units lacking complete kitchen facilities
1.3%
0.6%
Housing units lacking complete plumbing facilities
0.5%
0.5%
Housing units in structures
Housing units in structures
Nashville-Davidson
Raleigh
One, detached
50.9%
45.0%
One, attached
8.4%
14.0%
Two
3.3%
1.2%
3 or 4
3.1%
4.6%
5 to 9
7.1%
6.3%
10 to 19
8.7%
12.4%
20 to 49
5.3%
6.0%
50 or more
11.9%
9.2%
Mobile homes
1.2%
1.2%
Boats, RVs, vans, etc.
0.1%
0.0%
Median real estate property taxes paid for housing units
Self-employed workers in own not incorporated business
31,952
12,488
State government workers
15,693
19,792
Unpaid family workers
463
523
Industries and Occupations
Nashville is known for its healthcare, education and music industries. It is widely recognized as "Music City" for its vibrant music and entertainment scene. Raleigh, dubbed the "Silicon Valley of the East", has a dominant technology and software services industry, biotechnology research, and government services.
Health care in Nashville-Davidson is top-notch with access to well-regarded hospitals such as Vanderbilt University Medical Center. In Raleigh, residents also have access to top-tier healthcare, including the Duke University Hospital and the UNC Healthcare system.
Health (county statistics)
Type
Nashville-Davidson
Raleigh
General health status score of residents in this county from 1 (poor) to 5 (excellent)
Nashville has done much to improve its infrastructure, becoming a hub for healthcare and education in addition to maintaining its strong music industry presence. Public transportation and facilities are accessible. However, Raleigh’s infrastructure, part of the "Research Triangle", is seen as more modernized with significant investment in science and technology sectors. Raleigh boasts modern facilities, roads and a highly regarded public transit system.
HMDA - Conventional home purchase loans - Applications denied
Year
Nashville-Davidson
Raleigh
1999
2,397
1,618
2000
1,451
890
2001
1,130
557
2002
1,075
510
2003
2,231
564
2004
2,731
700
2005
3,231
1,083
2006
3,720
1,097
2007
2,419
859
2008
952
424
2009
532
253
Culture and Food
Nashville is rich in culture, widely known for its country music scene, historic landmarks, and southern cuisine. Its food culture includes famous hot chicken, barbeque, and meat-and-three meals. Raleigh also has a diverse culture, famed for its vibrant performing arts scene and numerous museums. It also boasts a growing food scene, known for North Carolina barbecue and an array of craft breweries.
Sports Teams
Nashville is known for its NFL team, the Tennessee Titans, and the NHL team, the Nashville Predators. Raleigh, however, is home to the NHL team, the Carolina Hurricanes, and also enjoys proximity to college sports giants like Duke University and the University of North Carolina.


 Nashville-Davidson, TN and
  Raleigh, NC : 454.3 miles