Newark, NJ vs Irvington, NJ - Advanced U.S. city comparison tool

Newark, NJ vs Irvington, NJ

Newark and Irvington, both cities in New Jersey, offer different living experiences. Newark, as the largest city in the state, boasts a more urban feel and more job opportunities while Irvington, though close to Newark, has a small-town vibe. Comparing both cities in terms of crime/safety, weather, cost of living, education, work and economy, infrastructure, industries and occupations, biggest employers, real-estate, neighborhoods, transportation, taxes, culture, sports teams, geographical conditions, and health care will provide valuable insight into the pros and cons of living in each city.
 
 
Distance between Newark, NJ and Irvington, NJ : 2.6 miles

Newark's population is larger by 421%. Its population has grown by 33,674 people (12.3%) since 2000.

Population
Type Newark Irvington
Population 307,220 58,920
Female / male percentage 51.1% / 48.9%
51.1%
48.9%
53.3% / 46.7%
53.3%
46.7%
Racial makeup - percentage
Ethnicity NewarkIrvington
Black 46.4% 80.5%
Hispanic 36.2% 8.4%
White Non-Hispanic 7.5% 5.7%
Two or more 2.7% 3.7%
Asian 2.5% 1.1%
American Indian 0.2% 0.2%
Racial makeup - absolute values
Ethnicity NewarkIrvington
Black 142,658 48,852
Hispanic 111,099 5,086
White Non-Hispanic 22,953 3,465
Two or more 8,147 2,264
Asian 7,799 661
American Indian 512 100
Pacific Islander 0 39

Crime and Safety

Newark's larger population may contribute to it having higher crime rates than Irvington overall, and it is important for potential residents to research specific neighborhoods for crime data. Irvington, while having lower rates, still has above-average crime when compared to national levels. Both cities have implemented initiatives to reduce crime.

Crime by year per 100,000 residents
Type City-data.com crime indexRobberies per 100,000Murders per 100,000Rapes per 100,000Assaults per 100,000Burglaries per 100,000Theft per 100,000Auto theft per 100,000Arson per 100,000
Year NewarkIrvingtonNewarkIrvingtonNewarkIrvingtonNewarkIrvingtonNewarkIrvingtonNewarkIrvingtonNewarkIrvingtonNewarkIrvingtonNewarkIrvington
2020 273.7 267.7 130.0 206.2 19.8 20.3 41.1 33.1 337.7 163.9 189.6 186.0 823.8 1,014.6 604.8 655.5 10.3 0.0
2019 303.7 286.3 226.0 351.6 20.3 13.0 42.6 31.5 330.1 122.1 256.2 329.4 837.2 1,045.6 547.6 505.2 7.5 13.0
2018 368.5 349.7 244.1 402.1 26.6 9.2 53.1 44.3 409.2 197.3 294.8 422.4 1,001.6 1,209.9 713.9 723.0 13.5 0.0
2017 432.6 425.4 377.2 480.6 27.1 16.4 40.9 60.3 451.2 255.8 423.7 508.0 1,128.1 1,297.3 843.2 769.3 25.4 11.0
2016 451.8 417.7 474.0 521.8 35.5 7.3 35.2 45.9 392.3 360.1 404.3 610.0 1,083.0 1,027.0 754.0 674.3 14.6 31.2
2015 482.2 566.5 575.3 725.8 33.8 25.7 33.5 44.0 351.4 362.9 510.2 811.9 1,067.7 1,297.6 831.3 1,011.7 5.7 16.5
2014 522.9 625.9 688.6 853.3 33.7 34.9 17.6 33.1 338.2 342.1 622.0 1,079.5 1,365.1 1,353.5 864.2 943.4 14.0 22.1
2013 615.2 659.7 874.4 907.0 40.3 31.3 16.2 49.8 332.8 514.3 745.4 825.9 1,436.5 1,185.3 1,040.1 962.3 12.2 12.9
2012 601.7 593.4 708.5 597.0 34.4 16.6 19.7 36.9 391.9 654.1 768.7 1,037.3 1,467.5 1,468.5 1,420.6 1,118.4 22.2 40.5
2011 600.9 622.1 711.0 663.5 33.8 25.9 20.9 44.4 400.6 611.8 861.7 1,097.9 1,410.1 1,332.6 1,330.3 1,040.6 18.0 42.5
2010 547.7 727.6 578.8 693.5 32.5 26.0 28.5 53.8 401.2 895.7 695.7 1,159.0 1,321.0 1,579.9 1,306.2 1,264.7 18.4 16.7
2009 491.1 778.4 472.4 857.8 28.7 30.4 24.4 37.6 404.7 893.7 697.3 1,112.1 1,354.2 1,973.6 1,108.2 1,182.0 30.4 21.5
2008 508.3 988.7 495.7 1,018.9 23.9 42.7 18.2 72.9 412.8 999.3 714.8 1,716.0 1,428.2 2,368.5 1,341.7 1,557.7 32.9 26.7
2007 528.3 983.3 394.1 1,066.4 37.1 39.8 21.4 50.2 409.4 983.3 688.2 1,606.5 1,596.2 2,343.9 1,560.5 1,758.8 33.2 24.2
2006 590.8 973.6 458.6 1,147.3 37.4 35.6 31.0 39.0 483.8 1,003.0 705.6 1,568.2 1,558.3 2,175.8 1,814.7 1,619.1 59.1 33.9
2005 542.1 1,036.7 444.7 1,213.6 34.5 46.8 29.5 38.4 494.9 1,029.8 731.5 1,701.8 1,769.7 2,087.9 2,024.5 1,738.5 63.7 5.0
2004 549.4 1,057.3 480.6 1,250.1 30.0 43.0 26.1 51.3 487.7 1,028.5 771.5 1,499.7 1,876.7 2,027.2 2,068.2 2,037.1 63.2 31.4
2003 555.1 1,111.8 468.1 1,258.7 29.1 44.4 30.5 64.1 452.7 1,082.9 818.9 1,475.6 1,996.8 2,080.4 2,160.5 2,381.1 85.4 37.8

City-data.com crime index counts serious crimes and violent crime more heavily. It adjusts for the number of visitors and daily workers commuting into cities. (higher means more crime, U.S. average = 301.1)


Crime per year
Type City-data.com crime indexRobberiesMurdersRapesAssaultsBurglariesTheftAuto theftArson
Year NewarkIrvingtonNewarkIrvingtonNewarkIrvingtonNewarkIrvingtonNewarkIrvingtonNewarkIrvingtonNewarkIrvingtonNewarkIrvingtonNewarkIrvington
2019 303.7 286.3 636 190 57 7 120 17 929 66 721 178 2,356 565 1,541 273 21 7
2018 368.5 349.7 689 218 75 5 150 24 1,155 107 832 229 2,827 656 2,015 392 38 0
2017 432.6 425.4 1,070 263 77 9 116 33 1,280 140 1,202 278 3,200 710 2,392 421 72 6
2016 451.8 417.7 1,334 284 100 4 99 25 1,104 196 1,138 332 3,048 559 2,122 367 41 17
2015 482.2 566.5 1,616 396 95 14 94 24 987 198 1,433 443 2,999 708 2,335 552 16 9
2014 522.9 625.9 1,922 464 94 19 49 18 944 186 1,736 587 3,810 736 2,412 513 39 12
2013 615.2 659.7 2,433 492 112 17 45 27 926 279 2,074 448 3,997 643 2,894 522 34 7
2012 601.7 593.4 1,976 324 96 9 55 20 1,093 355 2,144 563 4,093 797 3,962 607 62 22
2011 600.9 622.1 1,977 359 94 14 58 24 1,114 331 2,396 594 3,921 721 3,699 563 50 23
2010 547.7 727.6 1,604 374 90 14 79 29 1,112 483 1,928 625 3,661 852 3,620 682 51 9
2009 491.1 778.4 1,319 479 80 17 68 21 1,130 499 1,947 621 3,781 1,102 3,094 660 85 12
2008 508.3 988.7 1,387 573 67 24 51 41 1,155 562 2,000 965 3,996 1,332 3,754 876 92 15
2007 528.3 983.3 1,104 616 104 23 60 29 1,147 568 1,928 928 4,472 1,354 4,372 1,016 93 14
2006 590.8 973.6 1,288 676 105 21 87 23 1,359 591 1,982 924 4,377 1,282 5,097 954 166 20
2005 542.1 1,036.7 1,250 726 97 28 83 23 1,391 616 2,056 1,018 4,974 1,249 5,690 1,040 179 3
2004 549.4 1,057.3 1,345 756 84 26 73 31 1,365 622 2,159 907 5,252 1,226 5,788 1,232 177 19
2003 555.1 1,111.8 1,304 766 81 27 85 39 1,261 659 2,281 898 5,562 1,266 6,018 1,449 238 23

City-data.com crime index counts serious crimes and violent crime more heavily. It adjusts for the number of visitors and daily workers commuting into cities. (higher means more crime, U.S. average = 301.1)

Sex Offenders

According to our data, there are 560 registered sex offenders living in Newark and 113 registered sex offenders living in .
The ratio of residents to sex offenders in Newark is 503 to 1; the ratio in Irvington is 521 to 1.
The number of registered sex offenders compared to the number of residents in Newark is near to than in Irvington.

Cost of Living

Living in Irvington tends to be less expensive than Newark overall. This is reflected in housing, transportation, and other living expenses. However, salaries in Newark are generally higher due to a larger job market.

Income Tax

The same income tax rates apply in both Newark and Irvington, as determined by the New Jersey state tax code.

Property Tax

Property tax rates differ between the two cities, with Newark generally having lower rates compared to Irvington. However, it is important to consider the value of the property in each city when comparing these rates.

Sales Tax

Both Newark and Irvington follow New Jersey's state sales tax of 6.625%.
Income
Type Newark Irvington
Estimated median household income $43,242 $53,871
Estimated per capita income $23,767 $29,042
Cost of living index (U.S. average is 100) 118.1 125.5

If you make $50,000 in Newark, you will have to make $53,133 in Irvington to maintain the same standard of living.

Geographical Conditions

Both cities are located in Northern New Jersey and experience similar geography - flat land with a mix of built environment and green space.
Geographical information
Type Newark Irvington
Land area 23.8 sq. miles 3 sq. miles
Population density 12,910 people per sq. mile 19,928 people per sq. mile
Elevation 95 feet 160 feet
Relative area comparison
Newark, NJ Irvington, NJ
First ancestry reported - percentage
Ancestry NewarkIrvington
Portuguese 3.5% 0.2%
Italian 0.9% 1.2%
Irish 0.2% 0.8%
Polish 0.2% 1.1%
West Indian 0.2% 15.8%
English 0.1% 0.3%
German 0.1% 0.7%
Greek 0.1% 0.2%
Subsaharan African 0.0% 4.0%
Ukrainian 0.0% 0.2%
United States 0.0% 1.9%
Population origin - absolute values
Ancestry NewarkIrvington
Portuguese 8,035 131
Italian 2,145 705
West Indian 569 9,590
Irish 556 477
Polish 364 669
German 288 447
English 233 206
Greek 203 132
Arab 119 13
Ukrainian 100 123
Russian 98 86
Hungarian 57 54
Swedish 56 0
French 54 69
Dutch 34 22
Czech 8 8
Danish 7 0
Slovak 7 75
Lithuanian 2 92
Foreign born residents - absolute values
Type Count
Region NewarkIrvington
All 104,951 14,678
Africa 16,511 1,565
Asia 4,554 569
Europe 9,894 819
Latin America 72,914 11,606
North America 343 112
Oceania 21 7
Foreign born residents - percentage
Type Percentage
Region NewarkIrvington
All 34.2% 24.2%
Africa 5.4% 2.6%
Asia 1.5% 0.9%
Europe 3.2% 1.3%
Latin America 23.7% 19.1%
North America 0.1% 0.2%

Education

While both cities are served by public school systems, Newark has several more options for education, including charter and science/technology schools. Irvington's schools, while smaller, often have lower student-to-teacher ratios.
School enrollment
Type Newark Irvington
Nursery, preschool 4,491 (5.6%) 1,318 (7.3%)
Kindergarten 3,749 (4.7%) 1,228 (6.8%)
Grade 1 to 4 16,977 (21.2%) 3,783 (21.1%)
Grade 5 to 8 17,753 (22.1%) 3,788 (21.1%)
Grade 9 to 12 16,593 (20.7%) 4,159 (23.2%)
College undergrad 16,178 (20.2%) 3,210 (17.9%)
Graduate or professional 4,481 (5.6%) 455 (2.5%)
Students in private schools - absolute values
Type Count
Grade NewarkIrvington
Grades 1 to 8 (elementary and middle school) 1,748 1,458
Grades 9 to 12 (high school) 429 681
Undergraduate colleges 4,371 815
Students in private schools - percentage
Type Percentage
Grade NewarkIrvington
Grades 1 to 8 (elementary and middle school) 5.0% 19.3%
Grades 9 to 12 (high school) 2.6% 16.4%
Undergraduate colleges 27.0% 25.4%
Educational attainment
Type Newark Irvington
Less than high school 21.6% 28%
High school or equiv. 38.9% 32.7%
Less than 1 year of college 4.5% 7.5%
1 or more years of college 12.3% 14.8%
Associate degree 5.1% 4.9%
Bachelor's degree 12.2% 9.3%
Master's degree 4.2% 1.9%
Profess. school degree 0.8% 0.7%
Doctorate degree 0.4% 0.1%
Education level (25-year-olds and older)
Type Newark Irvington
Bachelor's degree or higher 17.6% 12.1%
Graduate or professional degree 5.5% 2.7%
High school or higher 78.4% 72%

Work and Economy

Newark's economy is larger and more diverse, with job opportunities in finance, healthcare, education, and public service. Irvington's small-town economy may offer fewer opportunities, making commuting to nearby larger cities, like Newark, a common choice.

Biggest Employers

In Newark, large employers include Prudential Financial, Rutgers University, and Newark Beth Israel Medical Center. In Irvington, the school district and municipal government are among the largest employers.
Employment and residency - absolute values
Kind NewarkIrvington
Work and live in this city 36,319 1,953
Work and live in this county 71,086 N/A
Workers who work outside the city they live in 237,227 58,742
Workers who work outside the county they live in 47,246 N/A
Working at home 10,193 N/A
Not working at home 108,139 N/A
Daytime population change due to commuting 59,675 N/A
Employment and residency - percentage
Kind NewarkIrvington
Work and live in this city 41.4% 7.7%
Work and live in this county 60.1% N/A
Workers who work outside the city they live in 58.6% 92.3%
Workers who work outside the county they live in 39.9% N/A
Working at home 8.6% N/A
Not working at home 91.4% N/A
Daytime population change due to commuting 21.8% N/A

Weather

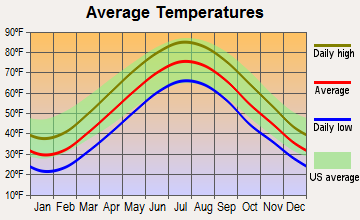
Being in the same state, both Newark and Irvington experience similar weather conditions. Expect hot, humid summers and cold, snowy winters, with moderate spring and fall seasons. Newark's coastal location can sometimes mean slightly milder winters compared to Irvington.
Weather and climate
Type Newark Irvington
Temperature - Average 54°F 53°F
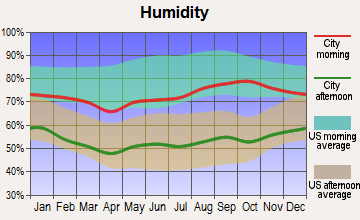
Humidity - Average morning or afternoon humidity 67.3% 67.3%
Humidity - Differences between morning and afternoon humidity 30% 30%
Humidity - Maximum monthly morning or afternoon humidity 77% 77%
Humidity - Minimum monthly morning or afternoon humidity 47% 47%
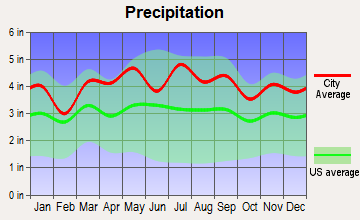
Precipitation - Yearly average 47 in 48.7 in
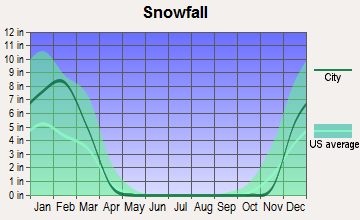
Snowfall - Yearly average 60.3 in 60.3 in
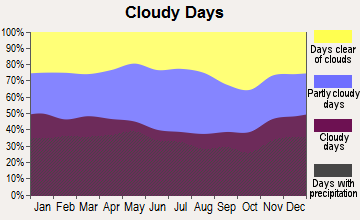
Clouds - Number of days clear of clouds 15.7% 15.7%
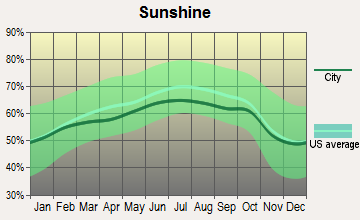
Sunshine amount - Average 60.2% 60.2%
Sunshine amount - Differences during a year 20% 20%
Sunshine amount - Maximum monthly 64% 64%
Sunshine amount - Minimum monthly 44% 44%
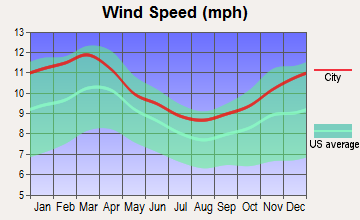
Wind speed - Average 10.6 mph 10.6 mph

Average climate in Newark, New Jersey

Chicago, Illinois average temperatures Chicago, Illinois average precipitation Chicago, Illinois humidity Chicago, Illinois wind speed Chicago, Illinois snowfall Chicago, Illinois sunshine Chicago, Illinois clear and cloudy days
 

Average climate in Irvington, New Jersey

Chicago, Illinois average temperatures Chicago, Illinois average precipitation Chicago, Illinois humidity Chicago, Illinois wind speed Chicago, Illinois snowfall Chicago, Illinois sunshine Chicago, Illinois clear and cloudy days
 

Air pollution
Type AQICONO2OZONEPBPM10PM25SO2
Year NewarkIrvingtonNewarkIrvingtonNewarkIrvingtonNewarkIrvingtonNewarkIrvingtonNewarkIrvingtonNewarkIrvingtonNewarkIrvington
2018 95 95 0.30 0.32 14.4 15.1 23.4 23.6 N/A N/A N/A N/A 8.7 8.6 0.2 0.3
2017 99 99 0.30 0.31 15.1 15.6 22.7 23.1 N/A N/A N/A N/A 8.7 8.5 0.2 0.2
2016 95 95 0.31 0.34 15.5 16.2 23.6 23.9 N/A N/A N/A N/A 8.8 8.6 0.3 0.3
2015 100 100 0.33 0.36 16.7 17.1 23.2 23.6 N/A N/A N/A N/A 8.7 8.8 0.5 0.5
2014 95 97 0.33 0.35 18.8 18.9 23.5 23.6 N/A N/A N/A N/A 8.2 8.4 0.8 0.8
2013 97 98 0.35 0.37 18.3 18.5 23.5 23.7 N/A N/A N/A N/A 9.1 9.0 0.8 0.8
2012 99 99 0.33 0.37 18.5 18.6 23.5 23.7 N/A N/A N/A N/A 9.2 9.2 1.1 1.2
2011 108 108 0.36 0.39 21.2 21.2 22.7 22.9 N/A N/A N/A N/A 8.5 9.1 2.0 2.0
2010 114 114 0.33 0.37 19.4 19.4 26.3 26.1 N/A N/A N/A N/A 8.2 8.8 1.9 1.8
2009 104 105 0.38 0.39 21.6 22.0 19.6 20.3 N/A N/A N/A N/A 9.8 9.8 2.3 2.2
2008 111 113 0.46 0.43 22.4 22.5 21.8 22.4 0.013 0.013 N/A N/A 12.4 12.1 3.4 3.2
2007 123 124 0.51 0.47 23.5 23.7 22.3 23.0 0.016 0.016 N/A N/A 12.7 12.6 4.3 4.2
2006 116 123 0.64 0.61 24.6 25.0 21.5 22.2 0.018 0.018 N/A N/A 12.9 13.0 5.3 5.0
2005 113 113 0.78 0.75 26.1 26.7 20.5 21.1 N/A N/A N/A N/A N/A N/A 7.2 6.8
2004 108 108 0.79 0.76 25.4 25.9 19.5 20.1 0.030 0.030 N/A N/A N/A N/A 6.8 6.5
2003 108 108 0.76 0.82 26.1 27.4 18.1 19.2 0.013 0.012 26.9 26.9 N/A N/A 6.0 6.6
2002 124 126 0.65 0.78 28.5 29.4 18.3 20.2 0.008 0.008 26.1 26.1 N/A N/A 3.8 5.7
2001 125 125 0.79 0.87 30.1 31.4 21.2 22.1 0.020 0.020 26.7 26.5 N/A N/A 6.2 6.8
2000 116 116 1.02 1.03 31.2 32.3 20.0 20.5 0.022 0.022 22.2 22.2 N/A N/A 6.7 6.6
Natural disasters
Type Newark Irvington
Tornado activity compared to U.S. average 64.1% 65.4%
Earthquake activity compared to U.S. average 31.6% 31.7%
Natural disasters compared to U.S. average 30% 30%

Transportation

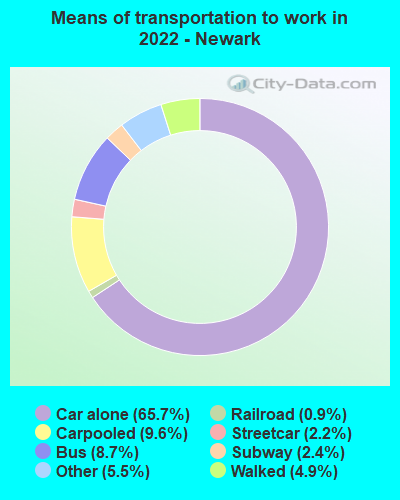
Public transit in Newark is far-reaching with access to trains, buses, and an international airport. Irvington's public transit is less extensive but does provide buses to Newark and other nearby cities.
Transport
Type Newark Irvington
Amtrak stations 2 0
Amtrak stations nearby 3 3
FAA registered aircraft 20 0
Means of transportation to work
Type Newark Irvington
Bicycle 0.2% 0%
Bus 6.8% 19.5%
Carpooled 9.2% 14.7%
Car alone 69.3% 58.4%
Railroad 0.2% 1.3%
Streetcar 0.9% 0%
Subway 1.2% 1.1%
Taxicab 0.7% 0.5%
Walked 3.5% 2.6%
Means of transportation to work
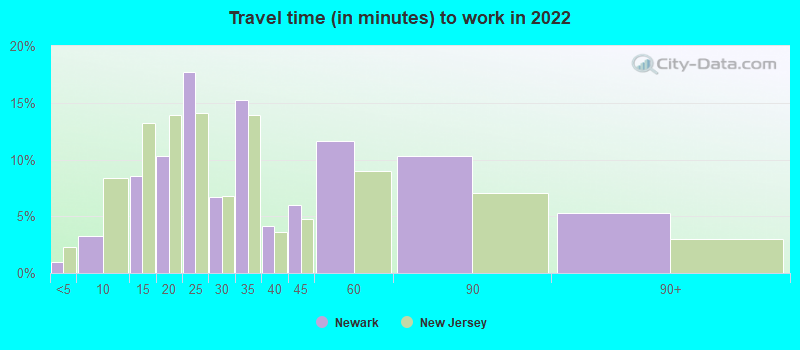
Average travel time to work
Type Newark Irvington
Average 33.2 min 34.9 min
Travel time to work
Time leaving to work
Travel time to work
Time leaving to work

Real Estate

Real estate in both cities varies. Newark offers a mix of residential, commercial, and rental properties. Irvington real estate is primarily residential with more affordable prices.

Neighborhoods

Newark's neighborhoods are diverse, offering a mix of urban, suburban, and historic districts. Irvington is smaller and primarily residential, but offers a close-knit community feel.
Houses and residents
Type Newark Irvington
Houses 122,145 24,122
Average household size (people) 2.8 2.7
Houses occupied 115,145 (94.3%) 22,025 (91.3%)
Houses occupied by owners 24,002 (20.8%) 6,532 (29.7%)
Houses occupied by renters 91,143 (79.2%) 15,493 (70.3%)
Median rent asked for vacant for-rent units $408.22 $1,183
Median price asked for vacant for-sale houses and condos $153,754 $209,556
Estimated median house or condo value $323,200 $306,333
Median number of rooms in apartments 4.2 3.9
Median number of rooms in houses and condos 5.7 5.8
Housing density (houses/condos per square mile) 5,132.8 8,158.6
Household income disparities 47.8% 44.7%
Housing units without a mortgage 459 (2.7%) 542 (16.3%)
Housing units with both a second mortgage and home equity loan 647 (3.8%) 27 (0.8%)
Housing units with a mortgage 16,603 (97.3%) 2,780 (83.7%)
Housing units with a home equity loan 0 (0%) 205 (6.2%)
Housing units with a second mortgage 769 (4.5%) 316 (9.5%)
Housing units lacking complete kitchen facilities 2.3% 2.1%
Housing units lacking complete plumbing facilities 1% 1.8%
Housing units in structures
Housing units in structures NewarkIrvington
One, detached 10.7% 17.1%
One, attached 11.4% 2.0%
Two 19.5% 22.0%
3 or 4 21.1% 22.9%
5 to 9 8.2% 7.3%
10 to 19 6.0% 8.2%
20 to 49 6.5% 8.3%
50 or more 15.8% 12.3%
Mobile homes 0.9% 0.0%
Boats, RVs, vans, etc. 0.1% 0.0%
Marital status
Type Newark Irvington
Divorced 8.7% 8.4%
Never married 51.9% 44.7%
Now married 32.1% 34.9%
Separated 2.5% 5.2%
Widowed 4.8% 6.8%
Class of workers - percentage
Class of Workers NewarkIrvington
Employee of private company 70.8% 73.2%
Private not-for-profit wage and salary workers 6.9% 5.7%
Self-employed workers in own not incorporated business 6.4% 2.7%
Local government workers 5.4% 7.3%
State government workers 4.6% 5.8%
Self-employed in own incorporated business 3.3% 0.9%
Federal government workers 2.5% 4.4%
Unpaid family workers 0.1% 0.0%
Class of workers - absolute values
Class of Workers NewarkIrvington
Employee of private company 85,812 19,032
Federal government workers 3,037 1,142
Local government workers 6,579 1,886
Private not-for-profit wage and salary workers 8,321 1,491
Self-employed in own incorporated business 3,966 244
Self-employed workers in own not incorporated business 7,752 698
State government workers 5,591 1,503
Unpaid family workers 121 12

Industries and Occupations

Newark is a hub for several industries, including finance, healthcare, and education. Irvington, meanwhile, is home to fewer large industries but has opportunities in retail, healthcare, and education.

Health Care

Newark offers more healthcare services with several major hospitals. Irvington, though smaller, has access to necessary healthcare facilities and is in close distance to Newark's hospitals.

Fatal vehicle accidents per 100,000 residents
Type Total count per 100,000Drunk per 100,000Fatal count per 100,000Pedestrian count per 100,000Person count per 100,000Vehicle count per 100,000
Year NewarkIrvingtonNewarkIrvingtonNewarkIrvingtonNewarkIrvingtonNewarkIrvingtonNewarkIrvington
2021 12.0 6.6 0.0 0.0 12.0 6.6 8.1 1.6 26.0 16.5 21.8 14.8
2020 8.1 1.6 1.6 0.0 10.0 1.6 2.9 0.0 23.2 4.9 13.9 4.9
2019 7.8 4.9 1.4 0.0 8.1 4.9 4.2 3.3 15.2 14.8 13.1 14.8
2018 7.4 6.6 1.1 0.0 7.8 6.6 4.6 6.6 11.3 6.6 11.0 6.6
2017 8.9 3.3 1.8 1.6 9.2 3.3 5.0 1.6 15.6 3.3 14.6 4.9
2016 9.6 4.9 2.1 1.6 10.0 4.9 6.4 1.6 26.7 11.5 14.3 6.6
2015 7.9 6.6 0.4 3.3 7.9 6.6 6.4 3.3 12.5 8.2 11.5 6.6
2014 5.3 3.3 1.1 0.0 5.7 4.9 3.9 1.6 7.8 6.6 5.3 4.9
2013 8.6 1.6 2.5 0.0 9.3 1.6 3.6 0.0 23.7 3.3 13.3 3.3
2012 7.2 9.9 0.7 1.6 7.2 11.5 3.6 3.3 18.4 24.7 11.2 16.5
2011 9.7 3.3 4.7 1.6 10.4 3.3 4.7 1.6 27.4 4.9 18.4 3.3
2010 9.4 1.6 1.1 0.0 9.4 1.6 5.1 1.6 14.1 3.3 12.3 3.3
2009 5.4 1.6 1.8 0.0 5.4 1.6 1.8 4.9 14.4 6.6 9.3 3.3
2008 7.6 4.9 3.2 4.9 9.4 4.9 2.5 6.6 25.2 13.2 15.9 4.9
2007 11.5 6.6 4.0 0.0 12.3 6.6 4.7 3.3 24.9 21.4 18.4 13.2
2006 10.5 3.3 3.6 3.3 11.2 3.3 4.0 1.6 36.9 8.2 20.3 4.9
2005 7.6 8.2 3.6 6.6 8.7 8.2 2.9 4.9 17.4 14.8 12.7 9.9
2004 10.5 8.2 4.3 1.6 11.6 8.2 4.0 1.6 30.4 31.3 16.3 18.1
2003 13.8 1.6 2.2 0.0 14.9 1.6 3.3 0.0 38.8 4.9 21.4 3.3
2002 9.5 6.6 2.2 3.3 10.2 6.6 4.0 3.3 25.8 14.8 13.1 8.2
2001 12.0 3.3 3.3 0.0 12.8 3.3 5.1 0.0 29.9 6.6 17.5 4.9
2000 12.1 6.6 4.0 3.3 13.5 6.6 6.2 4.9 25.2 26.4 16.8 13.2
1999 15.6 8.3 4.6 5.0 17.5 8.3 8.4 3.3 44.5 14.9 24.3 11.6
1998 12.6 3.3 1.9 0.0 12.9 3.3 6.5 1.7 31.6 5.0 17.5 3.3
1997 14.6 5.0 2.2 3.3 16.5 5.0 6.0 0.0 43.5 13.2 23.2 9.9
1996 19.0 9.9 3.7 1.7 20.1 13.3 6.0 5.0 54.4 34.8 30.9 16.6
1995 13.3 6.6 4.4 1.7 13.7 6.6 6.7 5.0 32.2 14.9 16.6 11.6
1994 9.9 6.7 2.6 1.7 10.7 10.0 4.0 5.0 26.1 18.3 12.9 6.7
1993 13.1 0.0 1.5 0.0 15.0 0.0 5.5 0.0 58.4 0.0 23.4 0.0
1992 9.5 8.3 2.2 5.0 11.3 10.0 2.6 6.7 25.5 28.4 13.9 13.3
1991 10.6 5.0 0.7 1.7 11.3 5.0 4.4 3.3 30.7 8.4 16.4 5.0
1990 11.6 13.4 2.9 6.7 13.8 13.4 0.0 0.0 33.4 30.1 17.8 18.4
1989 12.5 3.3 2.5 0.0 14.3 3.3 0.0 0.0 37.4 8.4 18.2 3.3
1988 15.0 8.4 4.5 3.3 15.7 8.4 0.0 0.0 40.6 21.7 23.8 11.7
1987 14.1 1.7 3.4 0.0 16.1 1.7 0.0 0.0 32.6 5.0 18.2 1.7
1986 15.8 5.0 4.0 0.0 17.5 5.0 0.0 0.0 40.1 11.7 21.9 5.0
1985 13.2 6.7 3.6 1.7 13.6 6.7 0.0 0.0 32.8 15.1 17.5 6.7
1984 11.4 5.0 1.3 0.0 12.4 5.0 0.0 0.0 32.2 16.7 16.3 6.7
1983 10.5 6.7 1.9 1.7 11.5 8.4 0.0 0.0 24.0 16.7 14.4 11.7
1982 11.0 6.7 1.9 0.0 13.2 6.7 0.0 0.0 32.0 11.7 15.4 6.7
1981 13.3 5.0 4.0 1.7 14.8 5.0 0.0 0.0 33.3 11.7 17.9 5.0
1980 10.3 3.3 2.4 0.0 10.6 3.3 0.0 0.0 22.5 5.0 12.5 3.3
1979 10.8 6.7 2.4 0.0 10.8 6.7 0.0 0.0 24.8 11.7 12.3 8.4
1978 10.6 5.0 2.4 3.3 11.5 5.0 0.0 0.0 29.7 10.0 14.4 5.0
1977 9.6 5.0 2.6 3.3 9.9 5.0 0.0 0.0 22.3 8.4 14.8 5.0
1976 11.4 8.4 2.6 1.7 13.1 8.4 0.0 0.0 34.3 26.8 17.1 13.4
1975 11.2 8.4 2.5 1.7 12.9 8.4 0.0 0.0 33.7 26.8 16.9 13.4

Fatal vehicle accidents
Type Total countDrunkFatal countPedestrian countPerson countVehicle count
Year NewarkIrvingtonNewarkIrvingtonNewarkIrvingtonNewarkIrvingtonNewarkIrvingtonNewarkIrvington
1975 40 5 9 1 46 5 0 0 120 16 60 8
1976 40 5 9 1 46 5 0 0 120 16 60 8
1977 33 3 9 2 34 3 0 0 77 5 51 3
1978 36 3 8 2 39 3 0 0 101 6 49 3
1979 36 4 8 0 36 4 0 0 83 7 41 5
1980 34 2 8 0 35 2 0 0 74 3 41 2
1981 43 3 13 1 48 3 0 0 108 7 58 3
1982 35 4 6 0 42 4 0 0 102 7 49 4
1983 33 4 6 1 36 5 0 0 75 10 45 7
1984 35 3 4 0 38 3 0 0 99 10 50 4
1985 40 4 11 1 41 4 0 0 99 9 53 4
1986 47 3 12 0 52 3 0 0 119 7 65 3
1987 41 1 10 0 47 1 0 0 95 3 53 1
1988 43 5 13 2 45 5 0 0 116 13 68 7
1989 35 2 7 0 40 2 0 0 105 5 51 2
1990 32 8 8 4 38 8 0 0 92 18 49 11
1991 29 3 2 1 31 3 12 2 84 5 45 3
1992 26 5 6 3 31 6 7 4 70 17 38 8
1993 36 0 4 0 41 0 15 0 160 0 64 0
1994 27 4 7 1 29 6 11 3 71 11 35 4
1995 36 4 12 1 37 4 18 3 87 9 45 7
1996 51 6 10 1 54 8 16 3 146 21 83 10
1997 39 3 6 2 44 3 16 0 116 8 62 6
1998 33 2 5 0 34 2 17 1 83 3 46 2
1999 41 5 12 3 46 5 22 2 117 9 64 7
2000 33 4 11 2 37 4 17 3 69 16 46 8
2001 33 2 9 0 35 2 14 0 82 4 48 3
2002 26 4 6 2 28 4 11 2 71 9 36 5
2003 38 1 6 0 41 1 9 0 107 3 59 2
2004 29 5 12 1 32 5 11 1 84 19 45 11
2005 21 5 10 4 24 5 8 3 48 9 35 6
2006 29 2 10 2 31 2 11 1 102 5 56 3
2007 32 4 11 0 34 4 13 2 69 13 51 8
2008 21 3 9 3 26 3 7 4 70 8 44 3
2009 15 1 5 0 15 1 5 3 40 4 26 2
2010 26 1 3 0 26 1 14 1 39 2 34 2
2011 27 2 13 1 29 2 13 1 76 3 51 2
2012 20 6 2 1 20 7 10 2 51 15 31 10
2013 24 1 7 0 26 1 10 0 66 2 37 2
2014 15 2 3 0 16 3 11 1 22 4 15 3
2015 22 4 1 2 22 4 18 2 35 5 32 4
2016 27 3 6 1 28 3 18 1 75 7 40 4
2017 25 2 5 1 26 2 14 1 44 2 41 3
2018 21 4 3 0 22 4 13 4 32 4 31 4
2019 22 3 4 0 23 3 12 2 43 9 37 9
2020 25 1 5 0 31 1 9 0 72 3 43 3
2021 37 4 0 0 37 4 25 1 80 10 67 9
Police full-time law enforcement employees
Year NewarkIrvington
2021 1,337 211
2020 1,407 201
2019 1,533 234
2018 1,490 223
2017 1,491 207
2016 1,383 195
2015 1,203 177
2014 1,312 189
2013 1,276 0
2012 1,322 176
2011 1,209 192
2010 1,666 196
2009 1,671 217
2008 1,707 219
2007 1,623 220
2006 1,498 220
2005 1,550 218
2004 1,518 216
2003 1,562 212
Police full-time law enforcement employees (per 1,000 residents)
Year NewarkIrvington
2021 4.5 3.7
2020 5.0 3.7
2019 5.4 4.3
2018 5.3 4.1
2017 5.3 3.8
2016 4.9 3.6
2015 4.3 3.2
2014 4.7 3.5
2013 4.6 0.0
2012 4.7 3.2
2011 4.3 3.5
2010 6.0 3.6
2009 6.0 3.9
2008 6.1 3.9
2007 5.8 3.8
2006 5.3 3.7
2005 5.5 3.6
2004 5.4 3.6
2003 5.6 3.5

Infrastructure

Newark's infrastructure is more robust, with a larger airport, several highways, and railway lines. Irvington, being smaller, has a simpler infrastructure but still offers access to major highways.
Infrastructure
Type Newark Irvington
TV stations 31 31
Bank branches located here 69 5
Bank institutions located here 19 3

Schools

School facilities
Type Newark Irvington
Private elementary/middle schools 12 1
Private high schools 6 0
Public elementary/middle schools 52 11
Public high schools 33 2
Colleges/Universities 8 0
HMDA - Conventional home purchase loans - Applications denied
Year NewarkIrvington
1999 429 144
2000 515 192
2001 536 177
2002 547 168
2003 740 250
2004 1,167 354
2005 2,198 553
2006 3,193 867
2007 2,300 521
2008 508 129
2009 182 28

Culture and Food

Newark provides a rich cultural scene with a variety of cuisine, art, and music. Irvington, while smaller, has a vibrant community culture and offers a range of dining options.

Sports Teams

As home to the Prudential Center, Newark hosts the New Jersey Devils NHL team and several other sporting events. Irvington doesn't have major sports teams, but its proximity to Newark offers access to these events.