Both Newark and Jersey City are vibrant, diverse locales just a stone's throw away from Manhattan and share many commonalities. However, they offer distinctly unique lifestyles and experiences. This comprehensive comparison delves into the key aspects including safety, cost of living, weather conditions, education, economy, infrastructure, and more, assisting potential residents or visitors in making an informed decision.
Distance between
Newark, NJ and
Jersey City, NJ : 6.3 miles
Newark's population is larger by 8%. Its population has grown by 33,674 people (12.3%) since 2000. The population of Jersey City has grown by 43,872 people (18.3%) during that time.
Newark has historically struggled with crime, but recent years have seen significant improvements. Still, some parts of the city have higher crime rates compared to national averages. On the other hand, Jersey City stands as one of the safer cities in the state, with crime rates continuing to trend downwards.
City-data.com crime index counts serious crimes and violent crime more heavily. It adjusts for the number of visitors and daily workers commuting into cities. (higher means more crime, U.S. average = 301.1)
City-data.com crime index counts serious crimes and violent crime more heavily. It adjusts for the number of visitors and daily workers commuting into cities. (higher means more crime, U.S. average = 301.1)
Sex Offenders
According to our data, there are 560 registered sex offenders living in Newark and 248 registered sex offenders living in . The ratio of residents to sex offenders in Newark is 503 to 1; the ratio in Jersey City is 1,065 to 1. The number of registered sex offenders compared to the number of residents is larger in Newark than in Jersey City.
Cost of Living
Living in Jersey City tends to be more expensive than in Newark. The housing costs, in particular, are considerably higher in Jersey City - though it still provides a cheaper alternative to Manhattan. Also, everyday expenses like groceries or healthcare might be slightly more expensive in Jersey City.
Income Tax
Both Jersey City and Newark follow New Jersey's state income tax, which is based on income tiers. The rate ranges from 1.4% to 10.75%.
Property Tax
Property taxes in Jersey City tend to be lower as compared to Newark. However, both cities often offer abatements or tax incentives when purchasing property.
Sales Tax
Newark and Jersey City have the same state sales tax rate of 6.625%. However, both cities are designated Urban Enterprise Zones, where certain businesses may charge half the state sales tax.
Income
Type
Newark
Jersey City
Estimated median household income
$43,242
$81,958
Estimated per capita income
$23,767
$51,119
Cost of living index (U.S. average is 100)
118.1
123.5
If you make $50,000 in Newark, you will have to make $52,286 in Jersey City to maintain the same standard of living.
Geographical Conditions
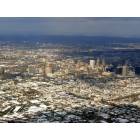
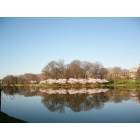
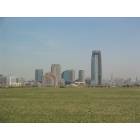
Newark has a more industrial landscape with a bustling port area, but also showcases areas of green space like Branch Brook Park. Jersey City offers stunning views of the Manhattan skyline from its waterfront location and numerous green spaces like Liberty State Park.
Newark's school system has had its share of struggles, but recent years have seen improvements under state control. Jersey City has a more consistently positive educational reputation, with some high-ranking public schools and access to multiple quality universities.
Jersey City boasts a robust economy with a particularly strong financial industry. Many individuals work in professional, scientific, and technical service sectors. Newark's economy is diverse and expansive, with its healthcare and social assistance sector being the largest employers.
Biggest Employers
Newark's largest employers include Newark Beth Israel Medical Center and Rutgers University. In Jersey City, JP Morgan Chase and Goldman Sachs employ a significant portion of the workforce.
There were 1 building permits issued in Newark in 2012, compared to 245 building permits issued in Jersey City in 2012 (245 more than in 2011).
In Newark (Essex County), 78.3% voted for Democrats and 21.4% for Republicans in 2012 Presidential Election. In Jersey City (Hudson County), 77.7% voted for Democrats and 21.5% for Republicans.
Elections
Type
Democrats
Republicans
Other
Year
Newark
Jersey City
Newark
Jersey City
Newark
Jersey City
2020
77.4%
72.8%
21.9%
26.4%
0.7%
0.8%
2016
77.2%
74.6%
20.2%
22.3%
2.6%
3.1%
2012
78.3%
77.7%
21.4%
21.5%
0.3%
0.9%
2008
76.2%
73.3%
23.5%
26.3%
0.3%
0.4%
2004
70.7%
67.4%
28.9%
32.1%
0.4%
0.5%
2000
71.9%
71.0%
25.9%
26.3%
2.2%
2.7%
1996
69.0%
69.9%
25.6%
23.1%
5.4%
7.0%
Breakdown of population affiliated with a religious congregation
Type
Adherents
Congregations
Religion
Newark
Jersey City
Newark
Jersey City
CATHOLIC CHURCH
33.4%
44.3%
10.7%
13.9%
MUSLIM ESTIMATE
3.0%
3.3%
2.8%
3.4%
AMERICAN BAPTIST CHURCHES IN THE USA
2.1%
0.8%
8.2%
4.7%
EPISCOPAL CHURCH
0.9%
0.3%
3.6%
3.2%
SEVENTH DAY ADVENTIST CHURCH
0.8%
0.5%
2.8%
3.9%
SOUTHERN BAPTIST CONVENTION
0.3%
0.4%
2.6%
3.4%
COPTIC ORTHODOX CHURCH
0.1%
0.7%
0.3%
1.1%
EVANGELICAL LUTHERAN CHURCH IN AMERICA
0.1%
0.4%
1.0%
5.8%
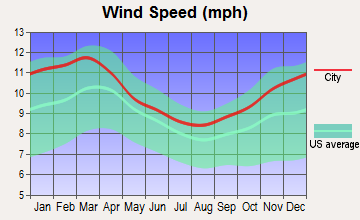
Weather
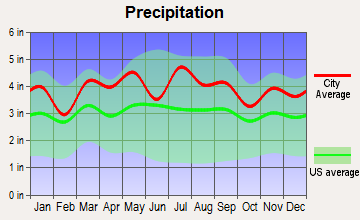
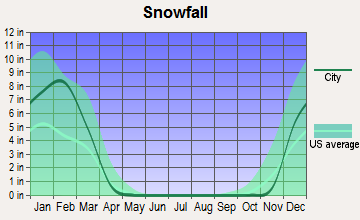
The weather in both Newark and Jersey City is relatively comparable given their proximity. They experience typically northeast climate with hot summers, cold winters, and midpoint temperatures in spring and fall. Both cities can experience significant snow in the winter.
Weather and climate
Type
Newark
Jersey City
Temperature - Average
54°F
54.7°F
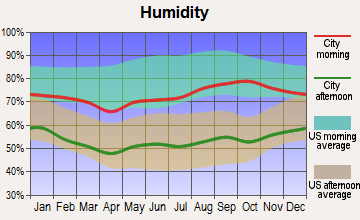
Humidity - Average morning or afternoon humidity
67.3%
67.3%
Humidity - Differences between morning and afternoon humidity
30%
29.7%
Humidity - Maximum monthly morning or afternoon humidity
77%
76.9%
Humidity - Minimum monthly morning or afternoon humidity
47%
47.2%
Precipitation - Yearly average
47 in
47.5 in
Snowfall - Yearly average
60.3 in
58.8 in
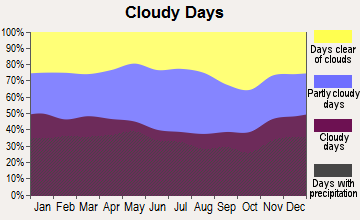
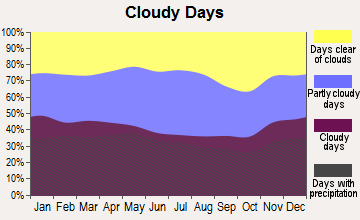
Clouds - Number of days clear of clouds
15.7%
16.5%
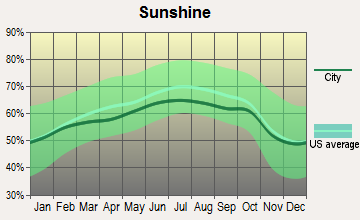
Sunshine amount - Average
60.2%
60.2%
Sunshine amount - Differences during a year
20%
20%
Sunshine amount - Maximum monthly
64%
64%
Sunshine amount - Minimum monthly
44%
44%
Wind speed - Average
10.6 mph
9.2 mph
Average climate in Newark, New Jersey
Average climate in Jersey City, New Jersey
Air pollution
Type
AQI
CO
NO2
OZONE
PB
PM10
PM25
SO2
Year
Newark
Jersey City
Newark
Jersey City
Newark
Jersey City
Newark
Jersey City
Newark
Jersey City
Newark
Jersey City
Newark
Jersey City
Newark
Jersey City
2018
95
93
0.30
0.33
14.4
19.2
23.4
23.9
N/A
N/A
N/A
N/A
8.7
9.2
0.2
0.6
2017
99
95
0.30
0.33
15.1
20.1
22.7
23.6
N/A
N/A
N/A
N/A
8.7
10.6
0.2
0.5
2016
95
93
0.31
0.37
15.5
20.5
23.6
24.1
N/A
N/A
N/A
N/A
8.8
9.6
0.3
0.7
2015
100
100
0.33
0.58
16.7
17.8
23.2
24.0
N/A
N/A
N/A
N/A
8.7
7.5
0.5
0.5
2014
95
95
0.33
0.56
18.8
18.5
23.5
23.3
N/A
N/A
N/A
N/A
8.2
7.1
0.8
0.7
2013
97
96
0.35
0.63
18.3
18.8
23.5
23.7
N/A
N/A
N/A
N/A
9.1
8.0
0.8
0.6
2012
99
98
0.33
0.69
18.5
18.2
23.5
23.5
N/A
N/A
N/A
N/A
9.2
9.3
1.1
1.0
2011
108
107
0.36
0.59
21.2
20.4
22.7
22.6
N/A
N/A
N/A
N/A
8.5
10.1
2.0
2.3
2010
114
112
0.33
0.52
19.4
19.0
26.3
24.6
N/A
N/A
N/A
N/A
8.2
10.4
1.9
1.8
2009
104
104
0.38
0.53
21.6
20.8
19.6
20.4
N/A
N/A
N/A
N/A
9.8
12.4
2.3
2.4
2008
111
108
0.46
0.57
22.4
21.9
21.8
21.2
0.013
0.013
N/A
N/A
12.4
17.3
3.4
3.5
2007
123
120
0.51
0.65
23.5
22.8
22.3
21.6
0.016
0.016
N/A
N/A
12.7
14.0
4.3
4.1
2006
116
116
0.64
0.86
24.6
23.8
21.5
20.9
0.018
0.018
N/A
N/A
12.9
12.7
5.3
6.0
2005
113
107
0.78
1.04
26.1
25.2
20.5
19.9
N/A
N/A
N/A
N/A
N/A
N/A
7.2
7.8
2004
108
106
0.79
1.06
25.4
24.8
19.5
18.8
0.030
0.030
N/A
N/A
N/A
N/A
6.8
8.3
2003
108
107
0.76
1.07
26.1
26.5
18.1
18.2
0.013
0.019
26.9
26.8
N/A
N/A
6.0
8.6
2002
124
122
0.65
1.02
28.5
27.4
18.3
19.7
0.008
0.008
26.1
26.3
N/A
N/A
3.8
7.0
2001
125
121
0.79
1.02
30.1
28.9
21.2
23.8
0.020
0.020
26.7
28.2
N/A
N/A
6.2
9.0
2000
116
115
1.02
1.13
31.2
29.3
20.0
22.2
0.022
0.022
22.2
22.2
N/A
N/A
6.7
7.8
Natural disasters
Type
Newark
Jersey City
Tornado activity compared to U.S. average
64.1%
60.7%
Earthquake activity compared to U.S. average
31.6%
31.3%
Natural disasters compared to U.S. average
30%
21%
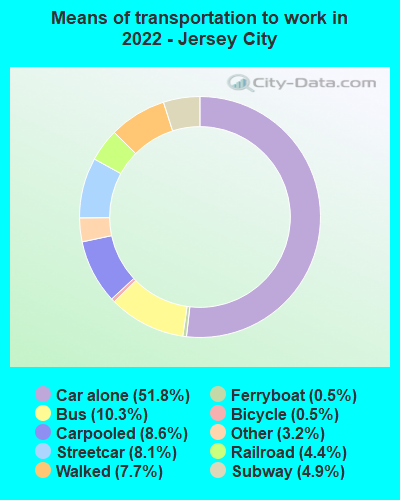
Transportation
Both cities are known for excellent public transit. Newark Liberty International Airport provides great air connectivity while PATH and NJ Transit facilitate easy commuting to NYC. In Jersey City, PATH trains, ferries, and extensive bus networks provide seamless connectivity to Manhattan.
Transport
Type
Newark
Jersey City
Amtrak stations
2
0
Amtrak stations nearby
3
3
FAA registered aircraft
20
0
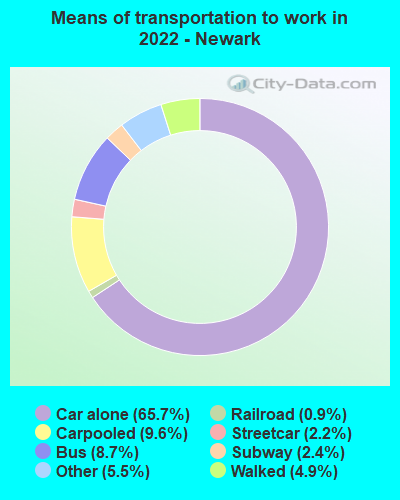
Means of transportation to work
Type
Newark
Jersey City
Bicycle
0.2%
1%
Bus
6.8%
8.5%
Carpooled
9.2%
10.9%
Car alone
69.3%
56.2%
Ferryboat
0%
0.5%
Railroad
0.2%
2.2%
Streetcar
0.9%
6.8%
Subway
1.2%
1.8%
Taxicab
0.7%
0.4%
Walked
3.5%
10.6%
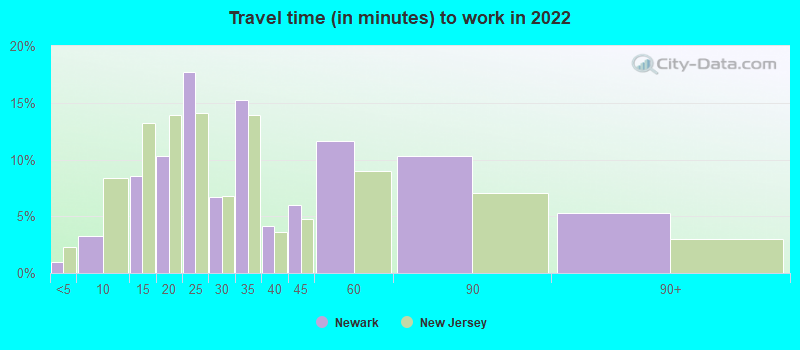
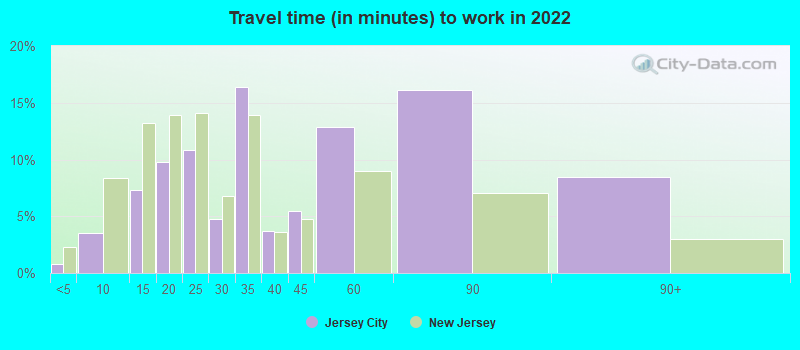
Average travel time to work
Type
Newark
Jersey City
Average
33.2 min
37.9 min
Other means
28 min
29.3 min
Public transportation
45.1 min
43.3 min
Private vehicle occupancy
Type
Newark
Jersey City
Average
1.2
1.2
Drove alone
81.7%
86.9%
In 2 person carpool
14.8%
11.4%
In 3 person carpool
2.4%
1%
In 4 person carpool
0.6%
0.6%
In 7+ person carpool
0.4%
0%
How many people usually rode to work in the car, truck or van.
Real Estate
Real estate prices are higher in Jersey City, reflecting its rising demand and proximity to New York City. Newark offers lower real estate prices, providing an opportunity for potential homebuyers seeking affordable housing in a metropolitan setting.
Neighborhoods
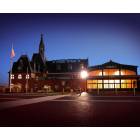
Jersey City offers diverse neighborhoods from the bustling downtown area to quieter, family-friendly neighborhoods like The Heights. Newark also offers varied neighborhoods, with the Ironbound district known for its vibrant dining scene and cultural diversity.
Houses and residents
Type
Newark
Jersey City
Houses
122,145
131,609
Average household size (people)
2.8
2.5
Median year apartment built
1967
1973
Median year house/condo built
1960
1958
Length of stay in the house since moving in
17.1 years
14.7 years
Houses occupied
115,145 (94.3%)
119,158 (90.5%)
Houses occupied by owners
24,002 (20.8%)
34,358 (28.8%)
Houses occupied by renters
91,143 (79.2%)
84,800 (71.2%)
Median rent asked for vacant for-rent units
$408.22
$3,976
Median monthly housing costs
$1,277
$1,802
Median price asked for vacant for-sale houses and condos
$153,754
$189,931
Estimated median house or condo value
$323,200
$487,400
Median numbers of rooms
4.5
3.8
Median number of rooms in apartments
4.2
3.5
Median number of rooms in houses and condos
5.7
4.9
Median house price - detached houses
$321,688
$528,884
Median house price - in 2-unit structures
$347,644
$575,313
Median house price - in 3-to-4-unit structures
$337,992
$573,856
Median house price - in 5 or more unit structures
$210,604
$607,790
Median house price - Townhouses or other attached units
$224,107
$605,198
Median house price - All housing units
$325,388
$579,559
Median house age
55
51
Renting percentage
77.9%
70.5%
Housing density (houses/condos per square mile)
5,132.8
8,823.3
House value disparities
31.5%
26.6%
Household income disparities
47.8%
47.2%
Median household income for houses/condes with a mortgage
$71,676
$134,110
Median household income for apartments without a mortgage
$62,906
$76,768
Housing units without a mortgage
459 (2.7%)
238 (1.1%)
Housing units with both a second mortgage and home equity loan
647 (3.8%)
1,275 (5.8%)
Housing units with a mortgage
16,603 (97.3%)
21,710 (98.9%)
Housing units with a home equity loan
0 (0%)
0 (0%)
Housing units with a second mortgage
769 (4.5%)
1,438 (6.6%)
House/condo owner moved in on average (years ago)
18
12
House/condo renter moved in on average (years ago)
5
1
Housing units lacking complete kitchen facilities
2.3%
2.1%
Housing units lacking complete plumbing facilities
1%
0.6%
Housing units in structures
Housing units in structures
Newark
Jersey City
One, detached
10.7%
7.6%
One, attached
11.4%
6.0%
Two
19.5%
20.0%
3 or 4
21.1%
10.7%
5 to 9
8.2%
10.0%
10 to 19
6.0%
5.8%
20 to 49
6.5%
10.4%
50 or more
15.8%
29.4%
Mobile homes
0.9%
0.1%
Boats, RVs, vans, etc.
0.1%
0.1%
Median real estate property taxes paid for housing units
Self-employed workers in own not incorporated business
7,752
6,079
State government workers
5,591
4,015
Unpaid family workers
121
400
Industries and Occupations
Newark's major industries are transportation, healthcare, and education with a considerable portion of occupations in service and sales. Jersey City, also known as 'Wall Street West', is a hub for finance and insurance professions due to a massive presence of financial institutions.
Newark offers several reputed hospitals including Rutgers New Jersey Medical School. Jersey City is home to the Jersey City Medical Center, a renowned teaching hospital, and other quality healthcare facilities.
Health (county statistics)
Type
Newark
Jersey City
General health status score of residents in this county from 1 (poor) to 5 (excellent)
Both cities have good infrastructure. Newark is home to a significant air and sea port, and Jersey City has few rivals when it comes to premium office space due to its high-rise commercial buildings.
Infrastructure
Type
Newark
Jersey City
Hospitals
8
6
TV stations
31
30
Bank branches located here
69
58
Bank institutions located here
19
18
Main business address for public companies
15
11
Drinking water stations with reported violations in the past
HMDA - Conventional home purchase loans - Applications denied
Year
Newark
Jersey City
1999
429
427
2000
515
603
2001
536
514
2002
547
580
2003
740
756
2004
1,167
1,127
2005
2,198
1,625
2006
3,193
1,929
2007
2,300
1,618
2008
508
932
2009
182
348
Culture and Food
Jersey City boasts a burgeoning food scene and has been recognized as one of the most diverse cities in the nation. Newark, on the other hand, stands out for its rich arts and culture, particularly its jazz music heritage, and the Ironbound district's renowned Portuguese and Brazilian eateries.
Sports Teams
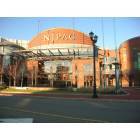
Newark is home to the New Jersey Devils NHL team and the Prudential Center that also hosts various concerts and events. Jersey City does not have a major league sports team but offers multiple sports events and recreational facilities.


 Newark, NJ
 Jersey City, NJ