Moving or looking for a great place to visit? Anaheim, located in sunny Southern California, and the North Coast, nestled along the stunning California coastline, both offer unique lifestyles if you're thinking of relocating or planning a vacation. Comparing these two regions in terms of crime/safety, weather, cost of living, education, economy, infrastructure, industries, employers, real estate, neighborhoods, transit, taxes, culture, sports, geography, and healthcare will provide an insight into the quality of life you can expect.
Statistically, North Coast has a slightly lower crime rate than Anaheim. Anaheim, which is a much larger city, is generally safe, but crime rates can vary depending on the specific area. Generally, both areas enjoy relatively safe living spaces, with pockets of higher crime rates in certain neighborhoods. Tourists should always exercise standard precautions in both places.
Cost of Living
In general, North Coast's cost of living may be a bit higher than Anaheim's due to higher housing costs, particularly in more desirable coastal areas. Cities like Anaheim, while not cheap by any means, tend to have a more diverse range of housing options, making it slightly more affordable overall.
Income Tax
California has a progressive income tax, and this applies to residents in both Anaheim and the North Coast alike.
Property Tax
Property taxes vary by county in California, with rates generally lower in North Coast counties compared to those in Anaheim's Orange County.
Sales Tax
Both Anaheim and North Coast are subject to California's 6% state sales tax. However, Anaheim has a total sales tax rate of 7.75%, while North Coast rates can vary by city, averaging around 7.5%.
Income
Type
North Coast
Anaheim
Estimated median household income
$102,807
$81,747
Estimated per capita income
$50,809
$32,827
Cost of living index (U.S. average is 100)
96.1
88.5
If you make $50,000 in Anaheim, you will have to make $54,294 in North Coast to maintain the same standard of living.
Geographical Conditions
North Coast offers diverse geographical features, from rugged coastlines and forests to mountains and rivers. In contrast, Anaheim is located in the flat plain of the Los Angeles Basin.
Geographical information
Type
North Coast
Anaheim
Land area
59.4 sq. miles
48.9 sq. miles
Population density
6,335.5 people per sq. mile
7,068.3 people per sq. mile
Relative area comparison
North Coast, CA Anaheim, CA
Education
Both Anaheim and the North Coast feature strong public and private school systems. Anaheim is home to several well-recognized universities like Anaheim University, while North Coast offers a number of prestigious institutions, including Humboldt State University.
Anaheim's economy is mainly driven by industries like entertainment, manufacturing, and retail trade. In contrast, the North Coast relies heavily on the tourism industry, forestry, fishing, and some agriculture. Job prospects tend to be more diverse in Anaheim due to its larger size and economic complexity.
Biggest Employers
In Anaheim, Disneyland Resort tops the list of employers, followed by major corporations like AT&T and Kaiser Permanente. On the North Coast, the major employers include local government, healthcare systems, and higher educational institutions.
Weather
North Coast is characterized by a cooler, Mediterranean climate with mild to cool winters and warm to hot dry summers. On the other hand, Anaheim boasts a typical Southern California climate – warm, with plenty of sunshine throughout the year. If you prefer cooler, more varied weather, North Coast might be more suitable for you.
Weather and climate
Type
North Coast
Anaheim
Temperature - Average
64.4°F
64.9°F
Humidity - Average morning or afternoon humidity
70.2%
69.6%
Humidity - Differences between morning and afternoon humidity
26.7%
25.9%
Humidity - Maximum monthly morning or afternoon humidity
78.7%
77.9%
Humidity - Minimum monthly morning or afternoon humidity
52%
52%
Precipitation - Yearly average
13 in
12 in
Snowfall - Yearly average
0 in
0 in
Clouds - Number of days clear of clouds
26.5%
26.6%
Sunshine amount - Average
78.4%
78.4%
Sunshine amount - Differences during a year
21.9%
22%
Sunshine amount - Maximum monthly
84.9%
84.9%
Sunshine amount - Minimum monthly
62.9%
63%
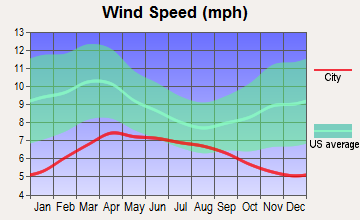
Wind speed - Average
6 mph
5.7 mph
Average climate in North Coast, California
Average climate in Anaheim, California
Air pollution
Type
AQI
CO
NO2
OZONE
PB
PM10
PM25
SO2
Year
North Coast
Anaheim
North Coast
Anaheim
North Coast
Anaheim
North Coast
Anaheim
North Coast
Anaheim
North Coast
Anaheim
North Coast
Anaheim
North Coast
Anaheim
2018
119
139
0.35
0.36
14.4
13.7
26.1
26.8
N/A
0.007
27.5
27.5
12.6
12.1
0.7
0.7
2017
116
145
0.34
0.50
13.8
14.8
28.8
26.7
N/A
0.007
26.7
26.7
13.8
13.5
0.5
0.6
2016
102
132
0.33
0.57
12.2
14.5
29.3
26.3
N/A
0.007
24.1
24.1
12.5
12.9
0.2
0.3
2015
106
142
0.32
0.45
13.2
14.7
29.8
26.0
N/A
0.007
25.0
25.0
14.5
14.8
0.2
0.3
2014
110
138
0.29
0.40
12.9
15.0
28.6
26.7
N/A
0.008
26.7
26.7
15.5
16.2
0.4
0.5
2013
107
138
0.34
0.47
13.9
14.8
27.8
25.3
0.003
0.005
29.5
28.3
14.2
13.9
0.3
0.5
2012
103
142
0.30
0.46
12.7
14.5
26.8
25.0
0.004
0.005
28.2
27.0
14.3
14.7
0.1
0.2
2011
109
138
0.31
0.42
14.7
15.9
27.0
26.7
0.006
0.007
27.7
27.4
15.9
16.0
0.7
0.8
2010
102
130
0.33
0.44
14.3
16.7
26.2
25.8
0.011
0.009
23.6
23.5
14.0
14.9
0.6
0.6
2009
118
151
0.35
0.41
15.5
18.0
27.6
26.0
0.009
0.010
24.3
24.4
14.5
15.4
1.1
1.1
2008
124
156
0.39
0.38
16.5
20.3
28.2
26.7
0.010
0.010
29.5
30.2
21.6
18.9
1.1
1.1
2007
100
135
0.36
0.38
16.3
19.5
27.0
26.2
0.012
0.012
N/A
N/A
N/A
N/A
0.8
0.8
2006
114
128
0.40
0.43
17.2
19.1
26.4
26.3
0.007
0.008
N/A
N/A
N/A
N/A
1.3
1.3
2005
95
128
0.39
0.45
17.7
20.7
27.9
31.3
0.012
0.013
N/A
N/A
N/A
N/A
1.3
1.3
2004
119
134
0.50
0.53
19.2
19.9
30.5
37.1
0.014
0.015
N/A
N/A
N/A
N/A
1.6
1.6
2003
122
143
0.64
0.69
21.9
23.7
28.9
23.8
0.030
0.025
N/A
N/A
N/A
N/A
1.1
1.1
2002
106
134
0.65
0.77
22.0
24.1
25.5
21.8
0.018
0.019
N/A
N/A
N/A
N/A
1.8
2.1
2001
116
143
0.73
0.94
22.0
28.4
25.4
24.5
0.033
0.035
N/A
N/A
N/A
N/A
1.5
1.7
2000
125
152
0.80
0.80
24.4
29.4
24.0
23.0
0.027
0.030
N/A
N/A
N/A
N/A
1.9
1.9
Natural disasters
Type
North Coast
Anaheim
Tornado activity compared to U.S. average
18.6%
19.3%
Earthquake activity compared to U.S. average
6,843.6%
7,039.7%
Natural disasters compared to U.S. average
32%
32%
Transportation
Anaheim offers more public transit options, including bus and rail service. Commuting might be more of a concern on North Coast, where public transportation is less extensive, making it more car-dependent generally.
Transport
Type
North Coast
Anaheim
Amtrak stations
0
1
Amtrak stations nearby
3
3
FAA registered aircraft
0
136
FAA registered aircraft manufacturers and dealers
0
3
Means of transportation to work
Type
North Coast
Anaheim
Bicycle
0.7%
1%
Bus
1.2%
0.9%
Carpooled
10.7%
10.8%
Car alone
81.4%
83.4%
Motorcycle
0.2%
0.2%
Railroad
0%
0.2%
Subway
0%
0.3%
Walked
1.4%
1.6%
Average travel time to work
Type
North Coast
Anaheim
Average
28.8 min
30.8 min
Real Estate
Real estate prices in North Coast areas tend to have a higher range due to its picturesque views and smaller home inventory. Anaheim, while still expensive, offers a wider range of options from condos to multi-family homes.
Neighborhoods
Both locations offer a variety of neighborhoods to fit different lifestyles. Anaheim features neighborhoods like Disneyland Resort District and The Colony, while North Coast hosts a mixture of urban, suburban, and rural neighborhoods.
Houses and residents
Type
North Coast
Anaheim
Houses
137,450
110,319
Average household size (people)
2.7
3.4
Houses occupied
133,254 (96.9%)
105,608 (95.7%)
Houses occupied by owners
84,546 (63.4%)
51,684 (48.9%)
Houses occupied by renters
48,708 (36.6%)
53,924 (51.1%)
Median rent asked for vacant for-rent units
$2,340
$2,111
Median price asked for vacant for-sale houses and condos
$1,099,558
$1,256,069
Estimated median house or condo value
$883,291
$688,400
Median number of rooms in apartments
3.9
3.6
Median number of rooms in houses and condos
6.1
6.1
Renting percentage
37.7%
51.5%
Housing density (houses/condos per square mile)
2,312.7
2,254.1
Household income disparities
41.2%
43.6%
Housing units without a mortgage
13,396 (19.5%)
374 (1%)
Housing units with both a second mortgage and home equity loan
282 (0.4%)
2,222 (6%)
Housing units with a mortgage
55,188 (80.5%)
36,875 (99%)
Housing units with a home equity loan
6,297 (9.2%)
0 (0%)
Housing units with a second mortgage
7,643 (11.1%)
2,794 (7.5%)
Housing units lacking complete kitchen facilities
1%
4.5%
Housing units lacking complete plumbing facilities
Self-employed workers in own not incorporated business
15,532
11,077
State government workers
5,751
5,046
Unpaid family workers
744
65
Industries and Occupations
The Anaheim area is known for its entertainment industry, with Disneyland Resort being the city's largest employer. North Coast has a more varied economy with occupations across tourism, farming, wineries, fishing, and wood production.
Health Care
Both regions offer high-quality healthcare services. Anaheim boasts several prominent hospitals, while North Coast's healthcare services are predominantly community-oriented health centers.
Infrastructure
Anaheim's well-developed infrastructure with highways, airports, and public transit options offers more accessibility compared to the relatively less developed North Coast, with smaller local roads and scarcer public transit systems.
Infrastructure
Type
North Coast
Anaheim
TV stations
2
6
Culture and Food
In Anaheim, you're at the heart of Southern California's bustling cultural scene, with a mix of food from around the globe. The North Coast offers a more laid-back vibe with local wineries, distilleries, and fresh seafood.
Sports Teams
Anaheim is home to several sports teams, like the Anaheim Ducks and the Los Angeles Angels. While the North Coast doesn't have major sports teams, outdoor activities and sports are popular pastimes.
 North Coast, CA
 Anaheim, CA