If you are considering North Coast, CA, and Bellflower, CA as your next living or tourist destination, various factors should be evaluated. Both have unique offerings in terms of crime and safety, weather patterns, costs of living, education systems, work and economic prospects, infrastructures, industries, major employers, real estate markets, neighborhood characteristics, transportation options, tax systems, cultural scenes, sports teams, geographies, and healthcare services. Although both are in California, their contrasts could influence your decision enormously.
Bellflower has a higher crime rate compared to the national average, whereas the North Coast is typically safer with crime rates significantly lower than the national average. In terms of personal safety, both communities have reliable law enforcement agencies, but North Coast's smaller population contributes to its securer environment. Tourists are generally safe in both cities, with local law enforcement agencies maintaining a robust presence throughout.
Cost of Living
Cost of living varies significantly between these two cities. Life in Bellflower is comparatively affordable with a cost of living lower than the California average, particularly house prices. In contrast, the North Coast tends to be pricier due to its natural beauty and coastal location, making it more suitable for those with a larger budget.
Income Tax
Both North Coast and Bellflower follow California's progressive income tax system, with rates ranging from 1% to 13.3%.
Property Tax
Property tax in California is assessed at the county level, with Bellflower and North Coast adhering to similar rates, typically around 1% of a property's assessed value.
Sales Tax
California sales tax applies to both cities, currently set at 7.25%. Local municipalities can add their own local taxes which can bring total sales tax in certain areas to around 9.50%. Specific local tax rates should be verified at the desired locality.
Income
Type
North Coast
Bellflower
Estimated median household income
$102,807
$67,909
Estimated per capita income
$50,809
$26,912
Cost of living index (U.S. average is 100)
96.1
140.4
If you make $50,000 in North Coast, you will have to make $73,049 in Bellflower to maintain the same standard of living.
Geographical Conditions
North Coast offers breathtaking ocean views, cliffs, redwood forests, and wineries, providing ample outdoor recreation opportunities. Bellflower, in contrast, is characterized by an urban setting, but with convenient access to beaches, parks, and hiking trails in the greater LA region.
Geographical information
Type
North Coast
Bellflower
Land area
59.4 sq. miles
6.1 sq. miles
Population density
6,335.5 people per sq. mile
12,745 people per sq. mile
Relative area comparison
North Coast, CA Bellflower, CA
Education
Both North Coast and Bellflower provide quality education. North Coast hosts a number of prestigious universities and research institutions, attracting students worldwide. Bellflower's education system includes high-ranking public and private schools, with a constant focus on educational improvement noticeable in their academic performance results.
Bellflower's economy is built around retail trade, healthcare, and social assistance. In contrast, North Coast's economy is primarily focused on tourism, agriculture, and fishing. Both areas offer employment opportunities, yet North Coast's economic sectors are seasonally dependent.
Biggest Employers
Bellflower's biggest employers include Kaiser Permanente and Bellflower Medical Center. Meanwhile, North Coast has a wide range of employers in the hospitality industry such as hotels and restaurants as well as wineries, given its touristic and agricultural nature.
In North Coast (Orange County), 45.8% voted for Democrats and 52.0% for Republicans in 2012 Presidential Election. In Bellflower (Los Angeles County), 69.7% voted for Democrats and 27.8% for Republicans.
Elections
Type
Democrats
Republicans
Other
Year
North Coast
Bellflower
North Coast
Bellflower
North Coast
Bellflower
2020
53.6%
71.0%
44.6%
26.9%
1.8%
2.1%
2016
50.9%
72.0%
42.4%
22.5%
6.7%
5.5%
2012
45.8%
69.7%
52.0%
27.8%
2.3%
2.4%
2008
47.8%
69.2%
50.3%
28.8%
1.9%
1.9%
2004
39.3%
63.3%
60.2%
35.7%
0.5%
1.0%
2000
40.4%
63.6%
55.9%
32.4%
3.7%
4.0%
1996
37.9%
59.3%
51.7%
31.0%
10.5%
9.7%
Breakdown of population affiliated with a religious congregation
Type
Adherents
Congregations
Religion
North Coast
Bellflower
North Coast
Bellflower
CATHOLIC CHURCH
26.5%
36.1%
4.4%
4.7%
SOUTHERN BAPTIST CONVENTION
2.3%
1.0%
8.8%
9.0%
MUSLIM ESTIMATE
0.8%
0.7%
1.3%
1.0%
LUTHERAN CHURCH
0.6%
0.2%
2.0%
1.6%
EPISCOPAL CHURCH
0.4%
0.4%
1.4%
1.4%
EVANGELICAL LUTHERAN CHURCH IN AMERICA
0.4%
0.2%
2.3%
1.9%
SEVENTH DAY ADVENTIST CHURCH
0.4%
0.5%
1.3%
2.4%
REFORMED CHURCH IN AMERICA
0.3%
0.1%
0.2%
0.2%
AMERICAN BAPTIST CHURCHES IN THE USA
0.2%
0.5%
1.7%
3.1%
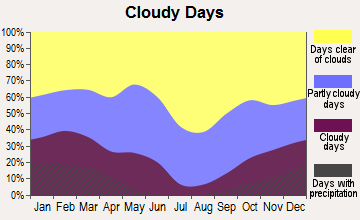
Weather
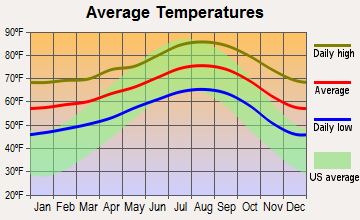
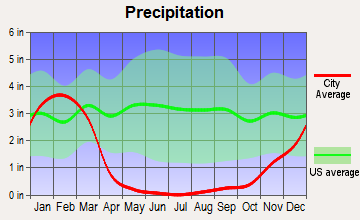
Climate-wise, the North Coast has mild temperatures most of the year with plenty of rainy days. It tends to be cooler and foggier due to its proximity to the Pacific Ocean. Contrarily, Bellflower enjoys a Mediterranean climate with warm summers and mild winters proving a draw for many residents and tourists alike.
Weather and climate
Type
North Coast
Bellflower
Temperature - Average
64.4°F
66°F
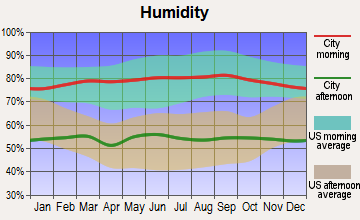
Humidity - Average morning or afternoon humidity
70.2%
70%
Humidity - Differences between morning and afternoon humidity
26.7%
26.5%
Humidity - Maximum monthly morning or afternoon humidity
78.7%
78.5%
Humidity - Minimum monthly morning or afternoon humidity
52%
52%
Precipitation - Yearly average
13 in
14.8 in
Snowfall - Yearly average
0 in
0 in
Clouds - Number of days clear of clouds
26.5%
26.5%
Sunshine amount - Average
78.4%
78.4%
Sunshine amount - Differences during a year
21.9%
22%
Sunshine amount - Maximum monthly
84.9%
85%
Sunshine amount - Minimum monthly
62.9%
63%
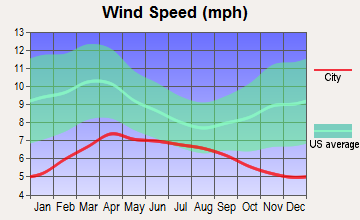
Wind speed - Average
6 mph
5.9 mph
Average climate in North Coast, California
Average climate in Bellflower, California
Air pollution
Type
AQI
CO
NO2
OZONE
PB
PM10
PM25
SO2
Year
North Coast
Bellflower
North Coast
Bellflower
North Coast
Bellflower
North Coast
Bellflower
North Coast
Bellflower
North Coast
Bellflower
North Coast
Bellflower
North Coast
Bellflower
2018
119
140
0.35
0.42
14.4
14.9
26.1
25.0
N/A
0.008
27.5
27.1
12.6
13.6
0.7
0.6
2017
116
142
0.34
0.45
13.8
15.8
28.8
25.9
N/A
0.007
26.7
28.0
13.8
14.4
0.5
0.7
2016
102
128
0.33
0.50
12.2
15.5
29.3
25.2
N/A
0.007
24.1
25.3
12.5
12.5
0.2
0.7
2015
106
137
0.32
0.47
13.2
16.5
29.8
26.3
N/A
0.006
25.0
25.9
14.5
14.6
0.2
0.6
2014
110
138
0.29
0.44
12.9
16.1
28.6
25.6
N/A
0.007
26.7
27.8
15.5
15.4
0.4
0.8
2013
107
140
0.34
0.48
13.9
17.4
27.8
25.7
0.003
0.005
29.5
30.7
14.2
14.7
0.3
0.7
2012
103
144
0.30
0.47
12.7
17.4
26.8
24.8
0.004
0.005
28.2
29.8
14.3
14.8
0.1
0.5
2011
109
142
0.31
0.44
14.7
18.6
27.0
23.9
0.006
0.006
27.7
28.5
15.9
16.0
0.7
0.8
2010
102
128
0.33
0.53
14.3
18.7
26.2
21.8
0.011
0.012
23.6
25.2
14.0
13.3
0.6
0.6
2009
118
150
0.35
0.52
15.5
20.7
27.6
23.4
0.009
0.011
24.3
29.9
14.5
14.5
1.1
0.9
2008
124
152
0.39
0.52
16.5
23.9
28.2
21.8
0.010
0.012
29.5
29.8
21.6
18.3
1.1
0.9
2007
100
128
0.36
0.53
16.3
23.4
27.0
21.9
0.012
0.014
N/A
N/A
N/A
N/A
0.8
1.4
2006
114
125
0.40
0.62
17.2
24.4
26.4
23.2
0.007
0.009
N/A
N/A
N/A
N/A
1.3
1.6
2005
95
123
0.39
0.63
17.7
25.7
27.9
21.5
0.012
0.014
N/A
N/A
N/A
N/A
1.3
2.6
2004
119
132
0.50
0.61
19.2
27.2
30.5
23.7
0.014
0.016
N/A
N/A
N/A
N/A
1.6
2.2
2003
122
143
0.64
0.82
21.9
29.2
28.9
20.8
0.030
0.025
N/A
N/A
N/A
N/A
1.1
1.3
2002
106
137
0.65
0.87
22.0
30.7
25.5
20.2
0.018
0.021
N/A
N/A
N/A
N/A
1.8
2.4
2001
116
143
0.73
0.89
22.0
32.0
25.4
18.7
0.033
0.039
N/A
N/A
N/A
N/A
1.5
2.7
2000
125
149
0.80
0.87
24.4
33.7
24.0
17.5
0.027
0.031
N/A
N/A
N/A
N/A
1.9
1.8
Natural disasters
Type
North Coast
Bellflower
Tornado activity compared to U.S. average
18.6%
18.6%
Earthquake activity compared to U.S. average
6,843.6%
6,987.9%
Natural disasters compared to U.S. average
32%
57%
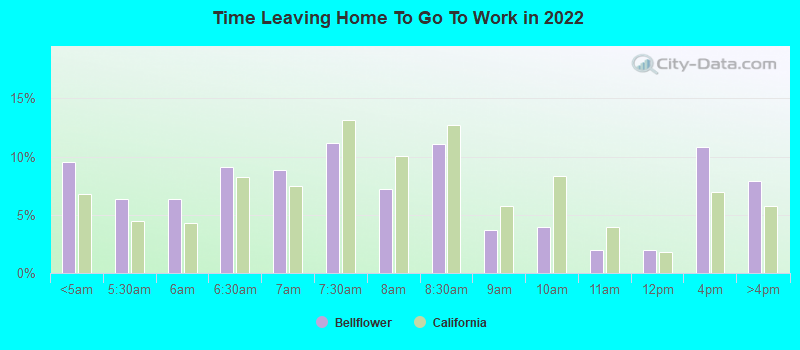
Transportation
Being a more urbanized area, Bellflower has a more developed public transportation system. North Coast, in contrast, has limited public transit, making private commuting a necessity. However, its scenic routes often make driving more enjoyable.
Transport
Type
North Coast
Bellflower
Amtrak stations nearby
3
3
FAA registered aircraft
0
14
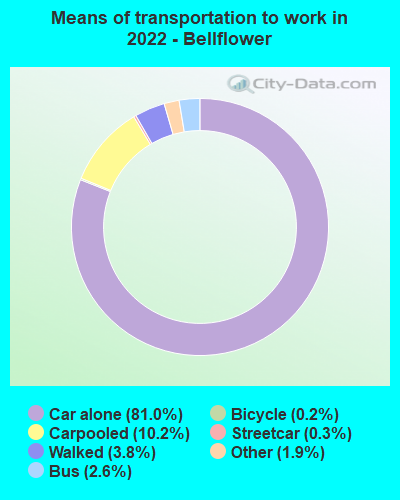
Means of transportation to work
Type
North Coast
Bellflower
Bicycle
0.7%
0.2%
Bus
1.2%
2%
Carpooled
10.7%
10.7%
Car alone
81.4%
81.2%
Motorcycle
0.2%
0.2%
Railroad
0%
0.4%
Streetcar
0%
0.3%
Subway
0%
0.3%
Taxicab
0%
0.2%
Walked
1.4%
4%
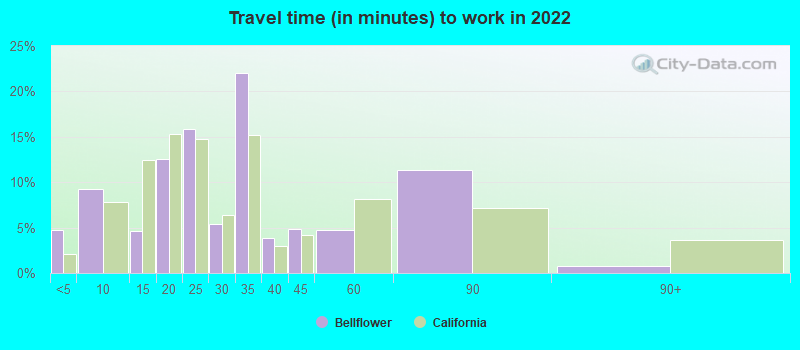
Average travel time to work
Type
North Coast
Bellflower
Average
28.8 min
28.2 min
Real Estate
Real estate is significantly costlier on the North Coast due to its coastal location and scenic beauty. Bellflower, on the other hand, offers more affordable housing options, making it a more accessible choice for many people moving to or within California.
Neighborhoods
Bellflower neighborhoods are characterized by urban-suburban mix feel with a variety of houses, condos, and apartments. Contrarily, the North Coast offers a blend of urban and rural communities, with picturesque small towns nestled amongst expansive wilderness areas.
Houses and residents
Type
North Coast
Bellflower
Houses
137,450
24,831
Average household size (people)
2.7
3.2
Houses occupied
133,254 (96.9%)
24,327 (98%)
Houses occupied by owners
84,546 (63.4%)
8,958 (36.8%)
Houses occupied by renters
48,708 (36.6%)
15,369 (63.2%)
Median rent asked for vacant for-rent units
$2,340
$1,743
Median price asked for vacant for-sale houses and condos
$1,099,558
$450,541
Estimated median house or condo value
$883,291
$595,800
Median number of rooms in apartments
3.9
3.9
Median number of rooms in houses and condos
6.1
5.4
Renting percentage
37.7%
60%
Housing density (houses/condos per square mile)
2,312.7
4,088.5
Household income disparities
41.2%
41.2%
Housing units without a mortgage
13,396 (19.5%)
64 (1%)
Housing units with both a second mortgage and home equity loan
282 (0.4%)
332 (5.3%)
Housing units with a mortgage
55,188 (80.5%)
6,221 (99%)
Housing units with a home equity loan
6,297 (9.2%)
6 (0.1%)
Housing units with a second mortgage
7,643 (11.1%)
432 (6.9%)
Housing units lacking complete kitchen facilities
1%
3.3%
Housing units lacking complete plumbing facilities
Self-employed workers in own not incorporated business
15,532
2,748
State government workers
5,751
1,781
Unpaid family workers
744
250
Industries and Occupations
In Bellflower, the healthcare industry is one of the largest employers, creating numerous jobs in different occupational fields. For North Coast, its principal industries include tourism and agriculture, offering a range of opportunities primarily in these sectors.
Both North Coast and Bellflower provide quality healthcare facilities. While Bellflower residents benefit from larger, more renowned hospitals, North Coast's smaller communities are served by reliable, albeit smaller, healthcare centers.
Health (county statistics)
Type
North Coast
Bellflower
General health status score of residents in this county from 1 (poor) to 5 (excellent)
Bellflower, being a more urbanized area, boasts more developed infrastructure than North Coast, with wider availability of utilities and amenities. North Coast's infrastructure tends to be less developed due to its preserved natural state, contributing to its charm for visitors and residents alike.
Infrastructure
Type
North Coast
Bellflower
TV stations
2
14
Culture and Food
North Coast is renowned for its wineries and vineyards providing gastro-tourism opportunities while Bellflower's food scene variety reflects its culturally diverse population. Both areas have vibrant art scenes with various cultural events held throughout the year.
Sports Teams
Neither North Coast nor Bellflower is home to major sports teams, but being in California, they’re both in proximity to LA's NBA, NFL, and MLB teams, fostering a sports-friendly environment.
 North Coast, CA
 Bellflower, CA