California's North and Central Coasts are both appealing places to live, work, or visit, although they offer different attractions and lifestyles. The North Coast is characterized by its rugged, natural beauty, while the Central Coast boasts a more mild climate and affluent cities like Santa Barbara. Each region has its own unique charm and features, varying from safety, cost of living, culture, sports, healthcare, taxation, industries, and others.
The North Coast generally experiences a lower crime rate compared to Central Coast cities. However, certain areas like Eureka and Arcata in the North Coast have higher crime rates. In the Central Coast, the crime rate is higher in cities like Santa Maria, although affluent cities like Santa Barbara and San Luis Obispo tend to be safer. Tourists and prospective residents should be cautious and aware of their surroundings, particularly in larger cities.
Cost of Living
Living in the Central Coast is generally more expensive, especially in cities like Santa Barbara and San Luis Obispo, with high housing costs contributing significantly to the high cost of living. The region's popularity with tourists and affluent residents drives up costs. The cost of living in the North Coast is relatively lower, but still above the national average, mainly due to California's generally high cost of living.
Income Tax
Income tax rates in California are the same regardless of the region, ranging from 1% to 13.3% based on income level. California has among the highest income tax rates in the country. Therefore, individuals looking to move to either coast should be prepared for these tax rates.
Property Tax
Property tax rates in California are set at the state level and apply uniformly across the state, with a base rate of 1% of assessed value. However, actual payments can vary due to differences in real estate prices. Prospective homeowners in the pricier Central Coast can expect to pay more in property taxes simply due to higher home values.
Sales Tax
Sales tax is similar across both regions, adhering to California's base state sales tax rate of 7.25%. However, local municipalities can add their own taxes, so the actual rate can vary by city. Therefore, regardless of the coast, residents and visitors should anticipate paying a relatively high sales tax compared to other states.
Income
Type
North Coast
Central Coast
Estimated median household income
$102,807
$106,582
Estimated per capita income
$50,809
$70,103
Cost of living index (U.S. average is 100)
96.1
101.8
If you make $50,000 in North Coast, you will have to make $52,966 in Central Coast to maintain the same standard of living.
Geographical Conditions
The North Coast is characterized by its lush greenery, redwood forests, and rugged coastline, making it a haven for nature lovers. The Central Coast, on the other hand, is known for its beautiful beaches, rolling hills, and vineyards, appealing to those who love a mix of beach and countryside.
Geographical information
Type
North Coast
Central Coast
Land area
59.4 sq. miles
50.4 sq. miles
Population density
6,335.5 people per sq. mile
4,732.1 people per sq. mile
Relative area comparison
North Coast, CA Central Coast, CA
Education
Both the North and Central Coasts are home to reputable universities and colleges. In the North Coast, Humboldt State University stands out, whereas the Central Coast boasts the University of California, Santa Barbara, and Cal Poly San Luis Obispo. These institutions contribute to a strong educational climate and provide employment opportunities in the education sector.
The North Coast's economy is largely driven by agriculture, particularly vineyards and organic farms, tourism, and some remnants of timber industry. The Central Coast has a more diverse economy, with education, technology, agriculture, and tourism serving as major contributors. The larger population and more diverse industries in the Central Coast provide more job opportunities.
Biggest Employers
Education and healthcare sectors are notable employers in both regions. In the North Coast, St. Joseph Health System and Humboldt State University are among the top employers. In the Central Coast, the University of California, Santa Barbara and Cottage Health System provide many jobs. Furthermore, the Central Coast area has several tech companies like AppFolio and Yardi Systems.
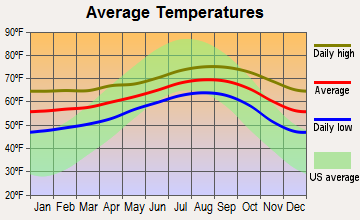
Weather
The North Coast is known for its cooler, foggy weather, heavily influenced by the Pacific Ocean, with average temperatures ranging from 40 to 60 degrees Fahrenheit year-round. However, the Central Coast offers a Mediterranean climate with mild, wet winters and dry summers. The temperature averages from 50 to 70 degrees Fahrenheit, attracting more tourists and potential residents who prefer a warmer climate.
Weather and climate
Type
North Coast
Central Coast
Temperature - Average
64.4°F
62.4°F
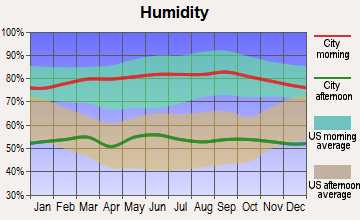
Humidity - Average morning or afternoon humidity
70.2%
69.7%
Humidity - Differences between morning and afternoon humidity
26.7%
26%
Humidity - Maximum monthly morning or afternoon humidity
78.7%
78.1%
Humidity - Minimum monthly morning or afternoon humidity
52%
52%
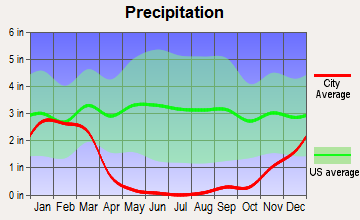
Precipitation - Yearly average
13 in
12.1 in
Snowfall - Yearly average
0 in
0 in
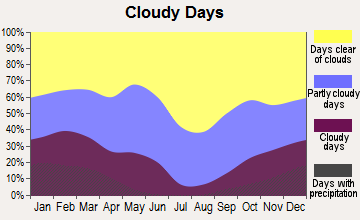
Clouds - Number of days clear of clouds
26.5%
26.6%
Sunshine amount - Average
78.4%
78.3%
Sunshine amount - Differences during a year
21.9%
21.7%
Sunshine amount - Maximum monthly
84.9%
84.4%
Sunshine amount - Minimum monthly
62.9%
62.7%
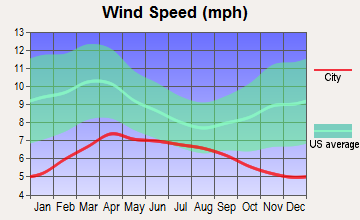
Wind speed - Average
6 mph
5.8 mph
Average climate in North Coast, California
Average climate in Central Coast, California
Air pollution
Type
AQI
CO
NO2
OZONE
PB
PM10
PM25
SO2
Year
North Coast
Central Coast
North Coast
Central Coast
North Coast
Central Coast
North Coast
Central Coast
North Coast
Central Coast
North Coast
Central Coast
North Coast
Central Coast
North Coast
Central Coast
2018
119
119
0.35
0.29
14.4
14.2
26.1
28.9
N/A
N/A
27.5
27.5
12.6
12.6
0.7
0.7
2017
116
116
0.34
0.27
13.8
12.9
28.8
31.6
N/A
N/A
26.7
26.7
13.8
13.8
0.5
0.5
2016
102
102
0.33
0.26
12.2
10.6
29.3
31.2
N/A
N/A
24.1
24.1
12.5
12.5
0.2
0.1
2015
106
106
0.32
0.26
13.2
11.8
29.8
31.8
N/A
N/A
25.0
25.0
14.5
14.5
0.2
0.1
2014
110
109
0.29
0.23
12.9
11.3
28.6
30.2
N/A
N/A
26.7
26.7
15.5
15.6
0.4
0.3
2013
107
107
0.34
0.27
13.9
12.3
27.8
29.3
0.003
0.003
29.5
29.4
14.2
14.1
0.3
0.2
2012
103
103
0.30
0.21
12.7
10.6
26.8
28.0
0.004
0.004
28.2
28.1
14.3
14.4
0.1
0.1
2011
109
109
0.31
0.25
14.7
12.7
27.0
28.2
0.006
0.006
27.7
27.7
15.9
15.9
0.7
0.6
2010
102
102
0.33
0.26
14.3
12.0
26.2
27.6
0.011
0.011
23.6
23.6
14.0
14.1
0.6
0.6
2009
118
118
0.35
0.29
15.5
13.6
27.6
29.2
0.009
0.009
24.3
24.3
14.5
14.5
1.1
1.1
2008
124
124
0.39
0.35
16.5
14.0
28.2
30.1
0.010
0.008
29.5
29.5
21.6
21.6
1.1
1.1
2007
100
100
0.36
0.32
16.3
14.0
27.0
28.5
0.012
0.010
N/A
N/A
N/A
N/A
0.8
0.8
2006
114
109
0.40
0.35
17.2
15.1
26.4
27.2
0.007
0.005
N/A
N/A
N/A
N/A
1.3
1.3
2005
95
91
0.39
0.32
17.7
14.6
27.9
29.4
0.012
0.011
N/A
N/A
N/A
N/A
1.3
1.3
2004
119
118
0.50
0.46
19.2
16.3
30.5
31.5
0.014
0.012
N/A
N/A
N/A
N/A
1.6
1.6
2003
122
116
0.64
0.59
21.9
19.1
28.9
32.5
0.030
0.046
N/A
N/A
N/A
N/A
1.1
1.1
2002
106
103
0.65
0.58
22.0
18.8
25.5
28.2
0.018
0.010
N/A
N/A
N/A
N/A
1.8
1.6
2001
116
109
0.73
0.67
22.0
18.2
25.4
27.8
0.033
0.011
N/A
N/A
N/A
N/A
1.5
1.5
2000
125
116
0.80
0.79
24.4
20.6
24.0
26.0
0.027
0.016
N/A
N/A
N/A
N/A
1.9
1.9
Natural disasters
Type
North Coast
Central Coast
Tornado activity compared to U.S. average
18.6%
18.4%
Earthquake activity compared to U.S. average
6,843.6%
6,801.5%
Natural disasters compared to U.S. average
32%
32%
Transportation
Public transit is more developed and extensive in the Central Coast, with a variety of options including buses, shuttles, and commuter trains. The North Coast relies more on personal automobiles for transportation. However, both regions are served by a series of well-maintained highways and roads, providing beautiful scenic drives along the Pacific coast.
Transport
Type
North Coast
Central Coast
Amtrak stations nearby
3
3
Means of transportation to work
Type
North Coast
Central Coast
Bicycle
0.7%
1.8%
Bus
1.2%
2.4%
Carpooled
10.7%
9%
Car alone
81.4%
75.9%
Motorcycle
0.2%
0.2%
Railroad
0%
0.1%
Walked
1.4%
4.4%
Average travel time to work
Type
North Coast
Central Coast
Average
28.8 min
23.2 min
Real Estate
Real estate in the Central Coast is notably expensive, particularly in desirable coastal cities like Santa Barbara. The North Coast, while still above national averages, offers more affordable housing options, particularly in cities like Eureka.
Neighborhoods
Neighborhoods in the North Coast are generally more rustic, rural, and quieter, with spacious lots in woodland or coastal settings. The Central Coast offers a range of neighborhoods, from beachfront properties in Santa Barbara to urban dwellings in cities like Ventura and San Luis Obispo. There are options for multiple lifestyles and budgets in both regions.
Houses and residents
Type
North Coast
Central Coast
Houses
137,450
96,674
Average household size (people)
2.7
2.4
Houses occupied
133,254 (96.9%)
90,435 (93.5%)
Houses occupied by owners
84,546 (63.4%)
43,559 (48.2%)
Houses occupied by renters
48,708 (36.6%)
46,876 (51.8%)
Median rent asked for vacant for-rent units
$2,340
$2,849
Median price asked for vacant for-sale houses and condos
$1,099,558
$1,099,558
Estimated median house or condo value
$883,291
Over $1,000,000
Median number of rooms in apartments
3.9
3.9
Median number of rooms in houses and condos
6.1
6.1
Renting percentage
37.7%
53.9%
Housing density (houses/condos per square mile)
2,312.7
1,918.7
Household income disparities
41.2%
38.4%
Housing units without a mortgage
13,396 (19.5%)
8,041 (21.3%)
Housing units with both a second mortgage and home equity loan
282 (0.4%)
100 (0.3%)
Housing units with a mortgage
55,188 (80.5%)
29,764 (78.7%)
Housing units with a home equity loan
6,297 (9.2%)
3,303 (8.7%)
Housing units with a second mortgage
7,643 (11.1%)
3,451 (9.1%)
Housing units lacking complete kitchen facilities
1%
0.7%
Housing units lacking complete plumbing facilities
0.5%
0.4%
Housing units in structures
Housing units in structures
North Coast
Central Coast
One, detached
50.7%
38.4%
One, attached
11.8%
16.3%
Two
1.5%
5.0%
3 or 4
8.7%
8.7%
5 to 9
5.6%
5.9%
10 to 19
5.6%
5.3%
20 to 49
2.9%
4.7%
50 or more
8.2%
13.4%
Mobile homes
4.9%
2.0%
Boats, RVs, vans, etc.
0.1%
0.2%
Median real estate property taxes paid for housing units
Self-employed workers in own not incorporated business
15,532
13,281
State government workers
5,751
6,404
Unpaid family workers
744
456
Industries and Occupations
Due to its favorable climate and fertile soil, agriculture, particularly wine-making, is a significant industry in both regions. The North Coast is famous for its organic farms, while the Central Coast is known for its vineyards. Other major occupations include education, due to the presence of universities, and tourism. The Central Coast also has a significant tech industry presence.
Health Care
Healthcare access and quality are good in both regions, with many hospitals and clinics to choose from. The Central Coast has larger medical facilities like Santa Barbara Cottage Hospital, while the North Coast has hospitals like St. Joseph Hospital in Eureka.
Infrastructure
The infrastructure in both regions is well-developed, though the Central Coast generally displays greater wealth and maintenance. The North Coast has a laid-back, rural charm, characterized by small towns and rural roads. Meanwhile, the Central Coast boasts more urbanized cities, with well-maintained highways, public spaces, and amenities.
Infrastructure
Type
North Coast
Central Coast
TV stations
2
2
Culture and Food
Both regions have exciting food scenes strongly influenced by locally sourced ingredients. The North Coast is known for seafood, artisanal cheese, and locally brewed beers while the Central Coast is famous for its wineries and Santa Maria-style BBQ. Culture-wise, the North Coast has an artsy, laid-back vibe symbolized by Redwoods, while the Central Coast is more cosmopolitan with Spanish architecture and cultural festivals.
Sports Teams
While neither the North Coast nor the Central Coast are home to major professional sports teams, there are numerous opportunities for outdoor sports and recreation due to the regions' natural beauty and geographical conditions. Hiking, surfing, and mountain biking are particularly popular.

 North Coast, CA
 Central Coast, CA