North Coast, CA and El Monte, CA are both attractive in their unique ways – offering different benefits for residents and visitors alike. North Coast boasts stunning natural landscapes and a laid-back lifestyle, while El Monte prides itself on its rich cultural diversity and bustling urban life. Herein, we'll compare these two places based on crucial factors like crime and safety, weather, cost of living, education, and work opportunities, among others. How do these two locations stack up against each other? Let's dig deeper.
North Coast has a generally lower crime rate compared to El Monte. This tranquil region, dominated by natural beauty, provides a safer environment which is endearing to both residents and tourists. El Monte, though not hugely unsafe, does experience a slightly higher crime rate, being in a more urbanized area.
Cost of Living
The cost of living in North Coast is generally higher than in El Monte, driven primarily by housing costs. Groceries, health care, and utilities also tend to be more expensive in North Coast. El Monte, being further inland and more urban, offers a more affordable lifestyle.
Income Tax
Both North Coast and El Monte mirror the state's income tax system, with no city-specific income taxes.
Property Tax
Due to higher property values, property taxes in North Coast can be higher than in El Monte. Lower property values in El Monte result in less property tax.
Sales Tax
The sales tax in North Coast is higher than in El Monte due to the higher standard of living. El Monte, however, has a lower sales tax, aligning with its more affordable cost of living.
Income
Type
North Coast
El Monte
Estimated median household income
$102,807
$55,609
Estimated per capita income
$50,809
$21,307
Cost of living index (U.S. average is 100)
96.1
141.8
If you make $50,000 in North Coast, you will have to make $73,777 in El Monte to maintain the same standard of living.
Geographical Conditions
North Coast is renowned for its stunning coastal views, rolling vineyards, and redwood forests, providing an ideal location for nature lovers. In contrast, El Monte is an urbanized city with less focus on natural landscapes but has the advantage of being closer to major city amenities.
Geographical information
Type
North Coast
El Monte
Land area
59.4 sq. miles
9.6 sq. miles
Population density
6,335.5 people per sq. mile
11,191 people per sq. mile
Relative area comparison
North Coast, CA El Monte, CA
Education
Both regions have strong educational systems, though they excel in different areas. North Coast is home to several renowned higher-education institutions, appealing to those seeking quality post-secondary education. El Monte, on the other hand, is noted for its quality K-12 education system, with numerous high-achieving schools.
El Monte has a diverse economy, with major sectors including healthcare, manufacturing, and retail trade. North Coast, dominated by tourism and agriculture, offers unique work opportunities in these areas, which might be less diverse but can be more rewarding for those in specific occupations.
Biggest Employers
In North Coast, the biggest employers are typically in the agriculture and tourism sectors. El Monte, however, boasts a diversity of sectors, with the biggest employers being in healthcare, education, and retail.
In North Coast (Orange County), 45.8% voted for Democrats and 52.0% for Republicans in 2012 Presidential Election. In El Monte (Los Angeles County), 69.7% voted for Democrats and 27.8% for Republicans.
Elections
Type
Democrats
Republicans
Other
Year
North Coast
El Monte
North Coast
El Monte
North Coast
El Monte
2020
53.6%
71.0%
44.6%
26.9%
1.8%
2.1%
2016
50.9%
72.0%
42.4%
22.5%
6.7%
5.5%
2012
45.8%
69.7%
52.0%
27.8%
2.3%
2.4%
2008
47.8%
69.2%
50.3%
28.8%
1.9%
1.9%
2004
39.3%
63.3%
60.2%
35.7%
0.5%
1.0%
2000
40.4%
63.6%
55.9%
32.4%
3.7%
4.0%
1996
37.9%
59.3%
51.7%
31.0%
10.5%
9.7%
Breakdown of population affiliated with a religious congregation
Type
Adherents
Congregations
Religion
North Coast
El Monte
North Coast
El Monte
CATHOLIC CHURCH
26.5%
36.1%
4.4%
4.7%
SOUTHERN BAPTIST CONVENTION
2.3%
1.0%
8.8%
9.0%
MUSLIM ESTIMATE
0.8%
0.7%
1.3%
1.0%
LUTHERAN CHURCH
0.6%
0.2%
2.0%
1.6%
EPISCOPAL CHURCH
0.4%
0.4%
1.4%
1.4%
EVANGELICAL LUTHERAN CHURCH IN AMERICA
0.4%
0.2%
2.3%
1.9%
SEVENTH DAY ADVENTIST CHURCH
0.4%
0.5%
1.3%
2.4%
REFORMED CHURCH IN AMERICA
0.3%
0.1%
0.2%
0.2%
AMERICAN BAPTIST CHURCHES IN THE USA
0.2%
0.5%
1.7%
3.1%
Weather
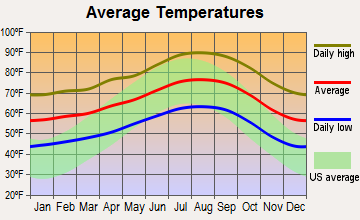
North Coast residents enjoy a cool, Mediterranean climate with mild, wet winters and dry summers. El Monte, though, experiences a warm-summer Mediterranean climate, where long, hot summers are commonplace, making it ideal for those who enjoy warmer weather.
Weather and climate
Type
North Coast
El Monte
Temperature - Average
64.4°F
66.3°F
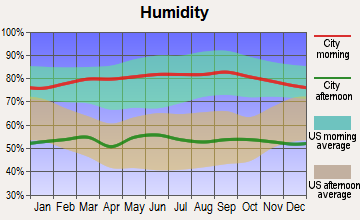
Humidity - Average morning or afternoon humidity
70.2%
62.3%
Humidity - Differences between morning and afternoon humidity
26.7%
17.4%
Humidity - Maximum monthly morning or afternoon humidity
78.7%
67.2%
Humidity - Minimum monthly morning or afternoon humidity
52%
49.8%
Precipitation - Yearly average
13 in
16.4 in
Snowfall - Yearly average
0 in
0 in
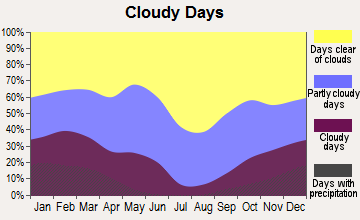
Clouds - Number of days clear of clouds
26.5%
29.3%
Sunshine amount - Average
78.4%
78.4%
Sunshine amount - Differences during a year
21.9%
22%
Sunshine amount - Maximum monthly
84.9%
85%
Sunshine amount - Minimum monthly
62.9%
63%
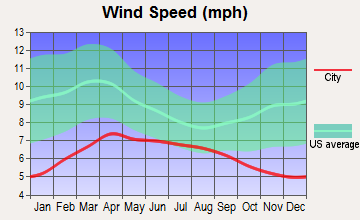
Wind speed - Average
6 mph
2.7 mph
Average climate in North Coast, California
Average climate in El Monte, California
Air pollution
Type
AQI
CO
NO2
OZONE
PB
PM10
PM25
SO2
Year
North Coast
El Monte
North Coast
El Monte
North Coast
El Monte
North Coast
El Monte
North Coast
El Monte
North Coast
El Monte
North Coast
El Monte
North Coast
El Monte
2018
119
142
0.35
0.37
14.4
14.1
26.1
28.0
N/A
0.007
27.5
28.4
12.6
14.1
0.7
0.4
2017
116
146
0.34
0.37
13.8
15.0
28.8
29.2
N/A
0.007
26.7
30.9
13.8
14.2
0.5
0.5
2016
102
136
0.33
0.34
12.2
15.4
29.3
27.8
N/A
0.007
24.1
28.1
12.5
13.2
0.2
0.4
2015
106
144
0.32
0.34
13.2
15.2
29.8
28.2
N/A
0.006
25.0
28.1
14.5
15.3
0.2
0.3
2014
110
141
0.29
0.37
12.9
16.5
28.6
27.7
N/A
0.007
26.7
30.8
15.5
15.3
0.4
0.4
2013
107
144
0.34
0.40
13.9
17.2
27.8
26.3
0.003
0.007
29.5
29.3
14.2
14.7
0.3
0.4
2012
103
148
0.30
0.43
12.7
18.1
26.8
25.8
0.004
0.006
28.2
28.6
14.3
16.6
0.1
0.5
2011
109
146
0.31
0.46
14.7
18.8
27.0
24.8
0.006
0.008
27.7
29.0
15.9
17.5
0.7
0.5
2010
102
133
0.33
0.48
14.3
19.1
26.2
24.4
0.011
0.013
23.6
27.2
14.0
15.5
0.6
0.5
2009
118
153
0.35
0.41
15.5
20.9
27.6
25.3
0.009
0.010
24.3
32.3
14.5
17.2
1.1
0.6
2008
124
155
0.39
0.53
16.5
23.0
28.2
24.7
0.010
0.013
29.5
32.6
21.6
17.1
1.1
0.7
2007
100
135
0.36
0.55
16.3
24.3
27.0
23.1
0.012
0.015
N/A
N/A
N/A
N/A
0.8
1.2
2006
114
129
0.40
0.58
17.2
24.6
26.4
23.0
0.007
0.009
N/A
N/A
N/A
N/A
1.3
1.6
2005
95
128
0.39
0.60
17.7
25.8
27.9
21.1
0.012
0.014
N/A
N/A
N/A
N/A
1.3
2.3
2004
119
135
0.50
0.70
19.2
27.1
30.5
22.8
0.014
0.017
N/A
N/A
N/A
N/A
1.6
2.4
2003
122
143
0.64
0.88
21.9
31.7
28.9
22.3
0.030
0.025
N/A
N/A
N/A
N/A
1.1
1.6
2002
106
137
0.65
0.90
22.0
32.7
25.5
20.8
0.018
0.022
N/A
N/A
N/A
N/A
1.8
2.3
2001
116
143
0.73
1.03
22.0
33.5
25.4
19.0
0.033
0.033
N/A
N/A
N/A
N/A
1.5
2.4
2000
125
151
0.80
1.06
24.4
34.3
24.0
19.2
0.027
0.029
N/A
N/A
N/A
N/A
1.9
1.3
Natural disasters
Type
North Coast
El Monte
Tornado activity compared to U.S. average
18.6%
18.3%
Earthquake activity compared to U.S. average
6,843.6%
7,229.8%
Natural disasters compared to U.S. average
32%
57%
Transportation
Public transit is more prevalent and well-structured in El Monte, providing easier commuting options for residents. North Coast, while having fewer commuting options, offers an idyllic, less congested traffic experience.
Transport
Type
North Coast
El Monte
Amtrak stations nearby
3
3
FAA registered aircraft
0
34
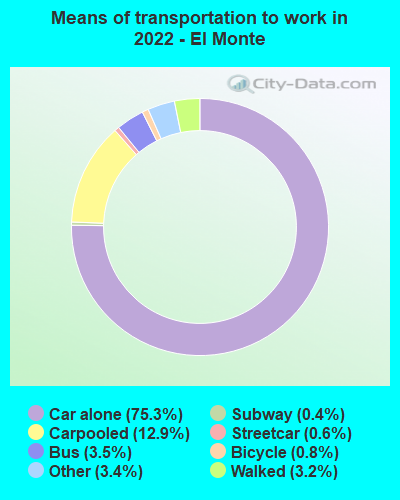
Means of transportation to work
Type
North Coast
El Monte
Bicycle
0.7%
1.3%
Bus
1.2%
3%
Carpooled
10.7%
11.5%
Car alone
81.4%
79.6%
Motorcycle
0.2%
0.1%
Streetcar
0%
0.4%
Subway
0%
0.3%
Taxicab
0%
0.3%
Walked
1.4%
2%
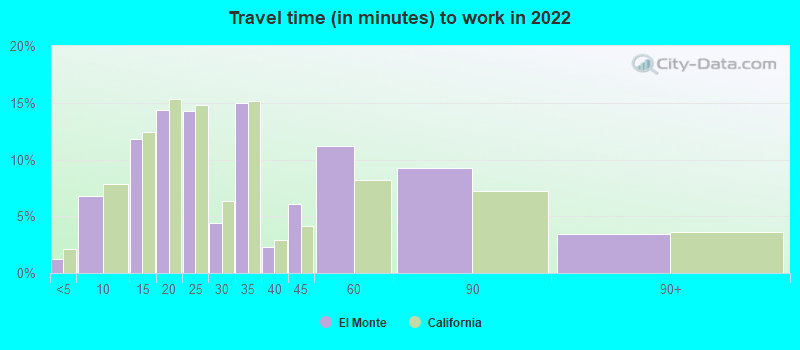
Average travel time to work
Type
North Coast
El Monte
Average
28.8 min
29.6 min
Real Estate
Real estate in North Coast is generally more expensive due to its picturesque landscape and high demand, resulting in higher property values. El Monte offers more affordable housing options, with real estate prices significantly less than those in coastal areas.
Neighborhoods
North Coast neighborhoods are known for their breathtaking views and tranquil settings, making them highly appealing. El Monte offers diverse, vibrant neighborhoods with a variety of ethnic and cultural backgrounds.
Houses and residents
Type
North Coast
El Monte
Houses
137,450
29,935
Average household size (people)
2.7
4
Houses occupied
133,254 (96.9%)
29,036 (97%)
Houses occupied by owners
84,546 (63.4%)
10,998 (37.9%)
Houses occupied by renters
48,708 (36.6%)
18,038 (62.1%)
Median rent asked for vacant for-rent units
$2,340
$1,418
Median price asked for vacant for-sale houses and condos
$1,099,558
$520,221
Estimated median house or condo value
$883,291
$566,600
Median number of rooms in apartments
3.9
4
Median number of rooms in houses and condos
6.1
5.2
Renting percentage
37.7%
57.8%
Housing density (houses/condos per square mile)
2,312.7
3,133.7
Household income disparities
41.2%
42.9%
Housing units without a mortgage
13,396 (19.5%)
370 (5.4%)
Housing units with both a second mortgage and home equity loan
282 (0.4%)
94 (1.4%)
Housing units with a mortgage
55,188 (80.5%)
6,442 (94.6%)
Housing units with a home equity loan
6,297 (9.2%)
122 (1.8%)
Housing units with a second mortgage
7,643 (11.1%)
416 (6.1%)
Housing units lacking complete kitchen facilities
1%
2.9%
Housing units lacking complete plumbing facilities
Self-employed workers in own not incorporated business
15,532
3,900
State government workers
5,751
1,314
Unpaid family workers
744
60
Industries and Occupations
Tourism and agriculture dominate North Coast's economy; occupations centered on these industries are abundant. El Monte, in contrast, has a broader range of occupations due to its diversified economy, with health care, education and manufacturing industries dominating.
Both regions provide good health care facilities. However, El Monte, with its larger population and urban setting, presents more comprehensive services.
Health (county statistics)
Type
North Coast
El Monte
General health status score of residents in this county from 1 (poor) to 5 (excellent)
El Monte's infrastructure is more developed and urbanized, offering extensive public services and amenities. North Coast, although less developed, has the advantage of preserving natural landscapes and pristine coastal areas, offering a striking balance between development and nature.
Infrastructure
Type
North Coast
El Monte
TV stations
2
26
Culture and Food
El Monte thrives on a rich mix of cultures with diverse food scenes, festivals and cultural events. North Coast, while having fewer cultural communities, is known for its exquisite wine culture and seafood cuisine.
Sports Teams
While El Monte has no major professional sports teams, its vicinity to Los Angeles gives residents easy access to various sports events. North Coast, on the other hand, benefits from its outdoor offerings, making water sports, hiking, and biking prevalent.
 North Coast, CA
 El Monte, CA