Pitting the serene beauty of North Coast against the suburban charm of El Toro, we're diving into a comprehensive comparison of these two Californian cities. This analysis will cover crime/safety, weather, cost of living, taxes, infrastructure, industry and employment, real estate, neighborhoods, public transportation, culture, sports, geographical conditions, and healthcare. Whether you're considering relocating or visiting as a tourist, this guide shines a light on what to expect from each location.
North Coast possesses a higher crime rate compared to El Toro. However, this can vary depending on the specific area within North Coast. El Toro, being part of the larger Lake Forest city, benefits from a well-coordinated police department and boasts a safer environment. However, both locations prioritize public safety and have proactive law enforcement agencies.
Cost of Living
Cost of living in North Coast, particularly in area like Mendocino County, is relatively higher due to its popular coastal location and tourist appeal. El Toro, although located in the pricey Orange County, offers a more affordable living cost compared to North Coast, making it a popular choice for families.
Income Tax
Regarding income tax, both North Coast and El Toro comply with California's progressive income tax system. However, local tax implications may apply based on specific income categories and municipal laws.
Property Tax
Property taxes in North Coast are typically higher due to valuable coastal real estate. Conversely, El Toro has relatively lower property taxes, compatible with Orange County averages.
Sales Tax
California's state sales tax applies to both locales, but each city can introduce additional local sales taxes. The total sales tax rate in North Coast can vary by city, while El Toro receives a rate typical of Orange County cities.
Income
Type
North Coast
El Toro
Estimated median household income
$102,807
$132,724
Estimated per capita income
$50,809
$60,371
Cost of living index (U.S. average is 100)
96.1
95
If you make $50,000 in El Toro, you will have to make $50,579 in North Coast to maintain the same standard of living.
Geographical Conditions
North Coast is a picturesque region marked by rugged coastlines, dense forests, and overall stunning natural beauty. Contrastingly, El Toro offers a suburban landscape nestled amidst nature with close proximity to various parks and wilderness areas.
Geographical information
Type
North Coast
El Toro
Land area
59.4 sq. miles
74.2 sq. miles
Population density
6,335.5 people per sq. mile
2,412 people per sq. mile
Relative area comparison
North Coast, CA El Toro, CA
Education
Both North Coast and El Toro have robust education systems. North Coast is known for its focus on arts education, while El Toro is home to some well-ranked schools as part of the Saddleback Valley Unified School District, making it a great place for families.
North Coast's economy heavily revolves around tourism and agriculture. Conversely, El Toro has a diverse economy with industries spanning healthcare, technology, and professional services. Job growth and opportunities in El Toro tend to be more versatile.
Biggest Employers
In North Coast, large employers include wineries and farming corporations. For El Toro, big employers include Panasonic Avionics, loanDepot, and Oakley Inc., stemming from its diverse industry base.
Weather
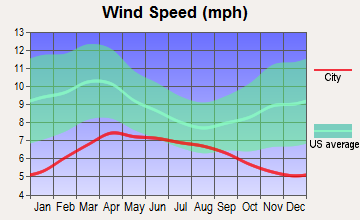
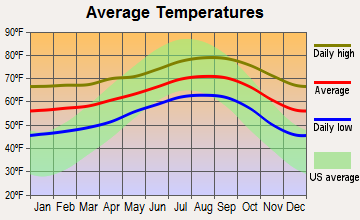
The weather in both North Coast and El Toro is quintessential California – mild winters and warm summers. North Coast experiences more rainfall and cooler temperatures being situated along the Pacific Coast. El Toro sees less rainfall and warmer summers given its inland location.
Weather and climate
Type
North Coast
El Toro
Temperature - Average
64.4°F
63.3°F
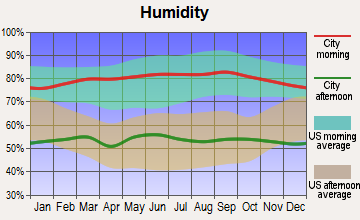
Humidity - Average morning or afternoon humidity
70.2%
68.9%
Humidity - Differences between morning and afternoon humidity
26.7%
24.8%
Humidity - Maximum monthly morning or afternoon humidity
78.7%
76.8%
Humidity - Minimum monthly morning or afternoon humidity
52%
52.1%
Precipitation - Yearly average
13 in
13.1 in
Snowfall - Yearly average
0 in
0 in
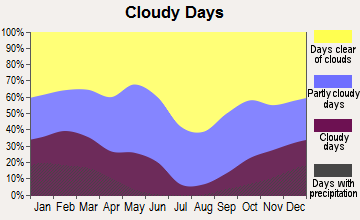
Clouds - Number of days clear of clouds
26.5%
26.7%
Sunshine amount - Average
78.4%
78.2%
Sunshine amount - Differences during a year
21.9%
21.7%
Sunshine amount - Maximum monthly
84.9%
84.3%
Sunshine amount - Minimum monthly
62.9%
62.6%
Wind speed - Average
6 mph
5.4 mph
Average climate in North Coast, California
Average climate in El Toro, California
Air pollution
Type
AQI
CO
NO2
OZONE
PB
PM10
PM25
SO2
Year
North Coast
El Toro
North Coast
El Toro
North Coast
El Toro
North Coast
El Toro
North Coast
North Coast
El Toro
North Coast
El Toro
North Coast
El Toro
2018
119
121
0.35
0.23
14.4
12.5
26.1
32.7
N/A
N/A
27.5
25.4
12.6
10.7
0.7
N/A
2017
116
123
0.34
0.25
13.8
12.3
28.8
33.4
N/A
N/A
26.7
25.7
13.8
12.9
0.5
N/A
2016
102
112
0.33
0.19
12.2
11.7
29.3
32.6
N/A
N/A
24.1
23.5
12.5
12.0
0.2
0.1
2015
106
123
0.32
0.16
13.2
12.4
29.8
31.8
N/A
N/A
25.0
23.5
14.5
13.7
0.2
0.1
2014
110
109
0.29
0.15
12.9
12.2
28.6
30.6
N/A
N/A
26.7
26.3
15.5
15.0
0.4
0.3
2013
107
110
0.34
0.21
13.9
12.7
27.8
29.2
0.003
N/A
29.5
27.2
14.2
12.9
0.3
0.2
2012
103
114
0.30
0.28
12.7
12.1
26.8
28.9
0.004
N/A
28.2
25.5
14.3
13.6
0.1
0.1
2011
109
129
0.31
0.19
14.7
13.3
27.0
29.5
0.006
N/A
27.7
26.5
15.9
14.5
0.7
0.3
2010
102
114
0.33
0.25
14.3
13.1
26.2
29.7
0.011
N/A
23.6
23.6
14.0
14.0
0.6
0.6
2009
118
134
0.35
0.20
15.5
15.2
27.6
30.4
0.009
N/A
24.3
25.2
14.5
14.6
1.1
1.1
2008
124
142
0.39
0.29
16.5
15.9
28.2
30.8
0.010
N/A
29.5
33.3
21.6
14.5
1.1
1.1
2007
100
116
0.36
0.27
16.3
16.0
27.0
29.7
0.012
N/A
N/A
N/A
N/A
N/A
0.8
0.8
2006
114
115
0.40
0.33
17.2
16.8
26.4
29.6
0.007
N/A
N/A
N/A
N/A
N/A
1.3
1.3
2005
95
113
0.39
0.31
17.7
16.9
27.9
29.4
0.012
N/A
N/A
N/A
N/A
N/A
1.3
1.3
2004
119
134
0.50
0.35
19.2
17.9
30.5
32.3
0.014
N/A
N/A
N/A
N/A
N/A
1.6
1.6
2003
122
133
0.64
0.44
21.9
20.9
28.9
30.2
0.030
N/A
N/A
N/A
N/A
N/A
1.1
1.1
2002
106
130
0.65
0.46
22.0
20.3
25.5
27.1
0.018
N/A
N/A
N/A
N/A
N/A
1.8
1.6
2001
116
140
0.73
0.57
22.0
20.5
25.4
27.0
0.033
N/A
N/A
N/A
N/A
N/A
1.5
1.4
2000
125
140
0.80
0.48
24.4
23.3
24.0
23.1
0.027
N/A
N/A
N/A
N/A
N/A
1.9
1.9
Natural disasters
Type
North Coast
El Toro
Tornado activity compared to U.S. average
18.6%
18.6%
Earthquake activity compared to U.S. average
6,843.6%
6,916.9%
Natural disasters compared to U.S. average
32%
32%
Transportation
Public transportation in North Coast is not as robust compared to urban locales, making car dependency a norm. El Toro, however, provides various commuting options through Orange County Transport Authority, complemented by an excellent network of roads and highways.
Transport
Type
North Coast
El Toro
Amtrak stations nearby
3
3
Means of transportation to work
Type
North Coast
El Toro
Bicycle
0.7%
0.3%
Bus
1.2%
0.5%
Carpooled
10.7%
9.7%
Car alone
81.4%
83.4%
Motorcycle
0.2%
0.2%
Railroad
0%
0.2%
Walked
1.4%
0.6%
Average travel time to work
Type
North Coast
El Toro
Average
28.8 min
25.6 min
Real Estate
The real estate market in North Coast is quite expensive due to its scenic coastal properties. In contrast, El Toro offers more affordable housing options with a suburban allure.
Neighborhoods
Neighborhoods in North Coast range from serene coastal towns to rural farmlands. El Toro, on the other hand, has a suburban feel with family-friendly communities and a peaceful atmosphere.
Houses and residents
Type
North Coast
El Toro
Houses
137,450
65,041
Average household size (people)
2.7
2.8
Houses occupied
133,254 (96.9%)
61,855 (95.1%)
Houses occupied by owners
84,546 (63.4%)
42,038 (68%)
Houses occupied by renters
48,708 (36.6%)
19,817 (32%)
Median rent asked for vacant for-rent units
$2,340
$3,113
Median price asked for vacant for-sale houses and condos
$1,099,558
$1,099,558
Estimated median house or condo value
$883,291
$956,652
Median number of rooms in apartments
3.9
3.9
Median number of rooms in houses and condos
6.1
6.1
Housing density (houses/condos per square mile)
2,312.7
876.6
Household income disparities
41.2%
35%
Housing units without a mortgage
13,396 (19.5%)
2,867 (7.8%)
Housing units with both a second mortgage and home equity loan
282 (0.4%)
154 (0.4%)
Housing units with a mortgage
55,188 (80.5%)
33,957 (92.2%)
Housing units with a home equity loan
6,297 (9.2%)
3,730 (10.1%)
Housing units with a second mortgage
7,643 (11.1%)
4,895 (13.3%)
Housing units lacking complete kitchen facilities
1%
0.3%
Housing units lacking complete plumbing facilities
0.5%
0.4%
Housing units in structures
Housing units in structures
North Coast
El Toro
One, detached
50.7%
49.4%
One, attached
11.8%
20.0%
Two
1.5%
0.6%
3 or 4
8.7%
5.3%
5 to 9
5.6%
9.1%
10 to 19
5.6%
3.7%
20 to 49
2.9%
1.9%
50 or more
8.2%
7.7%
Mobile homes
4.9%
2.3%
Boats, RVs, vans, etc.
0.1%
0.0%
Median real estate property taxes paid for housing units
Self-employed workers in own not incorporated business
15,532
7,511
State government workers
5,751
2,809
Unpaid family workers
744
330
Industries and Occupations
Agriculture, tourism, and wine production dominate the North Coast economy. In contrast, El Toro supports diverse industries including healthcare, retail, technology, and services. Multiple corporate headquarters are present, offering a wide range of job opportunities.
Health Care
While both North Coast and El Toro provide quality healthcare facilities, El Toro edges out with more comprehensive healthcare services, thanks to the proximity to larger urban centers.
Infrastructure
North Coast, spread across various smaller towns and cities, has varied infrastructure quality. Some areas are well developed whereas others maintain a rural charm. El Toro, being part of Lake Forest city, features modern and robust infrastructure facilities.
Infrastructure
Type
North Coast
El Toro
TV stations
2
2
Nuclear power plants nearby
0
2
Culture and Food
North Coast flourishes in a vibrant arts scene and superb wine culture. Dining options range from farm-to-table restaurants to exquisite seafood. El Toro, in contrast, has a diverse culinary scene reflecting the cultural melting pot of Southern California.
Sports Teams
Neither North Coast nor El Toro hosts major sports franchises. However, El Toro residents can easily access sports events in nearby Los Angeles or Anaheim.
 North Coast, CA
 El Toro, CA