Relative area comparison
 North Coast, CA
 Palos Verdes, CA
Overview
North Coast, California, a laid-back coastal region known for its wine production and gorgeous landscapes, lies to the north of San Francisco. Palos Verdes, located in Southern California, is a picturesque peninsula boasting upscale neighborhoods and excellent school systems. While North Coast offers a higher cost of living compared to the national average, it boasts lower rates than Palos Verdes. Each location has unique offerings making it attractive for diverse groups of people considering relocation or a leisure visit. Here's how they measure up across various facets of life.
 North Coast, CA and
Palos Verdes, CA : 19.4 miles
North Coast, CA and
Palos Verdes, CA : 19.4 miles
North Coast's population is larger by 311%.
| Population | ||
| Type | North Coast | Palos Verdes |
|---|---|---|
| Population | 376,527 | 91,593 |
| Female / male percentage | 50.5% / 49.5%
|
51.5% / 48.5%
|
Both North Coast and Palos Verdes are generally safe areas in California. North Coast has a lower crime rate than the national average, and most cities in the region have active community policing programs. On the other hand, Palos Verdes is known for its low crime rate, with several areas notably safer than their counterparts in the broader Los Angeles County.
The cost of living is relatively high in both locations, which goes along with the high standard of living. However, Palos Verdes, as part of LA county, has a much higher cost of living including housing, utilities, and transportation compared to North Coast.
Income tax rates for both the North Coast and Palos Verdes fall under California's state income tax rates, which are some of the highest in the nation.
Property taxes are significant in both regions due to the high real estate values. However, property tax rates in Palos Verdes are higher due to the exceptional value of its real estate.
The city and state sales tax in North Coast vary by county, but they generally align with California's average sales tax. Palos Verdes, being within Los Angeles County, has a slightly higher sales tax.
| Income | ||
| Type | North Coast | Palos Verdes |
|---|---|---|
| Estimated median household income | $102,807 | $150,366 |
| Estimated per capita income | $50,809 | $83,925 |
| Cost of living index (U.S. average is 100) | 96.1 | 186.7 |
If you make $50,000 in North Coast, you will have to make $97,138 in Palos Verdes to maintain the same standard of living.
North Coast, characterized by rolling hills and fertile valleys, is ideal for outdoor activities. Palos Verdes is a peninsula with stunning coastal cliffs, beautiful beaches, and expansive ocean views.
| Geographical information | ||
| Type | North Coast | Palos Verdes |
|---|---|---|
| Land area | 59.4 sq. miles | 159.4 sq. miles |
| Population density | 6,335.5 people per sq. mile | 574.5 people per sq. mile |
North Coast, CA
Palos Verdes, CA
Both regions offer excellent education options. North Coast is served by several school districts and a community college. Palos Verdes Peninsula Unified School District is highly rated and boasts one of the highest graduation rates in California.
| Education level (25-year-olds and older) | ||
| Type | North Coast | Palos Verdes |
|---|---|---|
| Bachelor's degree or higher | 31.4% | 51.5% |
| Graduate or professional degree | 10.4% | 22.4% |
| High school or higher | 84.9% | 92.2% |
North Coast has an economy primarily based on agriculture (especially wine production), tourism, and some manufacturing. Palos Verdes, on the other hand, forms part of the greater Los Angeles economy, with numerous opportunities in entertainment, tech, and other industries.
The biggest employers in North Coast are typically within the agriculture, viticulture, and tourism industries. In Palos Verdes, some of the largest employers include the Los Angeles Unified School District, UCLA, and numerous technology and entertainment companies.
In North Coast (Orange County), 45.8% voted for Democrats and 52.0% for Republicans in 2012 Presidential Election. In Palos Verdes (Los Angeles County), 69.7% voted for Democrats and 27.8% for Republicans.
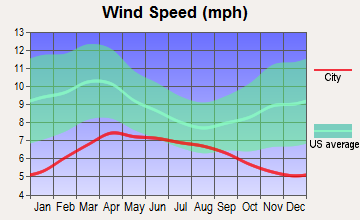
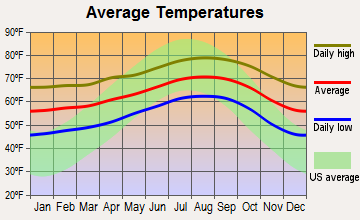
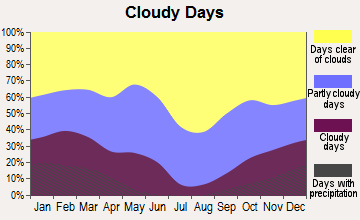
The weather in both regions differs significantly due to their geographic positions. North Coast has a Mediterranean climate with a cooler, wetter winter and a warm, dry summer. Palos Verdes enjoys a mild, Mediterranean climate year-round with temperatures rarely dropping below 50 degrees or above 100.
| Weather and climate | ||
| Type | North Coast | Palos Verdes |
|---|---|---|
| Temperature - Average | 64.4°F | 63.2°F |
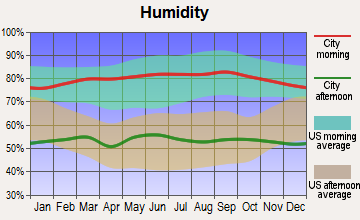
| Humidity - Average morning or afternoon humidity | 70.2% | 69.7% |
| Humidity - Differences between morning and afternoon humidity | 26.7% | 26.1% |
| Humidity - Maximum monthly morning or afternoon humidity | 78.7% | 78.1% |
| Humidity - Minimum monthly morning or afternoon humidity | 52% | 52% |
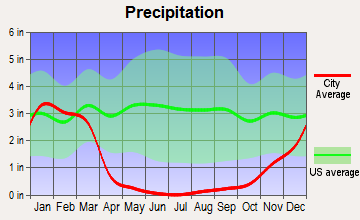
| Precipitation - Yearly average | 13 in | 13.9 in |
| Snowfall - Yearly average | 0 in | 0 in |
| Clouds - Number of days clear of clouds | 26.5% | 26.3% |
| Sunshine amount - Average | 78.4% | 78.4% |
| Sunshine amount - Differences during a year | 21.9% | 22% |
| Sunshine amount - Maximum monthly | 84.9% | 85% |
| Sunshine amount - Minimum monthly | 62.9% | 63% |
| Wind speed - Average | 6 mph | 5.8 mph |
| Natural disasters | ||
| Type | North Coast | Palos Verdes |
|---|---|---|
| Tornado activity compared to U.S. average | 18.6% | 16.4% |
| Earthquake activity compared to U.S. average | 6,843.6% | 6,683.6% |
| Natural disasters compared to U.S. average | 32% | 57% |
North Coast has limited public transportation options, but residents have access to freeways for commuting. Palos Verdes benefits from Los Angeles's extensive public transit system, including buses, light rail, and commuter trains.
| Transport | ||
| Type | North Coast | Palos Verdes |
|---|---|---|
| Amtrak stations nearby | 3 | 2 |
| FAA registered aircraft | 0 | 2 |
| Means of transportation to work | ||
| Type | North Coast | Palos Verdes |
|---|---|---|
| Bicycle | 0.7% | 0.4% |
| Bus | 1.2% | 1.1% |
| Carpooled | 10.7% | 7.9% |
| Car alone | 81.4% | 80.3% |
| Ferryboat | 0% | 0.1% |
| Motorcycle | 0.2% | 0.2% |
| Walked | 1.4% | 3.4% |
| Average travel time to work | ||
| Type | North Coast | Palos Verdes |
|---|---|---|
| Average | 28.8 min | 30.1 min |
Real estate in North Coast is less costly but still higher than the national average. Palos Verdes, with its breathtaking coastal views and high-end communities, commands some of the highest real estate prices in the country.
North Coast consists of numerous small towns, each with its unique charm. Palos Verdes is known for its high-end, gated communities, and upscale neighborhoods with breathtaking ocean views.
| Houses and residents | ||
| Type | North Coast | Palos Verdes |
|---|---|---|
| Houses | 137,450 | 35,641 |
| Average household size (people) | 2.7 | 2.6 |
| Houses occupied | 133,254 (96.9%) | 33,869 (95%) |
| Houses occupied by owners | 84,546 (63.4%) | 24,885 (73.5%) |
| Houses occupied by renters | 48,708 (36.6%) | 8,984 (26.5%) |
| Median rent asked for vacant for-rent units | $2,340 | $2,366 |
| Median price asked for vacant for-sale houses and condos | $1,099,558 | $1,138,428 |
| Estimated median house or condo value | $883,291 | Over $1,000,000 |
| Median number of rooms in apartments | 3.9 | 3.7 |
| Median number of rooms in houses and condos | 6.1 | 7.1 |
| Renting percentage | 37.7% | 27.7% |
| Housing density (houses/condos per square mile) | 2,312.7 | 223.5 |
| Household income disparities | 41.2% | 32.1% |
| Housing units without a mortgage | 13,396 (19.5%) | 6,053 (26.7%) |
| Housing units with both a second mortgage and home equity loan | 282 (0.4%) | 70 (0.3%) |
| Housing units with a mortgage | 55,188 (80.5%) | 16,629 (73.3%) |
| Housing units with a home equity loan | 6,297 (9.2%) | 2,023 (8.9%) |
| Housing units with a second mortgage | 7,643 (11.1%) | 1,947 (8.6%) |
| Housing units lacking complete kitchen facilities | 1% | 0.4% |
| Housing units lacking complete plumbing facilities | 0.5% | 0.4% |
| Median real estate property taxes paid for housing units | ||
| Type | North Coast | Palos Verdes |
|---|---|---|
| Property tax | $268,500 (0.7%) | $549,400 (0.6%) |
The main industries in North Coast are agriculture, especially viticulture, and tourism. Palos Verdes has a more diversified economy with sectors such as technology, entertainment, and finance providing most of the jobs.
North Coast has several hospitals and clinics serving its residents. Palos Verdes residents have access to world-class healthcare facilities in nearby Los Angeles.
| Health (county statistics) | ||
| Type | North Coast | Palos Verdes |
|---|---|---|
| General health status score of residents in this county from 1 (poor) to 5 (excellent) | 3.6 | 3.5 |
| Average weight of females (lbs) | 150.7 lbs | 154.6 lbs |
| Average weight of males (lbs) | 187.6 lbs | 185 lbs |
| Residents visited a dentist within the past year | 76% | 68.1% |
| Residents exercised in the past month | 79.4% | 74.7% |
| Adult residents drank alcohol in the past 30 days | 81.9% | 69.2% |
| Residents smoked 100+ cigarettes in their lives | 37.8% | 37.8% |
North Coast, being a more rural area, doesn't have as dense an infrastructure as Palos Verdes. Palos Verdes offers a more urban infrastructure, akin to nearby Los Angeles, complete with robust utilities, public transportation, and healthcare facilities.
| Infrastructure | ||
| Type | North Coast | Palos Verdes |
|---|---|---|
| TV stations | 2 | 2 |
North Coast offers a relaxed, rural charm, with a strong emphasis on local wines and food. Palos Verdes has a culturally diverse food scene, with influences from LA's multicultural landscape.
North Coast doesn't have any major sports teams of its own, but residents support Bay Area teams. Palos Verdes, being part of the LA area, has access to a broad range of professional sports teams.