North Coast, California, and San Bernardino, California are vastly different areas with separate appeals for those considering relocation or vacations. North Coast is renowned for its tranquil setting, magnificent scenery, and laid-back atmosphere, whereas San Bernardino offers a bustling city with a rich history and cultural diversity. This comparison examines the key factors potential residents or tourists might consider, such as crime and safety, weather, cost of living, educational offerings, economy, infrastructure, and cultural aspects.
Security is a primary concern for anyone contemplating relocation or visiting for a holiday. North Coast, CA, is generally safe with crime rates lower than the national average. The community-oriented policing view of local enforcement agencies enhances the security further. The crime rate in San Bernardino, however, is notably high and may be a point of concern for potential residents and visitors. The city is vigorously working on implementing crime reduction strategies, but it's advisable to stay updated on current crime rates.
Cost of Living
North Coast has a higher cost of living due to its desirable climate, vibrant wine industry, and closeness to the ocean. Housing, health care, and groceries tend to be more expensive compared to other areas. On the contrary, San Bernardino has a lower cost of living. Housing in particular is more affordable than in other California cities, though slightly above national averages.
Income Tax
In California, both North Coast and San Bernardino share the same state income tax rates, which range progressively from 1% to 13.3% based on income level.
Property Tax
The state-calculated rate in California is 1% of the property's assessed value. However, property taxes can differ between North Coast and San Bernardino due to the variation in property values, with North Coast tending to have higher home prices.
Sales Tax
Both North Coast and San Bernardino have a sales tax rate of 7.25%, which is the base rate for the state of California. This rate applies unless there are local city or county sales taxes in place.
Income
Type
North Coast
San Bernardino
Estimated median household income
$102,807
$65,311
Estimated per capita income
$50,809
$22,624
Cost of living index (U.S. average is 100)
96.1
82.2
If you make $50,000 in San Bernardino, you will have to make $58,455 in North Coast to maintain the same standard of living.
Geographical Conditions
North Coast's topography is characterized by stunning coastal vistas, lush vineyards, and the majestic redwoods. San Bernardino benefits from its mountain backdrop, providing diverse opportunities for outdoor exploration and activities.
Geographical information
Type
North Coast
San Bernardino
Land area
59.4 sq. miles
58.8 sq. miles
Population density
6,335.5 people per sq. mile
3,778.1 people per sq. mile
Relative area comparison
North Coast, CA San Bernardino, CA
Education
Education resources vary between these two regions. North Coast's school districts are well-funded, benefiting from revenue generated by the local wine industry. Several commendable schools offer high education standards. San Bernardino, however, faces challenges in education, with lower test scores and graduation rates. The presence of California State University, San Bernardino, contributes to the city's higher education landscape.
North Coast's economy is robust and largely reliant on the wine industry, featuring top employers such as wineries and wine tour companies. San Bernardino, on the other hand, has a diversified economy with a focus on logistics, government, retail, and health care. Unemployment rates remain above state averages, though job growth prospects are positive.
Biggest Employers
Some of the region's large employers are wineries and hospitality businesses for North Coast. In San Bernardino, the biggest employers include Amazon, California Department of Transportation, and the San Bernardino Unified School District.
Real-estate
In North Coast (Orange County), 45.8% voted for Democrats and 52.0% for Republicans in 2012 Presidential Election. In San Bernardino (San Bernardino County), 52.3% voted for Democrats and 45.0% for Republicans.
Elections
Type
Democrats
Republicans
Other
Year
North Coast
San Bernardino
North Coast
San Bernardino
North Coast
San Bernardino
2020
53.6%
54.2%
44.6%
43.6%
1.8%
2.2%
2016
50.9%
52.1%
42.4%
41.5%
6.7%
6.4%
2012
45.8%
52.3%
52.0%
45.0%
2.3%
2.6%
2008
47.8%
52.2%
50.3%
45.8%
1.9%
2.0%
2004
39.3%
43.8%
60.2%
55.6%
0.5%
0.6%
2000
40.4%
47.3%
55.9%
48.8%
3.7%
3.9%
1996
37.9%
44.4%
51.7%
43.6%
10.5%
12.1%
Breakdown of population affiliated with a religious congregation
Type
Adherents
Congregations
Religion
North Coast
San Bernardino
North Coast
San Bernardino
CATHOLIC CHURCH
26.5%
21.9%
4.4%
4.3%
SOUTHERN BAPTIST CONVENTION
2.3%
2.2%
8.8%
9.6%
MUSLIM ESTIMATE
0.8%
0.6%
1.3%
1.1%
LUTHERAN CHURCH
0.6%
0.3%
2.0%
1.7%
EPISCOPAL CHURCH
0.4%
0.1%
1.4%
1.3%
EVANGELICAL LUTHERAN CHURCH IN AMERICA
0.4%
0.2%
2.3%
1.5%
SEVENTH DAY ADVENTIST CHURCH
0.4%
1.6%
1.3%
4.6%
REFORMED CHURCH IN AMERICA
0.3%
0.0%
0.2%
0.2%
Weather
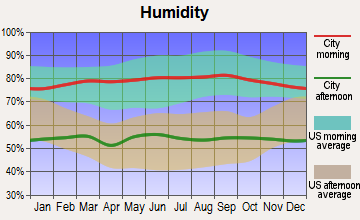
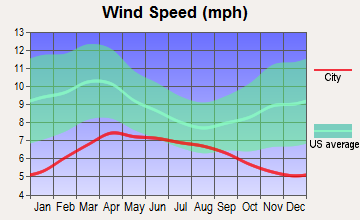
North Coast maintains a temperate, Mediterranean-style climate defined by moist winters and dry summers. The weather is generally mild, making it ideal for outdoor activities and wine tasting tours year-round. San Bernardino boasts a semi-arid climate, with hot summers and relatively mild winters. Its proximity to mountains provides a cooler environment and opportunities for winter sports.
Weather and climate
Type
North Coast
San Bernardino
Temperature - Average
64.4°F
64.8°F
Humidity - Average morning or afternoon humidity
70.2%
65.9%
Humidity - Differences between morning and afternoon humidity
26.7%
20.5%
Humidity - Maximum monthly morning or afternoon humidity
78.7%
72.2%
Humidity - Minimum monthly morning or afternoon humidity
52%
51.7%
Precipitation - Yearly average
13 in
17.9 in
Snowfall - Yearly average
0 in
0 in
Clouds - Number of days clear of clouds
26.5%
27.5%
Sunshine amount - Average
78.4%
78.3%
Sunshine amount - Differences during a year
21.9%
21.4%
Sunshine amount - Maximum monthly
84.9%
84.2%
Sunshine amount - Minimum monthly
62.9%
62.7%
Wind speed - Average
6 mph
4.1 mph
Average climate in North Coast, California
Average climate in San Bernardino, California
Air pollution
Type
AQI
CO
NO2
OZONE
PB
PM10
PM25
SO2
Year
North Coast
San Bernardino
North Coast
San Bernardino
North Coast
San Bernardino
North Coast
San Bernardino
North Coast
San Bernardino
North Coast
San Bernardino
North Coast
San Bernardino
North Coast
San Bernardino
2018
119
153
0.35
0.33
14.4
15.5
26.1
32.1
N/A
0.006
27.5
29.9
12.6
11.7
0.7
0.4
2017
116
148
0.34
0.40
13.8
15.7
28.8
33.9
N/A
0.004
26.7
32.0
13.8
13.3
0.5
0.3
2016
102
140
0.33
0.52
12.2
15.9
29.3
32.0
N/A
0.006
24.1
33.9
12.5
11.8
0.2
0.3
2015
106
147
0.32
0.49
13.2
15.8
29.8
32.3
N/A
0.004
25.0
31.5
14.5
12.7
0.2
0.3
2014
110
147
0.29
0.47
12.9
16.4
28.6
30.8
N/A
0.006
26.7
35.0
15.5
14.3
0.4
0.3
2013
107
147
0.34
0.42
13.9
17.0
27.8
28.8
0.003
0.006
29.5
32.2
14.2
13.2
0.3
0.3
2012
103
148
0.30
0.44
12.7
18.0
26.8
28.8
0.004
0.007
28.2
31.8
14.3
14.2
0.1
0.4
2011
109
150
0.31
0.35
14.7
18.0
27.0
27.9
0.006
0.006
27.7
30.6
15.9
17.7
0.7
0.4
2010
102
144
0.33
0.36
14.3
18.8
26.2
28.1
0.011
0.008
23.6
28.8
14.0
15.5
0.6
1.1
2009
118
151
0.35
0.35
15.5
20.0
27.6
28.1
0.009
0.011
24.3
31.9
14.5
17.5
1.1
1.2
2008
124
152
0.39
0.39
16.5
20.1
28.2
27.7
0.010
0.012
29.5
36.9
21.6
22.0
1.1
1.2
2007
100
132
0.36
0.49
16.3
22.5
27.0
25.9
0.012
0.016
N/A
N/A
N/A
N/A
0.8
1.7
2006
114
128
0.40
0.53
17.2
24.5
26.4
25.4
0.007
0.010
N/A
N/A
N/A
N/A
1.3
1.6
2005
95
132
0.39
0.58
17.7
26.8
27.9
24.4
0.012
0.011
N/A
N/A
N/A
N/A
1.3
2.7
2004
119
140
0.50
0.64
19.2
22.9
30.5
25.0
0.014
0.013
N/A
N/A
N/A
N/A
1.6
2.2
2003
122
143
0.64
0.97
21.9
26.9
28.9
24.3
0.030
0.032
N/A
N/A
N/A
N/A
1.1
1.5
2002
106
140
0.65
0.92
22.0
29.4
25.5
24.0
0.018
0.018
N/A
N/A
N/A
N/A
1.8
0.6
2001
116
144
0.73
0.81
22.0
30.9
25.4
26.4
0.033
0.039
N/A
N/A
N/A
N/A
1.5
1.1
2000
125
155
0.80
0.86
24.4
30.1
24.0
21.9
0.027
0.040
N/A
N/A
N/A
N/A
1.9
1.6
Natural disasters
Type
North Coast
San Bernardino
Tornado activity compared to U.S. average
18.6%
15.9%
Earthquake activity compared to U.S. average
6,843.6%
7,481.9%
Natural disasters compared to U.S. average
32%
46%
Transportation
North Coast's transportation options are rather limited, with most residents relying on private vehicles for commuting. Public buses do operate, but schedules and routes are limited. San Bernardino has a broader range of public transportation options, including bus, rail services, and a well-connected highway system.
Transport
Type
North Coast
San Bernardino
Amtrak stations
0
1
Amtrak stations nearby
3
3
FAA registered aircraft
0
80
FAA registered aircraft manufacturers and dealers
0
3
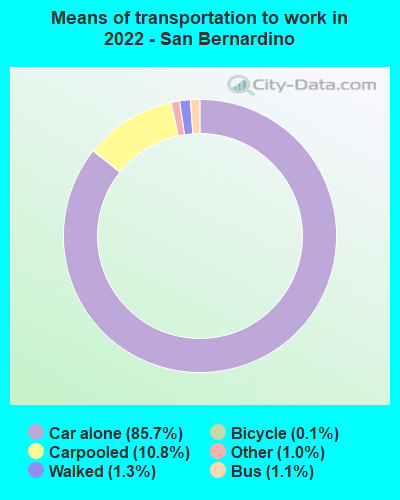
Means of transportation to work
Type
North Coast
San Bernardino
Bicycle
0.7%
0.4%
Bus
1.2%
0.7%
Carpooled
10.7%
13.2%
Car alone
81.4%
82.9%
Motorcycle
0.2%
0.2%
Railroad
0%
0.2%
Walked
1.4%
1.4%
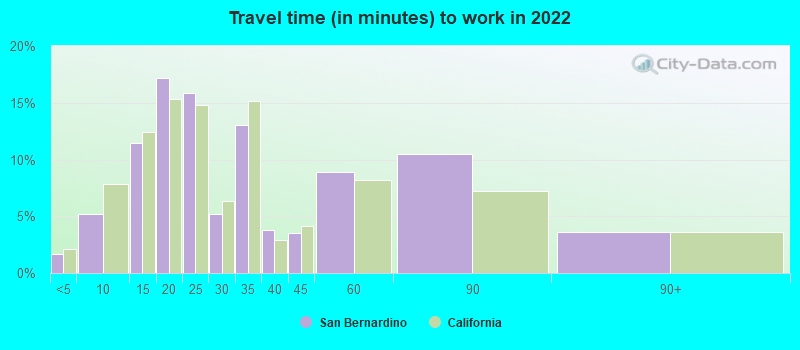
Average travel time to work
Type
North Coast
San Bernardino
Average
28.8 min
30.8 min
Neighborhoods
North Coast neighborhoods offer a sense of community and showcase picturesque landscapes, creating a relaxed, high-quality lifestyle. San Bernardino offers a mix of urban and suburban neighborhoods, each with its unique character, from downtown’s historic regions to quieter suburban areas.
Houses and residents
Type
North Coast
San Bernardino
Houses
137,450
66,188
Average household size (people)
2.7
3.4
Houses occupied
133,254 (96.9%)
63,331 (95.7%)
Houses occupied by owners
84,546 (63.4%)
32,391 (51.1%)
Houses occupied by renters
48,708 (36.6%)
30,940 (48.9%)
Median rent asked for vacant for-rent units
$2,340
$1,123
Median price asked for vacant for-sale houses and condos
$1,099,558
$195,043
Estimated median house or condo value
$883,291
$350,000
Median number of rooms in apartments
3.9
4.1
Median number of rooms in houses and condos
6.1
5.8
Renting percentage
37.7%
49.7%
Housing density (houses/condos per square mile)
2,312.7
1,125.4
Household income disparities
41.2%
41.1%
Housing units without a mortgage
13,396 (19.5%)
127 (0.6%)
Housing units with both a second mortgage and home equity loan
282 (0.4%)
762 (3.4%)
Housing units with a mortgage
55,188 (80.5%)
22,340 (99.4%)
Housing units with a home equity loan
6,297 (9.2%)
0 (0%)
Housing units with a second mortgage
7,643 (11.1%)
1,041 (4.6%)
Housing units lacking complete kitchen facilities
1%
2.8%
Housing units lacking complete plumbing facilities
Self-employed workers in own not incorporated business
15,532
5,389
State government workers
5,751
4,741
Unpaid family workers
744
290
Industries and Occupations
The primary industry in North Coast is wine production, which has motivated substantial growth in hospitality and tourism. In San Bernardino, the top industries include logistics, health care, government services, and retail. The most common occupations reflect the dominant industries in each area, with vineyard workers, wine makers, and hospitality staff common in North Coast, and health care workers, retail associates, and government officials prevalent in San Bernardino.
North Coast houses several high-quality healthcare facilities, with access to specialized treatments owing to the affluent population. San Bernardino has a number of hospitals and clinics, with Loma Linda University Health recognized as a top healthcare provider in the region.
Health (county statistics)
Type
North Coast
San Bernardino
General health status score of residents in this county from 1 (poor) to 5 (excellent)
In terms of infrastructure, North Coast benefits from well-maintained roads, reliable utilities, and efficient public services. However, public transportation options are limited. San Bernardino features more developed infrastructure with a robust transit system. The city faces ongoing challenges with aging infrastructure and has numerous projects underway to address these issues.
Infrastructure
Type
North Coast
San Bernardino
TV stations
2
6
Culture and Food
North Coast is known for its vineyards and wine culture, with numerous wine festivals and culinary events throughout the year. San Bernardino is celebrated for its diverse food scene that reflects its multicultural makeup, offering a range of cuisine from Mexican to Asian.
Sports Teams
While North Coast doesn't have any professional sports teams, its residents often support the sports teams from the nearby San Francisco Bay Area. San Bernardino has minor league baseball and hockey teams, with many residents supporting teams from the broader Southern California region.
 North Coast, CA
 San Bernardino, CA