When comparing North Coast, CA, known for its charming coastal settings, thriving wine industry, and pristine landscapes, with Whittier, CA, a suburban city in Los Angeles County with diversified economic activities, there are distinct differences in various aspects. From varying weather and cost of living to different industries, taxes, and culture, both these places offer a unique, and contrasting living and visiting experiences. This comparison provides a comprehensive look into these fundamental differences to aid potential relocators or tourists.
North Coast, CA, offers a generally safer environment compared to Whittier, CA. While both regions maintain an average crime rate compared to national standards, Whittier, due to being more urban and populated, has slightly higher crime rates. Like any place, safe practices are recommended, especially for tourists unfamiliar with the surroundings.
Cost of Living
Living in North Coast can be a bit costlier than in Whittier. This is primarily due to the higher real-estate prices, attributed to the attractive coastal location, making it a high-demand area. Groceries and other living expenses are also comparably higher in North Coast due to its remote location, as compared to Whittier’s inner-city setting.
Income Tax
California has a progressive income tax, which means both North Coast and Whittier residents will be subject to the same state income tax rates that range from 1% to 13.3% depending upon the income level.
Property Tax
State property taxes are also similar; however, due to the higher real estate prices in North Coast, property taxes may come out to be higher there when compared to Whittier.
Sales Tax
Both North Coast and Whittier fall under California’s jurisdiction and hence have the same state sales tax of 7.25%. Local city taxes may add to this base rate.
Income
Type
North Coast
Whittier
Estimated median household income
$102,807
$84,320
Estimated per capita income
$50,809
$40,248
Cost of living index (U.S. average is 100)
96.1
138.9
If you make $50,000 in North Coast, you will have to make $72,268 in Whittier to maintain the same standard of living.
Geographical Conditions
North Coast is a picturesque region with mountains, beaches, and vineyards lending to its touristy appeal. Whittier is relatively flat with urban and suburban landscapes marking its geography.
Geographical information
Type
North Coast
Whittier
Land area
59.4 sq. miles
14.6 sq. miles
Population density
6,335.5 people per sq. mile
5,830.9 people per sq. mile
Relative area comparison
North Coast, CA Whittier, CA
Education
Both North Coast and Whittier offer strong educational infrastructures. North Coast has numerous well-reputed schools, and being a tourist and wine cultivation hub, it offers courses and training in these areas. Whittier houses several universities and colleges, offering diversified courses to its residents and students from outside.
The economies of North Coast and Whittier differ substantially. North Coast thrives primarily on tourism and wine production while Whittier, being a suburban city of LA, has a diverse economy ranging from healthcare, education, to retail businesses.
Biggest Employers
In North Coast, the biggest employers would be the wineries and touristic establishments. Whittier is home to several higher education institutions and healthcare establishments that serve as the city’s largest employers.
In North Coast (Orange County), 45.8% voted for Democrats and 52.0% for Republicans in 2012 Presidential Election. In Whittier (Los Angeles County), 69.7% voted for Democrats and 27.8% for Republicans.
Elections
Type
Democrats
Republicans
Other
Year
North Coast
Whittier
North Coast
Whittier
North Coast
Whittier
2020
53.6%
71.0%
44.6%
26.9%
1.8%
2.1%
2016
50.9%
72.0%
42.4%
22.5%
6.7%
5.5%
2012
45.8%
69.7%
52.0%
27.8%
2.3%
2.4%
2008
47.8%
69.2%
50.3%
28.8%
1.9%
1.9%
2004
39.3%
63.3%
60.2%
35.7%
0.5%
1.0%
2000
40.4%
63.6%
55.9%
32.4%
3.7%
4.0%
1996
37.9%
59.3%
51.7%
31.0%
10.5%
9.7%
Breakdown of population affiliated with a religious congregation
Type
Adherents
Congregations
Religion
North Coast
Whittier
North Coast
Whittier
CATHOLIC CHURCH
26.5%
36.1%
4.4%
4.7%
SOUTHERN BAPTIST CONVENTION
2.3%
1.0%
8.8%
9.0%
MUSLIM ESTIMATE
0.8%
0.7%
1.3%
1.0%
LUTHERAN CHURCH
0.6%
0.2%
2.0%
1.6%
EPISCOPAL CHURCH
0.4%
0.4%
1.4%
1.4%
EVANGELICAL LUTHERAN CHURCH IN AMERICA
0.4%
0.2%
2.3%
1.9%
SEVENTH DAY ADVENTIST CHURCH
0.4%
0.5%
1.3%
2.4%
REFORMED CHURCH IN AMERICA
0.3%
0.1%
0.2%
0.2%
AMERICAN BAPTIST CHURCHES IN THE USA
0.2%
0.5%
1.7%
3.1%
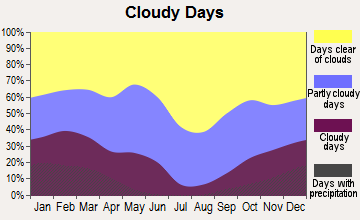
Weather
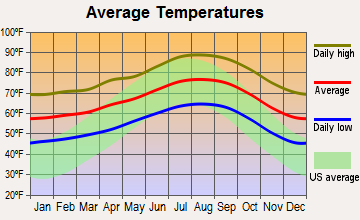
The North Coast experiences a mild climate, with warm summers and cool winters, while Whittier enjoys a more Mediterranean-like weather pattern. Whittier's summer temperature can hit higher peaks than North Coast, making it a popular spot for sun-lovers. Both regions are favored by tourists for their pleasant climates.
Weather and climate
Type
North Coast
Whittier
Temperature - Average
64.4°F
66.8°F
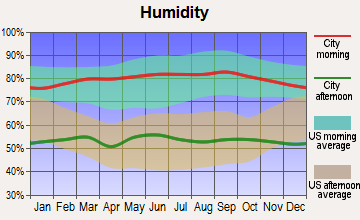
Humidity - Average morning or afternoon humidity
70.2%
65.2%
Humidity - Differences between morning and afternoon humidity
26.7%
20.2%
Humidity - Maximum monthly morning or afternoon humidity
78.7%
71.5%
Humidity - Minimum monthly morning or afternoon humidity
52%
51.3%
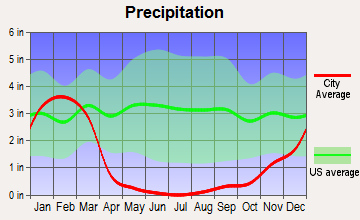
Precipitation - Yearly average
13 in
14.7 in
Snowfall - Yearly average
0 in
0 in
Clouds - Number of days clear of clouds
26.5%
28%
Sunshine amount - Average
78.4%
78.4%
Sunshine amount - Differences during a year
21.9%
22%
Sunshine amount - Maximum monthly
84.9%
85%
Sunshine amount - Minimum monthly
62.9%
63%
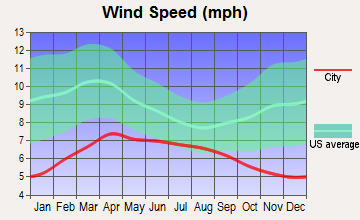
Wind speed - Average
6 mph
3.9 mph
Average climate in North Coast, California
Average climate in Whittier, California
Air pollution
Type
AQI
CO
NO2
OZONE
PB
PM10
PM25
SO2
Year
North Coast
Whittier
North Coast
Whittier
North Coast
Whittier
North Coast
Whittier
North Coast
Whittier
North Coast
Whittier
North Coast
Whittier
North Coast
Whittier
2018
119
142
0.35
0.34
14.4
13.8
26.1
26.0
N/A
0.007
27.5
27.8
12.6
13.6
0.7
0.5
2017
116
146
0.34
0.36
13.8
14.9
28.8
26.9
N/A
0.007
26.7
29.1
13.8
14.2
0.5
0.6
2016
102
136
0.33
0.36
12.2
15.0
29.3
26.3
N/A
0.007
24.1
26.0
12.5
13.2
0.2
0.5
2015
106
144
0.32
0.37
13.2
15.4
29.8
26.7
N/A
0.006
25.0
26.5
14.5
15.1
0.2
0.4
2014
110
141
0.29
0.36
12.9
15.9
28.6
25.8
N/A
0.007
26.7
28.7
15.5
15.8
0.4
0.5
2013
107
144
0.34
0.40
13.9
16.7
27.8
24.7
0.003
0.006
29.5
29.4
14.2
14.7
0.3
0.5
2012
103
148
0.30
0.43
12.7
17.3
26.8
24.7
0.004
0.006
28.2
28.5
14.3
15.8
0.1
0.4
2011
109
146
0.31
0.44
14.7
18.0
27.0
24.5
0.006
0.008
27.7
28.6
15.9
16.8
0.7
0.6
2010
102
133
0.33
0.48
14.3
18.9
26.2
23.9
0.011
0.014
23.6
26.2
14.0
15.0
0.6
0.6
2009
118
153
0.35
0.49
15.5
20.5
27.6
24.7
0.009
0.010
24.3
29.7
14.5
16.3
1.1
0.8
2008
124
154
0.39
0.53
16.5
22.0
28.2
23.8
0.010
0.012
29.5
31.8
21.6
17.9
1.1
0.8
2007
100
135
0.36
0.54
16.3
22.6
27.0
23.4
0.012
0.014
N/A
N/A
N/A
N/A
0.8
1.2
2006
114
129
0.40
0.59
17.2
23.4
26.4
24.0
0.007
0.009
N/A
N/A
N/A
N/A
1.3
1.6
2005
95
128
0.39
0.60
17.7
25.4
27.9
20.5
0.012
0.014
N/A
N/A
N/A
N/A
1.3
2.3
2004
119
135
0.50
0.69
19.2
27.3
30.5
22.4
0.014
0.017
N/A
N/A
N/A
N/A
1.6
2.2
2003
122
140
0.64
0.85
21.9
31.0
28.9
21.1
0.030
0.025
N/A
N/A
N/A
N/A
1.1
1.4
2002
106
137
0.65
0.87
22.0
31.0
25.5
19.7
0.018
0.022
N/A
N/A
N/A
N/A
1.8
2.3
2001
116
143
0.73
0.97
22.0
32.2
25.4
18.2
0.033
0.037
N/A
N/A
N/A
N/A
1.5
2.4
2000
125
153
0.80
1.03
24.4
34.2
24.0
18.8
0.027
0.031
N/A
N/A
N/A
N/A
1.9
1.6
Natural disasters
Type
North Coast
Whittier
Tornado activity compared to U.S. average
18.6%
18.9%
Earthquake activity compared to U.S. average
6,843.6%
7,121.4%
Natural disasters compared to U.S. average
32%
57%
Transportation
North Coast has limited public transportation due to its remote location and most tourists and locals prefer cars for commuting. Whittier, being a part of LA's metro area, has better public transport connectivity making it easier for daily commutes.
Transport
Type
North Coast
Whittier
Amtrak stations nearby
3
3
FAA registered aircraft
0
37
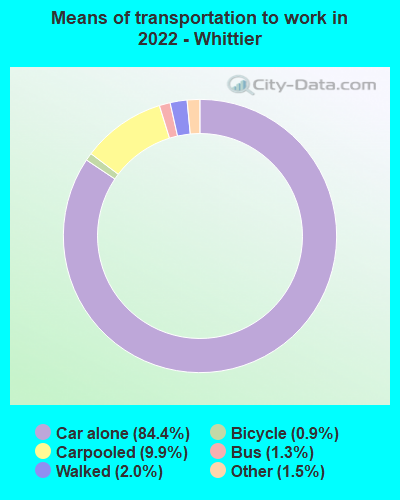
Means of transportation to work
Type
North Coast
Whittier
Bicycle
0.7%
1%
Bus
1.2%
1.3%
Carpooled
10.7%
10.3%
Car alone
81.4%
84.3%
Motorcycle
0.2%
0.1%
Walked
1.4%
2.2%
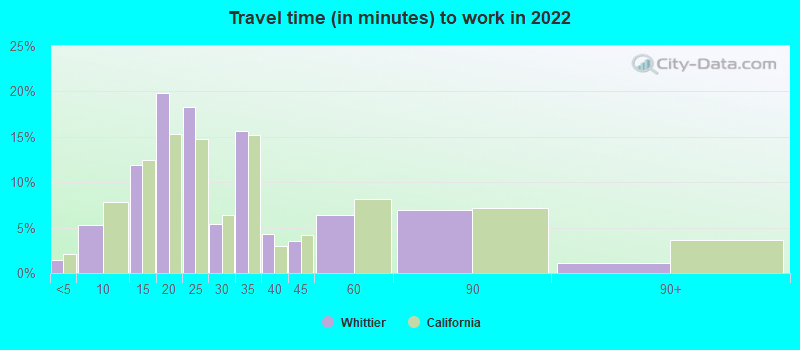
Average travel time to work
Type
North Coast
Whittier
Average
28.8 min
28.1 min
Real Estate
Real estate at the North Coast is generally pricier due to its coveted coastal location. Whittier, while it also has pricey neighborhoods, offers more affordable options due to its size and diversity.
Neighborhoods
North Coast’s neighborhoods are well-spaced, surrounded by panoramic natural beauty and they cater to a more relaxed lifestyle. Whittier’s neighborhoods offer a mix of urban and suburban feel, catering to different lifestyle needs.
Houses and residents
Type
North Coast
Whittier
Houses
137,450
28,607
Average household size (people)
2.7
3
Houses occupied
133,254 (96.9%)
27,773 (97.1%)
Houses occupied by owners
84,546 (63.4%)
16,521 (59.5%)
Houses occupied by renters
48,708 (36.6%)
11,252 (40.5%)
Median rent asked for vacant for-rent units
$2,340
$1,375
Median price asked for vacant for-sale houses and condos
$1,099,558
$853,666
Estimated median house or condo value
$883,291
$718,300
Median number of rooms in apartments
3.9
3.8
Median number of rooms in houses and condos
6.1
6
Renting percentage
37.7%
42.7%
Housing density (houses/condos per square mile)
2,312.7
1,955.2
Household income disparities
41.2%
43.5%
Housing units without a mortgage
13,396 (19.5%)
289 (2.3%)
Housing units with both a second mortgage and home equity loan
282 (0.4%)
1,165 (9.2%)
Housing units with a mortgage
55,188 (80.5%)
12,353 (97.7%)
Housing units with a home equity loan
6,297 (9.2%)
0 (0%)
Housing units with a second mortgage
7,643 (11.1%)
1,414 (11.2%)
Housing units lacking complete kitchen facilities
1%
3.1%
Housing units lacking complete plumbing facilities
Self-employed workers in own not incorporated business
15,532
1,908
State government workers
5,751
1,415
Unpaid family workers
744
241
Industries and Occupations
In North Coast, occupations revolve around tourism, hospitality, and wine production sectors. On the other hand, Whittier, with its diversified economy, offers jobs across different industries such as education, healthcare, retail and more.
Both regions have well-equipped healthcare facilities. While North Coast may have fewer options due to its relative remoteness, Whittier, being part of LA County, offers comprehensive healthcare facilities catering to its larger population.
Health (county statistics)
Type
North Coast
Whittier
General health status score of residents in this county from 1 (poor) to 5 (excellent)
While North Coast boasts attractive touristic infrastructures with vineyards and beaches, emphasizing nature and leisure, Whittier offers an urbanized infrastructure equipped with modern amenities, schools, hospitals, and commercial establishments that cater to a larger population.
Infrastructure
Type
North Coast
Whittier
TV stations
2
22
Culture and Food
North Coast's culture is distinguished by its wine and seafood, reflecting its coastal and viticulture roots. Whittier houses a mix of cultures, offering a variety of global cuisines catered to its diverse population.
Sports Teams
As a part of the LA County, Whittier has the advantage of being close to major sports venues, hosting teams like the LA Lakers. North Coast, although not hosting significant teams, offers numerous outdoor activities due to its geographic location.
 North Coast, CA
 Whittier, CA