Northeast Jefferson and Boulder are both in Colorado, sharing the state's natural beauty but still maintaining unique charms. Northeast Jefferson offers a suburban atmosphere with slightly lower living costs, while Boulder is lauded for a vibrant downtown and a high-quality education system. The comparison below gives an in-depth view of living or visiting either of these cities, with emphasis on different factors like crime/safety, weather, cost of living, among others.
When it comes to safety, both Northeast Jefferson and Boulder fare reasonably well. In contrast to larger, more urban cities in Colorado, they maintain lower crime rates overall. While Northeast Jefferson has some areas with higher crime incidents, it's overall safer than most American cities. Boulder, popular among tourists, is also generally safe. However, petty crimes like thefts could increase during peak tourist seasons. Residents in both cities are proactive about neighborhood safety, with well-structured neighborhood watch programs.
Cost of Living
The cost of living in Boulder is generally higher than in Northeast Jefferson. Boulder has an active real estate market and high demand, meaning costs for housing are comparatively steep. Other aspects of living costs like groceries, healthcare, utilities also tend to be higher in Boulder compared to Northeast Jefferson.
Income Tax
Both cities are subject to Colorado's flat income tax rate of 4.63%. There are no additional city income taxes in either Boulder or Northeast Jefferson.
Property Tax
Although the rate can vary based on the precise location within each city, residents of Boulder typically pay a slightly higher property tax than those in Northeast Jefferson.
Sales Tax
The sales tax in Boulder is slightly higher than Northeast Jefferson. While both cities have additional city taxes on top of the statewide 2.9% sales tax, Boulder's total sales tax reaches 8.845% compared to Northeast Jefferson's 7.96%.
Income
Type
Northeast Jefferson
Boulder
Estimated median household income
$91,025
$84,167
Estimated per capita income
$46,835
$52,420
Cost of living index (U.S. average is 100)
119.7
120.8
If you make $50,000 in Northeast Jefferson, you will have to make $50,459 in Boulder to maintain the same standard of living.
Geographical Conditions
Nestled at the foothill of Rocky Mountains, Boulder offers stunning landscapes and hiking opportunities. Northeast Jefferson, by the plains, offers its share of natural beauty and outdoor activities, but with less dramatic topography.
Geographical information
Type
Northeast Jefferson
Boulder
Land area
172.8 sq. miles
24.4 sq. miles
Population density
2,615.1 people per sq. mile
4,273.9 people per sq. mile
Relative area comparison
Northeast Jefferson, CO Boulder, CO
Education
Boulder is home to the University of Colorado, making it a hub for higher education. Boulder Valley School District is highly regarded with numerous top-rated schools. While Northeast Jefferson doesn't have as notable a university, it is part of the Jefferson County School District. The district has been praised for its commitment to providing quality education and well-rounded curriculum.
Boulder boasts a robust economy with plentiful employment opportunities especially in technology, research, and education sectors. Northeast Jefferson's economy is more industrial-orientated with a focus on manufacturing jobs. Both cities, however, offer ample opportunities for small businesses to thrive.
Biggest Employers
Boulder's biggest employers are the University of Colorado Boulder and several tech companies such as Google and IBM. Northeast Jefferson has several large factories and retail centers, making them the most significant employers in the area.
In Northeast Jefferson (Jefferson County), 51.6% voted for Democrats and 46.7% for Republicans in 2012 Presidential Election. In Boulder (Boulder County), 70.0% voted for Democrats and 28.0% for Republicans.
Elections
Type
Democrats
Republicans
Other
Year
Northeast Jefferson
Boulder
Northeast Jefferson
Boulder
Northeast Jefferson
Boulder
2020
58.3%
77.7%
39.7%
20.8%
2.0%
1.6%
2016
49.2%
70.6%
42.3%
22.1%
8.6%
7.3%
2012
51.6%
70.0%
46.7%
28.0%
1.8%
2.1%
2008
54.0%
72.7%
44.9%
26.3%
1.1%
1.0%
2004
46.9%
66.4%
52.1%
32.5%
1.0%
1.1%
2000
43.0%
50.2%
51.1%
36.5%
5.9%
13.4%
1996
42.7%
52.2%
48.4%
34.5%
8.9%
13.3%
Breakdown of population affiliated with a religious congregation
Type
Adherents
Congregations
Religion
Northeast Jefferson
Boulder
Northeast Jefferson
Boulder
CATHOLIC CHURCH
15.0%
20.1%
5.1%
4.3%
EVANGELICAL LUTHERAN CHURCH IN AMERICA
1.7%
2.2%
4.2%
3.9%
SOUTHERN BAPTIST CONVENTION
1.2%
0.4%
7.5%
3.4%
LUTHERAN CHURCH
1.1%
0.4%
3.3%
2.1%
EPISCOPAL CHURCH
0.5%
1.1%
2.7%
2.1%
SEVENTH DAY ADVENTIST CHURCH
0.4%
0.5%
2.1%
1.7%
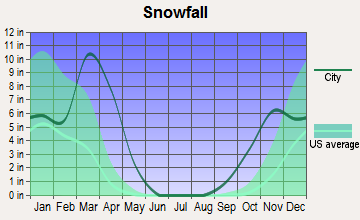
Weather
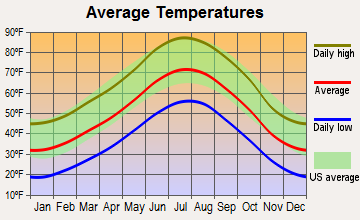
Colorado's weather is famous for its dramatic changes, and both Northeast Jefferson and Boulder experience four distinct seasons. Winters can be brisk and snowy, offering opportunities for winter sports. Summers are warm, perfect for hiking and outdoor activities. Boulder tends to have a slightly more extreme climate due to its higher altitude.
Weather and climate
Type
Northeast Jefferson
Boulder
Temperature - Average
47.9°F
50.8°F
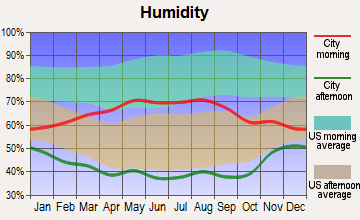
Humidity - Average morning or afternoon humidity
50.6%
50.7%
Humidity - Differences between morning and afternoon humidity
20%
20.1%
Humidity - Maximum monthly morning or afternoon humidity
55%
55.1%
Humidity - Minimum monthly morning or afternoon humidity
35%
35.1%
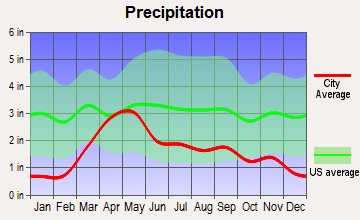
Precipitation - Yearly average
17.2 in
19.9 in
Snowfall - Yearly average
114 in
113.8 in
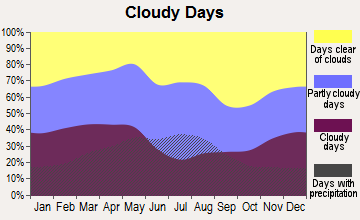
Clouds - Number of days clear of clouds
19.2%
19.2%
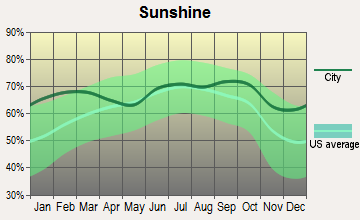
Sunshine amount - Average
75.6%
75.6%
Sunshine amount - Differences during a year
10%
10%
Sunshine amount - Maximum monthly
74%
74%
Sunshine amount - Minimum monthly
64%
64%
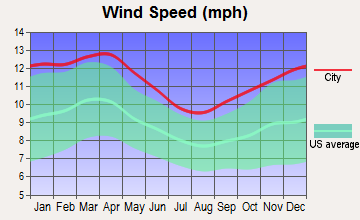
Wind speed - Average
8.6 mph
8.7 mph
Average climate in Northeast Jefferson, Colorado
Average climate in Boulder, Colorado
Air pollution
Type
AQI
CO
NO2
OZONE
PB
PM10
PM25
SO2
Year
Northeast Jefferson
Boulder
Northeast Jefferson
Boulder
Northeast Jefferson
Boulder
Northeast Jefferson
Boulder
Northeast Jefferson
Boulder
Northeast Jefferson
Boulder
Northeast Jefferson
Boulder
Northeast Jefferson
Boulder
2018
104
104
0.40
0.35
22.3
21.0
34.9
36.6
N/A
N/A
29.2
29.2
8.4
8.8
0.7
0.7
2017
97
94
0.40
0.35
22.5
21.3
34.5
35.7
N/A
N/A
22.0
22.0
8.2
8.6
0.8
0.9
2016
90
90
0.44
0.41
24.4
23.4
34.3
33.7
N/A
N/A
22.6
22.6
7.8
8.1
1.0
1.0
2015
101
101
0.45
0.43
24.1
22.1
32.8
31.5
N/A
N/A
21.0
20.6
9.5
9.4
1.0
1.1
2014
94
94
0.45
0.41
23.4
21.1
33.1
32.5
N/A
N/A
25.0
22.2
10.1
10.1
1.3
1.3
2013
84
85
0.40
0.38
21.0
19.0
33.6
33.3
N/A
N/A
24.3
21.5
N/A
N/A
1.5
1.4
2012
91
98
0.34
0.38
18.9
18.9
33.4
35.5
N/A
N/A
24.4
23.4
N/A
N/A
1.3
0.9
2011
90
93
0.34
0.40
18.1
18.1
32.0
34.7
N/A
N/A
23.8
24.1
N/A
N/A
1.5
1.4
2010
79
83
0.42
0.44
16.3
16.3
29.2
32.7
N/A
N/A
26.5
27.3
N/A
N/A
1.0
1.0
2009
76
81
0.38
0.42
14.1
14.1
27.9
31.2
0.005
N/A
22.5
23.1
N/A
N/A
1.3
1.3
2008
85
84
0.42
0.44
17.3
17.3
30.8
32.7
0.008
N/A
25.5
26.0
N/A
N/A
1.6
1.6
2007
96
95
0.39
0.41
20.6
20.6
29.0
24.8
0.007
N/A
29.1
27.7
N/A
N/A
1.2
1.2
2006
89
91
0.46
0.43
19.0
19.0
29.5
29.9
0.027
0.041
28.0
28.0
N/A
N/A
1.4
1.4
2005
86
87
0.51
0.48
21.3
21.3
26.0
27.4
0.119
0.159
29.6
29.4
N/A
N/A
1.5
1.5
2004
82
87
0.53
0.50
21.2
21.2
24.2
26.5
0.043
0.066
28.6
28.6
N/A
N/A
1.8
1.8
2003
106
107
0.52
0.64
21.2
21.2
25.9
28.2
0.046
0.072
32.6
32.6
N/A
N/A
1.9
1.9
2002
86
91
0.60
0.70
19.2
19.2
25.6
28.1
0.031
0.044
35.7
35.7
N/A
N/A
2.4
2.4
2001
95
95
0.69
0.81
20.8
18.4
23.7
25.0
0.034
0.050
32.6
32.6
N/A
N/A
2.6
2.6
2000
94
100
0.70
0.86
11.7
10.2
24.5
26.2
0.037
0.051
12.2
12.2
N/A
N/A
2.1
2.1
Natural disasters
Type
Northeast Jefferson
Boulder
Tornado activity compared to U.S. average
118.6%
106.7%
Earthquake activity compared to U.S. average
826.6%
834.1%
Natural disasters compared to U.S. average
12%
14%
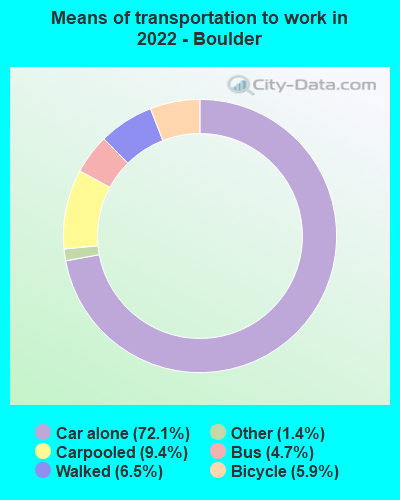
Transportation
Boulder boasts an efficient public transportation system, primarily the bus network managed by RTD. Northeast Jefferson relies more heavily on car travel, although it still has access to RTD bus lines. Both cities are connected by main highways making commuting relatively easy.
Transport
Type
Northeast Jefferson
Boulder
Amtrak stations
0
1
Amtrak stations nearby
1
2
FAA registered aircraft
0
311
FAA registered aircraft manufacturers and dealers
0
37
Means of transportation to work
Type
Northeast Jefferson
Boulder
Bicycle
0.3%
5.4%
Bus
3.2%
3%
Carpooled
10%
5.9%
Car alone
80.3%
78.8%
Motorcycle
0.1%
0.3%
Railroad
0%
0.5%
Walked
1.1%
4.9%
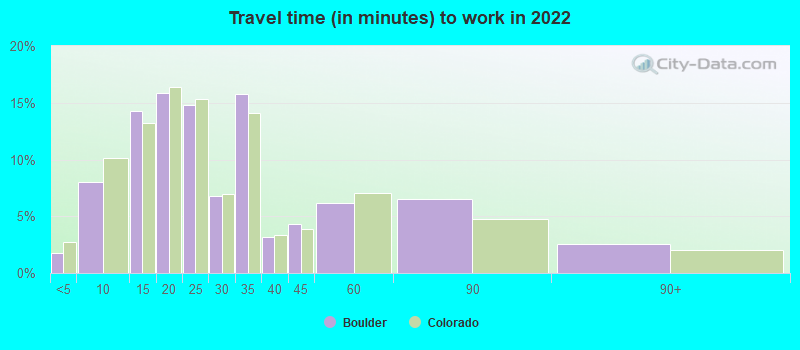
Average travel time to work
Type
Northeast Jefferson
Boulder
Average
26.6 min
28.4 min
Real Estate
Boulder's real estate market is active and competitive, with home prices being significantly higher than the state average. In contrast, Northeast Jefferson offers more affordable housing options, albeit with fewer new developments.
Neighborhoods
Boulder is known for its eclectic mix of neighborhoods, each offering something unique, from the vibrant Downtown to the tranquil Table Mesa. Northeast Jefferson is largely residential with a variety of neighborhoods catering to different lifestyle needs, from quiet suburban areas to more bustling retail districts.
Houses and residents
Type
Northeast Jefferson
Boulder
Houses
180,978
44,793
Average household size (people)
2.4
2.2
Houses occupied
176,726 (97.7%)
42,376 (94.6%)
Houses occupied by owners
125,208 (70.8%)
19,576 (46.2%)
Houses occupied by renters
51,518 (29.2%)
22,800 (53.8%)
Median rent asked for vacant for-rent units
$1,659
$1,589
Median price asked for vacant for-sale houses and condos
$884,573
$580,577
Estimated median house or condo value
$522,903
$941,100
Median number of rooms in apartments
4
3.4
Median number of rooms in houses and condos
7.3
6.8
Renting percentage
31.3%
52.3%
Housing density (houses/condos per square mile)
1,047.5
1,837.7
Household income disparities
40.7%
47.4%
Housing units without a mortgage
21,689 (19.3%)
144 (1.2%)
Housing units with both a second mortgage and home equity loan
469 (0.4%)
994 (8.4%)
Housing units with a mortgage
90,716 (80.7%)
11,729 (98.8%)
Housing units with a home equity loan
9,124 (8.1%)
355 (3%)
Housing units with a second mortgage
16,287 (14.5%)
1,653 (13.9%)
Housing units lacking complete kitchen facilities
0.6%
0.2%
Housing units lacking complete plumbing facilities
Self-employed workers in own not incorporated business
15,916
3,296
State government workers
7,028
5,488
Unpaid family workers
382
48
Industries and Occupations
A large part of Boulder's workforce is engaged in scientific, technical, and professional services, in part due to the presence of the University of Colorado. Manufacturing and retail trade are also significant industries. On the other hand, Northeast Jefferson's workforce is more focused on manufacturing, construction, and retail trade.
Boulder has highly rated health care facilities, including Boulder Community Health and the UCHealth Boulder Health Center. Northeast Jefferson residents primarily rely on the St. Anthony Hospital and the Lutheran Medical Center in nearby Wheat Ridge.
Health (county statistics)
Type
Northeast Jefferson
Boulder
General health status score of residents in this county from 1 (poor) to 5 (excellent)
Both cities offer solid infrastructures with well-maintained roads, public parks, libraries, and more. Boulder, due to its larger population and status as a university town, has a more vibrant downtown area with more shopping and dining options. Northeast Jefferson provides a quieter, suburban living environment.
Infrastructure
Type
Northeast Jefferson
Boulder
TV stations
19
20
Culture and Food
Boulder boasts a vibrant cultural scene and a wide culinary landscape famous for its farm-to-table offerings. Northeast Jefferson offers a quieter cultural experience but also houses a variety of restaurants that cater to diverse taste buds.
Sports Teams
While neither city is home to major professional sports teams, Boulder hosts the Colorado Buffaloes collegiate teams, and Northeast Jefferson residents have easy access to Denver’s pro sports teams.
 Northeast Jefferson, CO
 Boulder, CO