Northeast Jefferson and Colorado Springs are both vibrant regions of Colorado that offer unique experiences for both residents and visitors. Their differences in terms of safety, cost of living, education and other factors make each area distinct. This in-depth comparison will help you understand the unique strengths and weaknesses of both areas, assisting you make an informed choice on whether to visit or relocate to either of them.
When comparing crime rates, Northeast Jefferson boasts a lower crime rate than Colorado Springs. It's generally considered a safer place to live, making it a more appealing city for families and individuals concerned about safety. On the other hand, Colorado Springs has been working on reducing crime rates and is still generally safe for tourists to visit, but residents may experience higher exposure to crime.
Cost of Living
The cost of living is higher in Northeast Jefferson than in Colorado Springs. This is reflected in housing prices, the price of goods and services, and overall expenditures. However, relatively higher salaries in Northeast Jefferson can help offset these costs, while the lower cost of living in Colorado Springs may be more appealing to those with stricter budgets.
Income Tax
Colorado has a flat statewide income tax rate, so residents in both Northeast Jefferson and Colorado Springs will pay the same income tax regardless of their city.
Property Tax
The property tax rate is higher in Northeast Jefferson compared to Colorado Springs, which can factor into the overall cost of living and housing affordability.
Sales Tax
Overall, the sales tax in Colorado Springs is slightly lower than in Northeast Jefferson. This can make a difference in the long term, especially for those living on a budget.
Income
Type
Northeast Jefferson
Colorado Springs
Estimated median household income
$91,025
$74,579
Estimated per capita income
$46,835
$39,808
Cost of living index (U.S. average is 100)
119.7
99.6
If you make $50,000 in Colorado Springs, you will have to make $60,090 in Northeast Jefferson to maintain the same standard of living.
Geographical Conditions
Both Northeast Jefferson and Colorado Springs offer stunning natural beauty. Jefferson is close to the Flatiron mountains while Springs is near Pike's Peak and the Garden of the Gods.
Geographical information
Type
Northeast Jefferson
Colorado Springs
Land area
172.8 sq. miles
185.7 sq. miles
Population density
2,615.1 people per sq. mile
2,605.5 people per sq. mile
Relative area comparison
Northeast Jefferson, CO Colorado Springs, CO
Education
Northeast Jefferson is served by the Jefferson County Public School system, a highly-rated school district with excellent education opportunities. However, Colorado Springs is home to many prestigious private schools and several noteworthy public schools, making it a solid choice for families prioritizing education.
Northeast Jefferson has a robust and diverse economy with a lower unemployment rate compared to Colorado Springs. Colorado Springs, on the other hand, has a more military and defense-centric economy due to the presence of military bases and related industries.
Biggest Employers
The largest employers in Northeast Jefferson are primarily healthcare institutions and retail companies. Colorado Springs' economy is strongly backed by the military presence, with the U.S. Air Force Academy and Fort Carson among the top employers.
In Northeast Jefferson (Jefferson County), 51.6% voted for Democrats and 46.7% for Republicans in 2012 Presidential Election. In Colorado Springs (El Paso County), 38.7% voted for Democrats and 59.2% for Republicans.
Elections
Type
Democrats
Republicans
Other
Year
Northeast Jefferson
Colorado Springs
Northeast Jefferson
Colorado Springs
Northeast Jefferson
Colorado Springs
2020
58.3%
43.0%
39.7%
53.9%
2.0%
3.1%
2016
49.2%
34.1%
42.3%
56.6%
8.6%
9.4%
2012
51.6%
38.7%
46.7%
59.2%
1.8%
2.0%
2008
54.0%
40.0%
44.9%
58.9%
1.1%
1.1%
2004
46.9%
32.2%
52.1%
66.9%
1.0%
0.9%
2000
43.0%
30.9%
51.1%
64.1%
5.9%
5.0%
1996
42.7%
32.2%
48.4%
59.0%
8.9%
8.8%
Breakdown of population affiliated with a religious congregation
Type
Adherents
Congregations
Religion
Northeast Jefferson
Colorado Springs
Northeast Jefferson
Colorado Springs
CATHOLIC CHURCH
15.0%
8.4%
5.1%
5.4%
EVANGELICAL LUTHERAN CHURCH IN AMERICA
1.7%
1.0%
4.2%
2.3%
SOUTHERN BAPTIST CONVENTION
1.2%
2.6%
7.5%
11.3%
LUTHERAN CHURCH
1.1%
0.7%
3.3%
1.9%
EPISCOPAL CHURCH
0.5%
0.4%
2.7%
1.6%
SEVENTH DAY ADVENTIST CHURCH
0.4%
0.2%
2.1%
1.2%
PRESBYTERIAN CHURCH IN AMERICA
0.1%
0.4%
0.6%
1.2%
AMERICAN BAPTIST CHURCHES IN THE USA
0.0%
0.3%
0.6%
1.2%
Weather
In terms of weather, both regions experience typical Colorado weather. That being said, Northeast Jefferson often gets slightly less snowfall compared to Colorado Springs due to different mountain climates. Springs can be particularly beautiful in both regions, with a plethora of colorful wildflowers blooming.
Weather and climate
Type
Northeast Jefferson
Colorado Springs
Temperature - Average
47.9°F
43.4°F
Humidity - Average morning or afternoon humidity
50.6%
53.3%
Humidity - Differences between morning and afternoon humidity
20%
30%
Humidity - Maximum monthly morning or afternoon humidity
55%
64%
Humidity - Minimum monthly morning or afternoon humidity
35%
34%
Precipitation - Yearly average
17.2 in
18.6 in
Snowfall - Yearly average
114 in
77 in
Clouds - Number of days clear of clouds
19.2%
21.2%
Sunshine amount - Average
75.6%
82.2%
Sunshine amount - Differences during a year
10%
10.5%
Sunshine amount - Maximum monthly
74%
79.7%
Sunshine amount - Minimum monthly
64%
69.2%
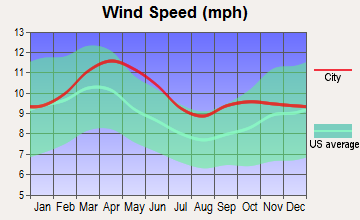
Wind speed - Average
8.6 mph
10.3 mph
Average climate in Northeast Jefferson, Colorado
Average climate in Colorado Springs, Colorado
Air pollution
Type
AQI
CO
NO2
OZONE
PB
PM10
PM25
SO2
Year
Northeast Jefferson
Colorado Springs
Northeast Jefferson
Colorado Springs
Northeast Jefferson
Colorado Springs
Northeast Jefferson
Northeast Jefferson
Colorado Springs
Northeast Jefferson
Colorado Springs
Northeast Jefferson
Colorado Springs
Northeast Jefferson
Colorado Springs
2018
104
60
0.40
N/A
22.3
N/A
34.9
N/A
N/A
N/A
29.2
N/A
8.4
6.3
0.7
N/A
2017
97
58
0.40
N/A
22.5
N/A
34.5
N/A
N/A
N/A
22.0
N/A
8.2
6.1
0.8
N/A
2016
90
48
0.44
N/A
24.4
N/A
34.3
N/A
N/A
N/A
22.6
N/A
7.8
6.9
1.0
N/A
2015
101
N/A
0.45
N/A
24.1
N/A
32.8
N/A
N/A
N/A
21.0
N/A
9.5
N/A
1.0
N/A
2014
94
N/A
0.45
N/A
23.4
N/A
33.1
N/A
N/A
N/A
25.0
N/A
10.1
N/A
1.3
N/A
2013
84
N/A
0.40
N/A
21.0
N/A
33.6
N/A
N/A
N/A
24.3
N/A
N/A
N/A
1.5
N/A
2012
91
N/A
0.34
N/A
18.9
N/A
33.4
N/A
N/A
N/A
24.4
N/A
N/A
N/A
1.3
N/A
2011
90
N/A
0.34
N/A
18.1
N/A
32.0
N/A
N/A
N/A
23.8
N/A
N/A
N/A
1.5
N/A
2010
79
N/A
0.42
N/A
16.3
N/A
29.2
N/A
N/A
N/A
26.5
N/A
N/A
N/A
1.0
N/A
2009
76
N/A
0.38
N/A
14.1
N/A
27.9
N/A
0.005
N/A
22.5
N/A
N/A
N/A
1.3
N/A
2008
85
N/A
0.42
N/A
17.3
N/A
30.8
N/A
0.008
N/A
25.5
N/A
N/A
N/A
1.6
N/A
2007
96
N/A
0.39
N/A
20.6
N/A
29.0
N/A
0.007
N/A
29.1
N/A
N/A
N/A
1.2
N/A
2006
89
15
0.46
0.50
19.0
N/A
29.5
N/A
0.027
0.005
28.0
N/A
N/A
N/A
1.4
N/A
2005
86
17
0.51
0.55
21.3
N/A
26.0
N/A
0.119
0.027
29.6
N/A
N/A
N/A
1.5
N/A
2004
82
17
0.53
0.56
21.2
N/A
24.2
N/A
0.043
0.010
28.6
N/A
N/A
N/A
1.8
N/A
2003
106
19
0.52
0.59
21.2
N/A
25.9
N/A
0.046
0.011
32.6
N/A
N/A
N/A
1.9
N/A
2002
86
24
0.60
0.66
19.2
N/A
25.6
N/A
0.031
0.010
35.7
N/A
N/A
N/A
2.4
N/A
2001
95
51
0.69
0.63
20.8
16.7
23.7
N/A
0.034
0.005
32.6
21.3
N/A
N/A
2.6
1.9
2000
94
78
0.70
0.58
11.7
22.5
24.5
N/A
0.037
0.010
12.2
21.0
N/A
N/A
2.1
2.3
Natural disasters
Type
Northeast Jefferson
Colorado Springs
Tornado activity compared to U.S. average
118.6%
78.4%
Earthquake activity compared to U.S. average
826.6%
816.1%
Natural disasters compared to U.S. average
12%
17%
Transportation
Both regions offer robust public transportation systems, but Northeast Jefferson is closer to Denver, making commuting easier for those who work in the city. Colorado Springs, however, has less traffic congestion, which might be more appealing for car owners.
Transport
Type
Northeast Jefferson
Colorado Springs
Amtrak stations
0
1
Amtrak stations nearby
1
1
FAA registered aircraft
0
552
FAA registered aircraft manufacturers and dealers
0
44
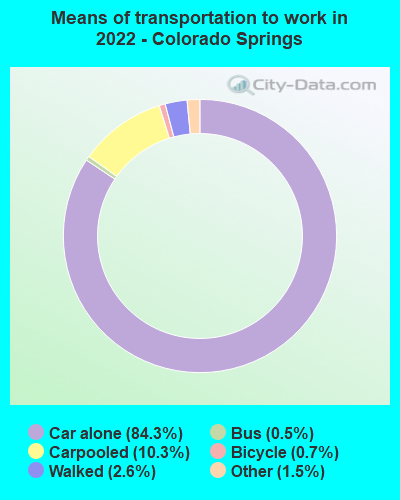
Means of transportation to work
Type
Northeast Jefferson
Colorado Springs
Bicycle
0.3%
0.3%
Bus
3.2%
0.4%
Carpooled
10%
9.2%
Car alone
80.3%
87%
Motorcycle
0.1%
0.1%
Taxicab
0.1%
0.1%
Walked
1.1%
2.1%
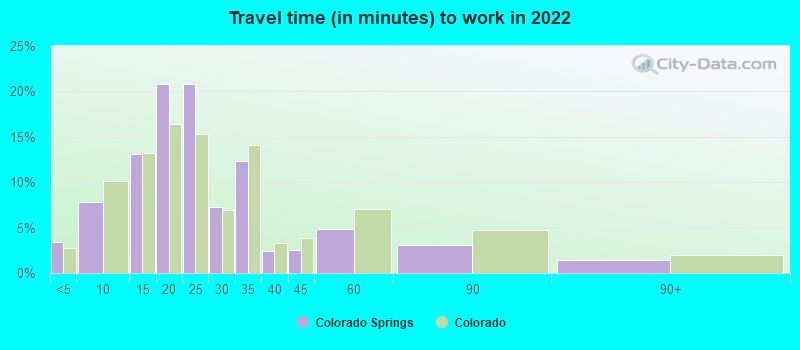
Average travel time to work
Type
Northeast Jefferson
Colorado Springs
Average
26.6 min
23.8 min
Real Estate
Real-estate is significantly pricier in Northeast Jefferson, reflecting its higher cost of living. Colorado Springs, however, offers more affordable real estate options, including single-family homes, apartments, and condominiums.
Neighborhoods
Northeast Jefferson is characterized by family-friendly neighborhoods with beautiful parks and community amenities. In contrast, Colorado Springs has a mix of urban and suburban neighborhoods with diverse architectural styles and access to recreational areas.
Houses and residents
Type
Northeast Jefferson
Colorado Springs
Houses
180,978
205,380
Average household size (people)
2.4
2.4
Houses occupied
176,726 (97.7%)
197,542 (96.2%)
Houses occupied by owners
125,208 (70.8%)
123,398 (62.5%)
Houses occupied by renters
51,518 (29.2%)
74,144 (37.5%)
Median rent asked for vacant for-rent units
$1,659
$1,458
Median price asked for vacant for-sale houses and condos
$884,573
$595,239
Estimated median house or condo value
$522,903
$390,500
Median number of rooms in apartments
4
4.1
Median number of rooms in houses and condos
7.3
7.2
Renting percentage
31.3%
39.9%
Housing density (houses/condos per square mile)
1,047.5
1,105.7
Household income disparities
40.7%
41%
Housing units without a mortgage
21,689 (19.3%)
1,835 (2.1%)
Housing units with both a second mortgage and home equity loan
469 (0.4%)
6,564 (7.3%)
Housing units with a mortgage
90,716 (80.7%)
87,580 (97.9%)
Housing units with a home equity loan
9,124 (8.1%)
86 (0.1%)
Housing units with a second mortgage
16,287 (14.5%)
7,898 (8.8%)
Housing units lacking complete kitchen facilities
0.6%
0.6%
Housing units lacking complete plumbing facilities
Self-employed workers in own not incorporated business
15,916
13,110
State government workers
7,028
7,029
Unpaid family workers
382
735
Industries and Occupations
The dominant industries in Northeast Jefferson include technology, healthcare, and retail. In contrast, Colorado Springs has a diverse economy with significant contributions from the defense, technology, tourism, and healthcare sectors.
Northeast Jefferson and Colorado Springs have excellent healthcare facilities. However, Jefferson has a larger number of healthcare providers which could offer more choices for healthcare services.
Health (county statistics)
Type
Northeast Jefferson
Colorado Springs
General health status score of residents in this county from 1 (poor) to 5 (excellent)
Infrastructure in Northeast Jefferson is highly developed with excellent road networks, public facilities, and utilities. In contrast, Colorado Springs has a commendable infrastructure, but some areas may not be as developed as Northeast Jefferson.
Infrastructure
Type
Northeast Jefferson
Colorado Springs
TV stations
19
18
Culture and Food
Both regions have a vibrant culture and food scene. Northeast Jefferson has a cosmopolitan feel with a variety of dining options, while Colorado Springs offers a mix of international cuisine and traditional American fare.
Sports Teams
Both regions support their local high school and college teams, but Northeast Jefferson residents have easy access to professional sports in Denver, such as the Broncos and the Nuggets.
 Northeast Jefferson, CO
 Colorado Springs, CO