Northeast Jefferson and South Aurora are two multifaceted locales nestled within Colorado's thriving landscape. With distinctive features including divergent crime rates, contrasting climates, differing costs of living, and unique educational opportunities, each location presents its own appeal. Whether it’s a vibrant and dynamic local economy, thriving industries, engaging cultural scene, or their own unique geographical features, both Northeast Jefferson and South Aurora exhibit the beauty and diversity of Colorado’s broad canvas.
Northeast Jefferson has a comparatively lower crime rate than South Aurora, making it generally safer. This represents an important factor for those considering relocation or even for tourists who prioritize safety during their trips. However, South Aurora, despite its relatively higher crime rate, still has several safe neighborhoods and dedicated law enforcement agencies working towards improving safety conditions.
Cost of Living
South Aurora generally has a higher cost of living compared to Northeast Jefferson. This is attributable to factors including higher property values, and a generally higher overall income level amongst the residents. On the other hand, Northeast Jefferson, due to its lower cost of living, can be seen as more affordable, particularly for families, retirees, or those looking to get more living space for their money.
Income Tax
There is a uniform state income tax rate imposed throughout Colorado, therefore both South Aurora and Northeast Jefferson residents are subject to the same state income tax.
Property Tax
Homeowners in South Aurora generally pay higher property taxes due to the city's higher real estate values. Northeast Jefferson has a lower property tax as it tends to have more affordable real estate.
Sales Tax
Both South Aurora and Northeast Jefferson fall under Colorado's sales tax system. South Aurora has a higher sales tax compared to Northeast Jefferson due to additional city taxes, which can impact cost of living considerations for both residents and visitors.
Income
Type
Northeast Jefferson
South Aurora
Estimated median household income
$91,025
$80,212
Estimated per capita income
$46,835
$39,129
Cost of living index (U.S. average is 100)
119.7
110.1
If you make $50,000 in South Aurora, you will have to make $54,360 in Northeast Jefferson to maintain the same standard of living.
Geographical Conditions
Both Northeast Jefferson and South Aurora boast beautiful scenery typical of Colorado, but the geographical conditions differ slightly due to their differing elevations. Northeast Jefferson, being slightly higher, can be cooler, while South Aurora offers milder weather with its lower altitude.
Geographical information
Type
Northeast Jefferson
South Aurora
Land area
172.8 sq. miles
78.4 sq. miles
Population density
2,615.1 people per sq. mile
4,199.1 people per sq. mile
Relative area comparison
Northeast Jefferson, CO South Aurora, CO
Education
Both Northeast Jefferson and South Aurora boast a number of reputable schools. However, educational institutions in South Aurora tend to have higher ratings, making it a favorable locale for families with school-aged children. Northeast Jefferson also offers robust educational opportunities, though they may not have the same notoriety when compared to those in South Aurora.
The economy of Northeast Jefferson is stable with robust employment opportunities across several sectors including technology, healthcare, and local government. South Aurora, comparably, is known for its vibrant economy with diversified employment opportunities in sectors like biotechnology, telecommunications, and healthcare.
Biggest Employers
In South Aurora, some of the biggest employers include the UCHealth system and Raytheon, a leading defense contractor. Northeast Jefferson also boasts a healthy employment landscape with the local government, and technology companies being significant employers.
In Northeast Jefferson (Jefferson County), 51.6% voted for Democrats and 46.7% for Republicans in 2012 Presidential Election. In South Aurora (Arapahoe County), 54.4% voted for Democrats and 44.4% for Republicans.
Elections
Type
Democrats
Republicans
Other
Year
Northeast Jefferson
South Aurora
Northeast Jefferson
South Aurora
Northeast Jefferson
South Aurora
2020
58.3%
61.3%
39.7%
36.6%
2.0%
2.1%
2016
49.2%
53.1%
42.3%
38.9%
8.6%
8.1%
2012
51.6%
54.4%
46.7%
44.4%
1.8%
1.3%
2008
54.0%
56.0%
44.9%
43.0%
1.1%
1.0%
2004
46.9%
47.6%
52.1%
51.6%
1.0%
0.8%
2000
43.0%
43.6%
51.1%
51.6%
5.9%
4.8%
1996
42.7%
41.9%
48.4%
50.8%
8.9%
7.3%
Breakdown of population affiliated with a religious congregation
Type
Adherents
Congregations
Religion
Northeast Jefferson
South Aurora
Northeast Jefferson
South Aurora
CATHOLIC CHURCH
15.0%
12.1%
5.1%
4.3%
EVANGELICAL LUTHERAN CHURCH IN AMERICA
1.7%
2.0%
4.2%
4.3%
SOUTHERN BAPTIST CONVENTION
1.2%
1.6%
7.5%
9.9%
LUTHERAN CHURCH
1.1%
1.0%
3.3%
2.6%
EPISCOPAL CHURCH
0.5%
0.4%
2.7%
1.7%
SEVENTH DAY ADVENTIST CHURCH
0.4%
0.2%
2.1%
2.6%
EVANGELICAL PRESBYTERIAN CHURCH
0.2%
0.6%
0.6%
2.6%
VINEYARD USA
0.2%
0.5%
0.6%
0.3%
MUSLIM ESTIMATE
0.1%
1.9%
0.6%
1.0%
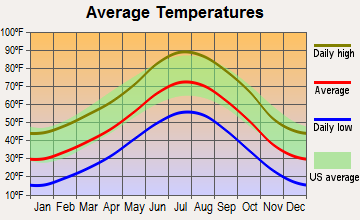
Weather
Colorado is known for its unique weather patterns, and both Northeast Jefferson and South Aurora experience all four seasons. However, Northeast Jefferson, due to its slightly higher elevation, tends to be slightly cooler than South Aurora, particularly during the winter. South Aurora, given its lower altitude, has milder and shorter winters, which can be a pull factor for those who appreciate more benign weather conditions.
Weather and climate
Type
Northeast Jefferson
South Aurora
Temperature - Average
47.9°F
49.9°F
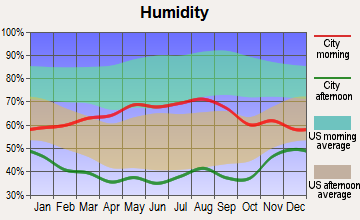
Humidity - Average morning or afternoon humidity
50.6%
50.6%
Humidity - Differences between morning and afternoon humidity
20%
20%
Humidity - Maximum monthly morning or afternoon humidity
55%
55%
Humidity - Minimum monthly morning or afternoon humidity
35%
35%
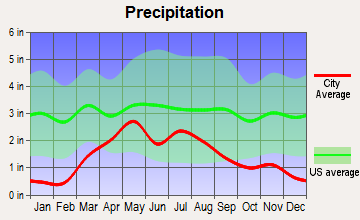
Precipitation - Yearly average
17.2 in
17.6 in
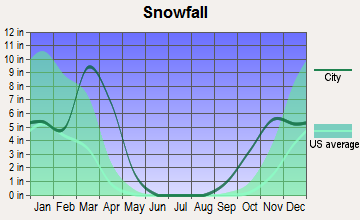
Snowfall - Yearly average
114 in
114 in
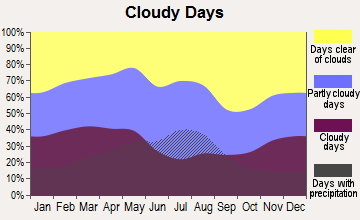
Clouds - Number of days clear of clouds
19.2%
19.2%
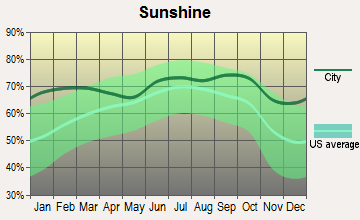
Sunshine amount - Average
75.6%
75.6%
Sunshine amount - Differences during a year
10%
10%
Sunshine amount - Maximum monthly
74%
74%
Sunshine amount - Minimum monthly
64%
64%
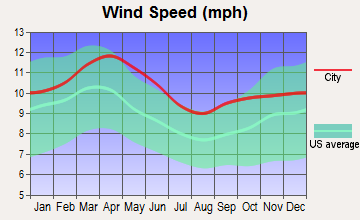
Wind speed - Average
8.6 mph
8.6 mph
Average climate in Northeast Jefferson, Colorado
Average climate in South Aurora, Colorado
Air pollution
Type
AQI
CO
NO2
OZONE
PB
PM10
PM25
SO2
Year
Northeast Jefferson
South Aurora
Northeast Jefferson
South Aurora
Northeast Jefferson
South Aurora
Northeast Jefferson
South Aurora
Northeast Jefferson
South Aurora
Northeast Jefferson
South Aurora
Northeast Jefferson
South Aurora
Northeast Jefferson
South Aurora
2018
104
99
0.40
0.37
22.3
21.6
34.9
31.9
N/A
N/A
29.2
29.2
8.4
8.5
0.7
0.7
2017
97
95
0.40
0.37
22.5
22.0
34.5
31.8
N/A
N/A
22.0
22.0
8.2
8.4
0.8
0.9
2016
90
90
0.44
0.43
24.4
24.0
34.3
31.3
N/A
N/A
22.6
22.6
7.8
8.1
1.0
1.0
2015
101
101
0.45
0.44
24.1
23.0
32.8
30.2
N/A
N/A
21.0
20.6
9.5
9.6
1.0
1.1
2014
94
94
0.45
0.43
23.4
22.0
33.1
30.3
N/A
N/A
25.0
22.7
10.1
10.1
1.3
1.3
2013
84
84
0.40
0.39
21.0
19.7
33.6
30.7
N/A
N/A
24.3
22.0
N/A
N/A
1.5
1.4
2012
91
90
0.34
0.34
18.9
18.9
33.4
31.4
N/A
N/A
24.4
24.3
N/A
N/A
1.3
1.2
2011
90
91
0.34
0.34
18.1
18.1
32.0
31.5
N/A
N/A
23.8
23.8
N/A
N/A
1.5
1.5
2010
79
81
0.42
0.41
16.3
16.3
29.2
29.3
N/A
N/A
26.5
26.6
N/A
N/A
1.0
1.0
2009
76
79
0.38
0.37
14.1
14.1
27.9
27.3
0.005
0.005
22.5
22.6
N/A
N/A
1.3
1.3
2008
85
85
0.42
0.41
17.3
17.3
30.8
29.1
0.008
0.008
25.5
25.5
N/A
N/A
1.6
1.6
2007
96
96
0.39
0.41
20.6
20.6
29.0
25.7
0.007
0.007
29.1
28.9
N/A
N/A
1.2
1.2
2006
89
89
0.46
0.50
19.0
19.0
29.5
25.4
0.027
0.026
28.0
28.0
N/A
N/A
1.4
1.4
2005
86
86
0.51
0.57
21.3
21.3
26.0
22.7
0.119
0.106
29.6
29.6
N/A
N/A
1.5
1.5
2004
82
82
0.53
0.61
21.2
21.2
24.2
21.6
0.043
0.035
28.6
28.6
N/A
N/A
1.8
1.8
2003
106
106
0.52
0.61
21.2
21.2
25.9
23.4
0.046
0.038
32.6
32.6
N/A
N/A
1.9
1.9
2002
86
86
0.60
0.64
19.2
19.2
25.6
23.0
0.031
0.027
35.7
35.7
N/A
N/A
2.4
2.5
2001
95
95
0.69
0.79
20.8
23.8
23.7
20.8
0.034
0.029
32.6
32.6
N/A
N/A
2.6
2.6
2000
94
93
0.70
0.77
11.7
13.7
24.5
21.7
0.037
0.032
12.2
12.2
N/A
N/A
2.1
2.1
Natural disasters
Type
Northeast Jefferson
South Aurora
Tornado activity compared to U.S. average
118.6%
137.7%
Earthquake activity compared to U.S. average
826.6%
797.1%
Natural disasters compared to U.S. average
12%
10%
Transportation
Both South Aurora and Northeast Jefferson have robust transportation systems. South Aurora, being larger and more populated, has a more comprehensive public transportation system. Northeast Jefferson, although smaller, also offers ample commuting options, including bus routes and a network of well-maintained roads and highways.
Transport
Type
Northeast Jefferson
South Aurora
Amtrak stations nearby
1
2
Means of transportation to work
Type
Northeast Jefferson
South Aurora
Bicycle
0.3%
0.2%
Bus
3.2%
3.5%
Carpooled
10%
12%
Car alone
80.3%
78.6%
Motorcycle
0.1%
0.1%
Walked
1.1%
1.3%
Average travel time to work
Type
Northeast Jefferson
South Aurora
Average
26.6 min
27.5 min
Real Estate
The real estate market in South Aurora tends to be more expensive, with higher property values compared to Northeast Jefferson. Potential homeowners may find more affordable housing options in Northeast Jefferson, which also boasts lower property taxes.
Neighborhoods
South Aurora hosts a range of sought-after neighborhoods characterized by well-kept homes, abundant green spaces, and modern amenities. Northeast Jefferson, on the other hand, is renowned for its classic Colorado charm, with peaceful neighborhoods that offer a more relaxed lifestyle.
Houses and residents
Type
Northeast Jefferson
South Aurora
Houses
180,978
119,373
Average household size (people)
2.4
2.6
Houses occupied
176,726 (97.7%)
115,977 (97.2%)
Houses occupied by owners
125,208 (70.8%)
76,163 (65.7%)
Houses occupied by renters
51,518 (29.2%)
39,814 (34.3%)
Median rent asked for vacant for-rent units
$1,659
$1,519
Median price asked for vacant for-sale houses and condos
$884,573
$836,561
Estimated median house or condo value
$522,903
$439,151
Median number of rooms in apartments
4
3.9
Median number of rooms in houses and condos
7.3
7.2
Renting percentage
31.3%
38.4%
Housing density (houses/condos per square mile)
1,047.5
1,522.9
Household income disparities
40.7%
40.8%
Housing units without a mortgage
21,689 (19.3%)
6,903 (10.6%)
Housing units with both a second mortgage and home equity loan
469 (0.4%)
358 (0.6%)
Housing units with a mortgage
90,716 (80.7%)
57,942 (89.4%)
Housing units with a home equity loan
9,124 (8.1%)
5,373 (8.3%)
Housing units with a second mortgage
16,287 (14.5%)
10,116 (15.6%)
Housing units lacking complete kitchen facilities
0.6%
0.4%
Housing units lacking complete plumbing facilities
0.3%
0.4%
Housing units in structures
Housing units in structures
Northeast Jefferson
South Aurora
One, detached
63.9%
52.4%
One, attached
9.2%
11.6%
Two
1.4%
0.6%
3 or 4
3.2%
3.5%
5 to 9
5.3%
6.9%
10 to 19
6.7%
10.6%
20 to 49
5.5%
5.9%
50 or more
4.0%
7.7%
Mobile homes
0.7%
0.7%
Median real estate property taxes paid for housing units
Self-employed workers in own not incorporated business
15,916
8,665
State government workers
7,028
4,200
Unpaid family workers
382
351
Industries and Occupations
Diverse industries thrive in both Northeast Jefferson and South Aurora. In South Aurora, there is a strong presence of sectors like biotechnology, telecom services, and healthcare. Northeast Jefferson, on the other hand, witnesses a higher representation from sectors such as technology, local government, and healthcare.
Both South Aurora and Northeast Jefferson offer good access to healthcare services. South Aurora, hosting UCHealth system, has advanced healthcare facilities. Northeast Jefferson, while smaller, also possesses a robust healthcare system with ample facilities and practitioners.
Health (county statistics)
Type
Northeast Jefferson
South Aurora
General health status score of residents in this county from 1 (poor) to 5 (excellent)
In terms of infrastructure, South Aurora tends to be more developed, boasting a range of modern amenities, retail spaces, and recreational facilities. Northeast Jefferson, although not as robustly developed, offers a laid-back environment with functional infrastructure and recreational options appropriate to its smaller size and population.
Infrastructure
Type
Northeast Jefferson
South Aurora
TV stations
19
14
Culture and Food
South Aurora boasts a more cosmopolitan culture, with a diverse food scene, art galleries, and a vibrant nightlife. Northeast Jefferson presents a laid-back culture, with the emphasis on outdoor activities, family-friendly events, and local eateries.
Sports Teams
Both cities enjoy Colorado's robust sports scene. While neither South Aurora nor Northeast Jefferson hosts professional sports franchises, their proximity to Denver allows residents easy access to professional sports games, including the Denver Broncos, Colorado Avalanche, Nuggets, and Rockies.
 Northeast Jefferson, CO
 South Aurora, CO