Northeast Tarrant and Arlington are both vibrant areas within the great state of Texas, each offering unique advantages for both residents and tourists. While Northeast Tarrant is a smaller, suburban region known for its low crime rate and excellent education system, Arlington is known for its sports teams, diverse food culture, and robust economy. The decision between the two ultimately depends on individual lifestyle and personal preferences.
When it comes to safety, both regions have emphasis on keeping their communities safe. Crime rates in Northeast Tarrant tend to be lower than the national average, and considerably less than Arlington. Arlington, however, takes pride in their responsive police force and well-implemented safety programs. Tourists and potential residents can feel secure in both cities due to their focus on community safety.
Cost of Living
Arlington's cost of living is marginally lower when compared to Northeast Tarrant. The cost of goods, services, transportation, and housing are typically lower here, which can be a positive for those looking to relocate or for tourists looking for an affordable Texas experience.
Income Tax
In terms of income tax, there is no state income tax in Texas which applies to both Arlington and Northeast Tarrant.
Property Tax
Arlington has a slightly higher property tax rate when compared to Northeast Tarrant.
Sales Tax
Both Arlington and Northeast Tarrant share the same sales tax rate as per Texas state law.
Income
Type
Northeast Tarrant
Arlington
Estimated median household income
$90,881
$59,889
Estimated per capita income
$45,353
$31,722
Cost of living index (U.S. average is 100)
102
95.9
If you make $50,000 in Arlington, you will have to make $53,180 in Northeast Tarrant to maintain the same standard of living.
Geographical Conditions
Both Northeast Tarrant and Arlington are located in the Dallas-Fort Worth area and have similar geographical conditions, with flat terrain and proximity to the Trinity River.
Geographical information
Type
Northeast Tarrant
Arlington
Land area
206.9 sq. miles
95.8 sq. miles
Population density
2,284.3 people per sq. mile
4,099.3 people per sq. mile
Relative area comparison
Northeast Tarrant, TX Arlington, TX
Education
Northeast Tarrant excels in the education sector with highly-rated schools and numerous educational opportunities. It is a great place for families with children. Arlington also has solid school options, but Northeast Tarrant consistently ranks higher.
Economically speaking, both areas have strong job markets with Arlington having a slight edge. Major sectors in Arlington include education, healthcare, and manufacturing, while Northeast Tarrant has prospers in areas such as technology and finance.
Biggest Employers
Arlington is home to some well-known large employers including the Arlington Independent School District, the University of Texas at Arlington, and the Texas Health Resources. In Northeast Tarrant, Sabre Holdings and Fidelity Investments are among the biggest employers.
Weather
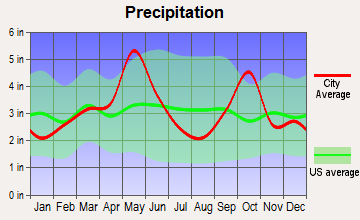
On the weather front, people living in both Northeast Tarrant and Arlington can expect a warm southern climate. Arlington experiences slightly more rainfall annually, which can be seen as a positive or negative depending on personal preference. The occasional tornado may also appear in either area due to their location within Tornado Alley.
Weather and climate
Type
Northeast Tarrant
Arlington
Temperature - Average
64.6°F
65°F
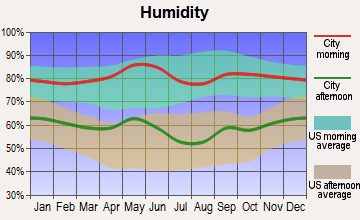
Humidity - Average morning or afternoon humidity
71.3%
71.4%
Humidity - Differences between morning and afternoon humidity
34%
34%
Humidity - Maximum monthly morning or afternoon humidity
82%
82%
Humidity - Minimum monthly morning or afternoon humidity
48%
48%
Precipitation - Yearly average
37.2 in
37.9 in
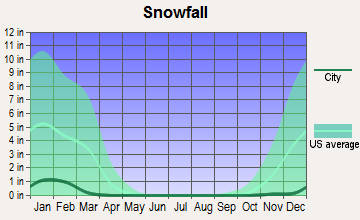
Snowfall - Yearly average
4.2 in
4.2 in
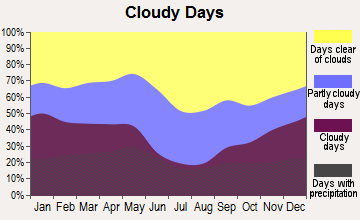
Clouds - Number of days clear of clouds
22.8%
22.7%
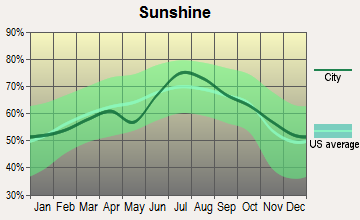
Sunshine amount - Average
66.6%
66.6%
Sunshine amount - Differences during a year
20%
20%
Sunshine amount - Maximum monthly
74%
74%
Sunshine amount - Minimum monthly
54%
54%
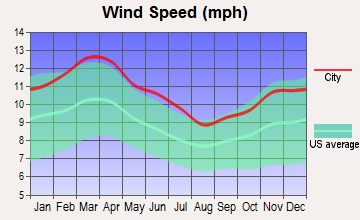
Wind speed - Average
10.3 mph
10.3 mph
Average climate in Northeast Tarrant, Texas
Average climate in Arlington, Texas
Air pollution
Type
AQI
CO
NO2
OZONE
PM25
SO2
Year
Northeast Tarrant
Arlington
Northeast Tarrant
Arlington
Northeast Tarrant
Arlington
Northeast Tarrant
Arlington
Northeast Tarrant
Arlington
Northeast Tarrant
Arlington
2018
86
86
N/A
N/A
5.8
5.8
27.9
27.1
9.2
9.4
0.4
0.4
2017
84
86
N/A
N/A
5.9
6.2
28.0
27.2
8.6
9.1
0.3
0.3
2016
75
76
N/A
N/A
6.2
6.3
26.4
25.5
8.2
8.2
0.2
0.2
2015
81
80
N/A
N/A
6.5
6.5
25.7
24.8
8.5
8.6
0.3
0.3
2014
77
78
0.22
0.22
6.6
6.8
27.1
26.6
9.4
9.3
0.3
0.3
2013
95
96
0.25
0.25
6.8
6.4
28.0
27.2
11.3
11.0
0.2
0.2
2012
108
108
0.26
0.26
8.1
7.8
30.7
30.3
10.8
10.5
0.3
0.3
2011
98
96
0.23
0.23
8.0
8.2
30.8
30.7
10.2
9.5
0.6
0.6
2010
76
76
0.23
0.23
8.7
8.9
28.0
27.7
8.5
8.4
0.7
0.7
2009
93
91
0.25
0.25
8.9
8.7
29.1
29.5
8.7
8.5
0.5
0.5
2008
89
92
0.25
0.25
9.7
9.6
27.5
25.8
9.4
10.7
0.5
0.5
2007
91
95
0.30
0.30
10.8
10.6
25.1
24.6
9.7
9.8
0.3
0.5
2006
99
102
0.34
0.34
10.6
10.4
30.2
29.7
9.5
9.9
0.7
0.8
2005
109
110
0.34
0.34
12.3
11.7
29.1
28.4
10.7
11.3
0.9
1.0
2004
90
90
0.39
0.39
11.6
10.8
25.7
25.4
N/A
N/A
0.8
0.9
2003
97
97
0.40
0.40
12.3
11.1
27.2
27.2
N/A
N/A
1.0
1.0
2002
97
97
0.37
0.37
13.0
11.8
25.4
25.8
N/A
N/A
0.4
0.6
2001
88
88
0.48
0.48
14.3
14.7
26.0
25.0
N/A
N/A
1.0
1.1
2000
104
104
0.55
0.55
14.5
14.5
27.1
26.2
N/A
N/A
1.1
1.3
Natural disasters
Type
Northeast Tarrant
Arlington
Tornado activity compared to U.S. average
252.8%
254.3%
Earthquake activity compared to U.S. average
578.9%
558.3%
Natural disasters compared to U.S. average
23%
23%
Transportation
Arlington has a more developed public transit system with buses and, a rail service. Northeast Tarrant relies more on roadway commuting, but has easy access to the Dallas/Fort Worth International Airport.
Transport
Type
Northeast Tarrant
Arlington
Amtrak stations nearby
1
2
FAA registered aircraft
0
362
FAA registered aircraft manufacturers and dealers
0
5
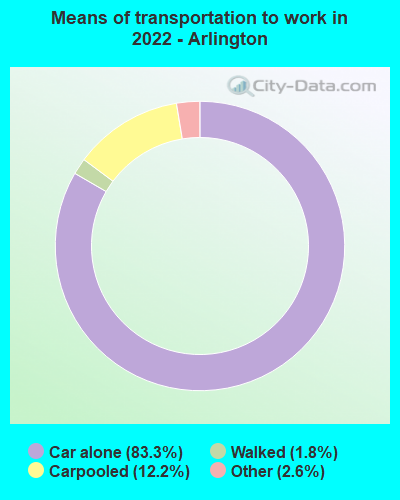
Means of transportation to work
Type
Northeast Tarrant
Arlington
Bicycle
0.2%
0.2%
Carpooled
9.8%
11.9%
Car alone
84.8%
85%
Motorcycle
0.1%
0.1%
Walked
0.9%
1.4%
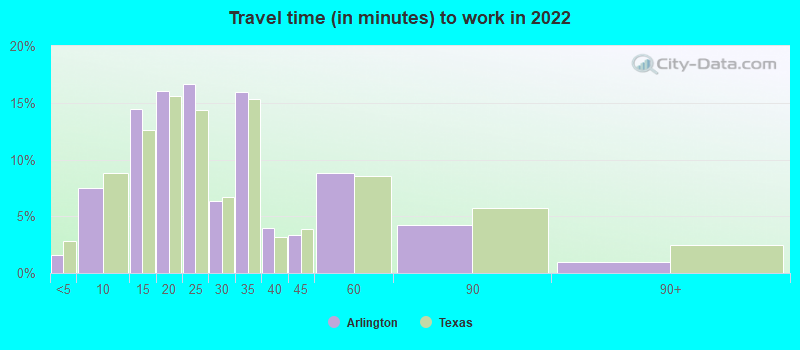
Average travel time to work
Type
Northeast Tarrant
Arlington
Average
26.8 min
26.1 min
Real Estate
Real estate costs are generally higher in Northeast Tarrant as compared to Arlington. There is a variety of housing types in both areas, ranging from single-family homes to condominiums and apartments.
Neighborhoods
Northeast Tarrant boasts safe, family-friendly neighborhoods with great schools. Arlington, on the other hand, offers a mix of suburban and urban living with diverse neighborhoods to match its diverse population.
Houses and residents
Type
Northeast Tarrant
Arlington
Houses
155,788
156,653
Average household size (people)
2.7
2.7
Houses occupied
149,489 (96%)
146,888 (93.8%)
Houses occupied by owners
101,491 (67.9%)
78,883 (53.7%)
Houses occupied by renters
47,998 (32.1%)
68,005 (46.3%)
Median rent asked for vacant for-rent units
$1,297
$1,609
Median price asked for vacant for-sale houses and condos
$288,870
$199,415
Estimated median house or condo value
$337,949
$254,700
Median number of rooms in apartments
4.1
4.1
Median number of rooms in houses and condos
6.5
6.5
Renting percentage
32.5%
42.6%
Housing density (houses/condos per square mile)
752.8
1,634.9
Household income disparities
38.7%
43.9%
Housing units without a mortgage
18,262 (19.1%)
948 (2%)
Housing units with both a second mortgage and home equity loan
88 (0.1%)
1,684 (3.6%)
Housing units with a mortgage
77,313 (80.9%)
46,456 (98%)
Housing units with a home equity loan
4,029 (4.2%)
0 (0%)
Housing units with a second mortgage
5,649 (5.9%)
1,967 (4.1%)
Housing units lacking complete kitchen facilities
0.4%
1.7%
Housing units lacking complete plumbing facilities
Self-employed workers in own not incorporated business
11,886
10,953
State government workers
4,379
6,771
Unpaid family workers
466
396
Industries and Occupations
Both locations are host to diverse industries and occupations. Northeast Tarrant leans more towards technology and finance, while Arlington’s economy is diverse with jobs in education, healthcare, and manufacturing.
Health Care
Both areas offer good healthcare options with well-equipped hospitals and medical facilities. Arlington, with its larger population, has a wider range of healthcare services available.
Infrastructure
In terms of infrastructure, Arlington offers robust public spaces, parks, stadiums and a developed downtown area. Northeast Tarrant, while smaller, also boasts well-maintained municipal facilities, roads, and public spaces.
Infrastructure
Type
Northeast Tarrant
Arlington
TV stations
25
25
Culture and Food
Arlington excels in cultural diversity with a wide variety of cuisines available. Northeast Tarrant has a growing food scene, but Arlington stands out as the foodie destination between the two.
Sports Teams
When it comes to sports, Arlington houses the Dallas Cowboys and Texas Rangers. Northeast Tarrant doesn't host any professional teams, but offers a range of youth and amateur sports leagues.
 Northeast Tarrant, TX
 Arlington, TX