Northeast Tarrant and Denton are both appealing Texas locations, though they offer distinct lifestyle options. While Northeast Tarrant is a mix of urban and suburban, Denton offers a lively college town atmosphere. We'll delve into key comparisons including crime/safety, cost of living, education, work and economy, infrastructure, and more. Whether you're considering relocation or planning a visit, this comparison will provide you with the insights you need.
For anyone considering a move or visiting Texas, safety is a significant concern. Northeast Tarrant has lower crime rates than Denton, making it a safer environment overall. While both are safer than some urban centers, Northeast Tarrant offers additional peace of mind.
Cost of Living
Living cost is relatively higher in Northeast Tarrant due to housing and rental prices. However, Denton residents grapple with higher education-related costs due to its university-town status. Both cities though have a cost of living below the national average.
Income Tax
Texas does not impose a state income tax, benefiting residents of both Denton and Northeast Tarrant.
Property Tax
Property taxes in both regions are on par with the statewide Texas norm, which trends above the national average.
Sales Tax
Both Denton and Northeast Tarrant are subject to Texas's overall sales tax rate of 6.25%, often with additional local rates applying.
Income
Type
Northeast Tarrant
Denton
Estimated median household income
$90,881
$64,873
Estimated per capita income
$45,353
$33,743
Cost of living index (U.S. average is 100)
102
94.9
If you make $50,000 in Denton, you will have to make $53,741 in Northeast Tarrant to maintain the same standard of living.
Geographical Conditions
Both cities offer a blend of urban and suburban landscapes. Northeast Tarrant is closer to the Dallas-Fort Worth metroplex, while Denton is a standalone city offering a more relaxed pace.
Geographical information
Type
Northeast Tarrant
Denton
Land area
206.9 sq. miles
61.5 sq. miles
Population density
2,284.3 people per sq. mile
2,409.1 people per sq. mile
Relative area comparison
Northeast Tarrant, TX Denton, TX
Education
When it comes to education, Denton is home to two major universities, Texas Woman's University and The University of North Texas, making it an academic hub. In contrast, Northeast Tarrant hosts numerous quality K-12 schools but lacks the university presence of Denton.
Denton's economy largely relies on education, retail, and healthcare, given the presence of universities and healthcare facilities. Northeast Tarrant, on the other hand, benefits from its proximity to Fort Worth and Dallas providing more diverse job opportunities in finance, logistics, and tech industries.
Biggest Employers
In Northeast Tarrant, some of the biggest employers are bank of America, Texas Health Resources, and Lockheed Martin. In Denton, the University of North Texas and Texas Women's University are dominant employers.
In Northeast Tarrant (Tarrant County), 41.4% voted for Democrats and 57.1% for Republicans in 2012 Presidential Election. In Denton (Denton County), 33.4% voted for Democrats and 64.9% for Republicans.
Elections
Type
Democrats
Republicans
Other
Year
Northeast Tarrant
Denton
Northeast Tarrant
Denton
Northeast Tarrant
Denton
2020
49.3%
45.2%
49.1%
53.3%
1.6%
1.6%
2016
43.2%
37.2%
51.8%
57.2%
5.0%
5.6%
2012
41.4%
33.4%
57.1%
64.9%
1.4%
1.7%
2008
43.8%
37.5%
55.5%
61.8%
0.7%
0.7%
2004
37.0%
29.5%
62.5%
70.0%
0.5%
0.5%
2000
36.9%
27.4%
60.9%
69.7%
2.3%
2.9%
1996
41.6%
32.4%
50.9%
58.5%
7.5%
9.1%
Breakdown of population affiliated with a religious congregation
Type
Adherents
Congregations
Religion
Northeast Tarrant
Denton
Northeast Tarrant
Denton
SOUTHERN BAPTIST CONVENTION
17.3%
17.1%
33.3%
28.9%
CATHOLIC CHURCH
11.1%
6.7%
1.9%
1.8%
MUSLIM ESTIMATE
2.2%
1.2%
0.9%
0.9%
LUTHERAN CHURCH
0.5%
0.6%
0.9%
1.1%
SEVENTH DAY ADVENTIST CHURCH
0.4%
0.1%
1.6%
1.1%
EPISCOPAL CHURCH
0.3%
0.6%
0.8%
1.4%
EVANGELICAL LUTHERAN CHURCH IN AMERICA
0.3%
0.4%
0.9%
1.1%
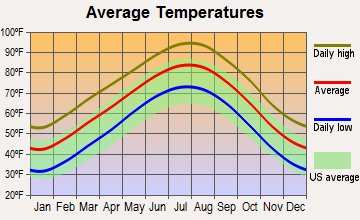
Weather
Both Denton and Northeast Tarrant have typical Texas climates featuring hot summers and mild winters. Denton is slightly cooler due to its geographical location, but both cities are prone to periodic severe weather conditions such as thunderstorms and tornadoes.
Weather and climate
Type
Northeast Tarrant
Denton
Temperature - Average
64.6°F
63.9°F
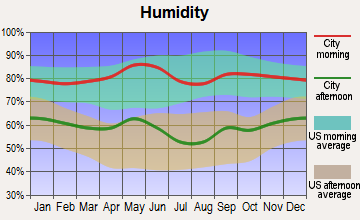
Humidity - Average morning or afternoon humidity
71.3%
71.3%
Humidity - Differences between morning and afternoon humidity
34%
34.1%
Humidity - Maximum monthly morning or afternoon humidity
82%
82.1%
Humidity - Minimum monthly morning or afternoon humidity
48%
47.9%
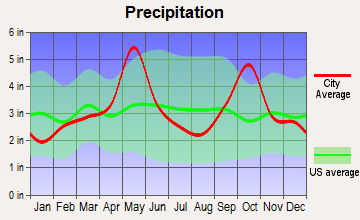
Precipitation - Yearly average
37.2 in
38.1 in
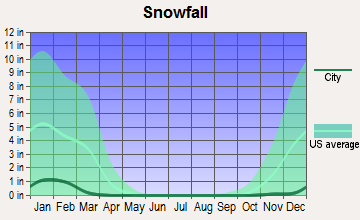
Snowfall - Yearly average
4.2 in
4.3 in
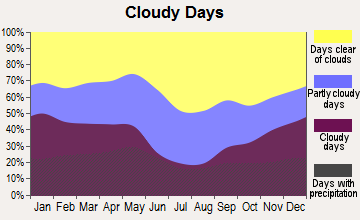
Clouds - Number of days clear of clouds
22.8%
22.8%
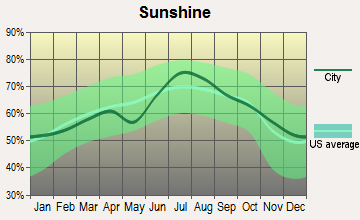
Sunshine amount - Average
66.6%
66.6%
Sunshine amount - Differences during a year
20%
20%
Sunshine amount - Maximum monthly
74%
74%
Sunshine amount - Minimum monthly
54%
54%
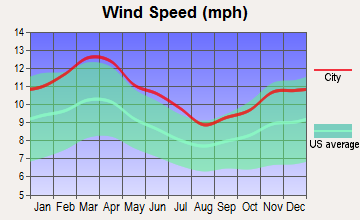
Wind speed - Average
10.3 mph
10.3 mph
Average climate in Northeast Tarrant, Texas
Average climate in Denton, Texas
Air pollution
Type
AQI
CO
NO2
OZONE
PB
PM25
SO2
Year
Northeast Tarrant
Denton
Northeast Tarrant
Northeast Tarrant
Denton
Northeast Tarrant
Denton
Denton
Northeast Tarrant
Denton
Northeast Tarrant
2018
86
75
N/A
N/A
5.8
N/A
27.9
30.5
N/A
N/A
9.2
7.9
0.4
N/A
2017
84
75
N/A
N/A
5.9
N/A
28.0
31.3
N/A
N/A
8.6
7.8
0.3
N/A
2016
75
74
N/A
N/A
6.2
N/A
26.4
30.1
N/A
N/A
8.2
7.7
0.2
N/A
2015
81
78
N/A
N/A
6.5
N/A
25.7
30.3
N/A
N/A
8.5
8.0
0.3
N/A
2014
77
80
0.22
N/A
6.6
N/A
27.1
31.4
N/A
N/A
9.4
8.5
0.3
N/A
2013
95
88
0.25
N/A
6.8
N/A
28.0
33.1
N/A
N/A
11.3
8.9
0.2
N/A
2012
108
96
0.26
N/A
8.1
N/A
30.7
34.0
N/A
N/A
10.8
8.9
0.3
N/A
2011
98
99
0.23
N/A
8.0
7.9
30.8
35.2
N/A
N/A
10.2
8.7
0.6
N/A
2010
76
80
0.23
N/A
8.7
7.5
28.0
32.0
N/A
N/A
8.5
8.5
0.7
N/A
2009
93
87
0.25
N/A
8.9
N/A
29.1
32.2
N/A
N/A
8.7
8.7
0.5
N/A
2008
89
85
0.25
N/A
9.7
N/A
27.5
32.5
0.121
N/A
9.4
9.4
0.5
N/A
2007
91
92
0.30
N/A
10.8
N/A
25.1
29.3
0.070
N/A
9.7
9.7
0.3
N/A
2006
99
108
0.34
N/A
10.6
N/A
30.2
34.2
0.106
N/A
9.5
9.5
0.7
N/A
2005
109
100
0.34
N/A
12.3
N/A
29.1
33.6
0.142
N/A
10.7
10.6
0.9
N/A
2004
90
78
0.39
N/A
11.6
N/A
25.7
29.9
0.099
N/A
N/A
N/A
0.8
N/A
2003
97
89
0.40
N/A
12.3
N/A
27.2
31.1
0.121
N/A
N/A
N/A
1.0
N/A
2002
97
86
0.37
N/A
13.0
N/A
25.4
30.6
0.080
N/A
N/A
N/A
0.4
N/A
2001
88
93
0.48
N/A
14.3
N/A
26.0
31.7
0.069
N/A
N/A
N/A
1.0
N/A
2000
104
102
0.55
N/A
14.5
N/A
27.1
32.8
0.092
N/A
N/A
N/A
1.1
N/A
Natural disasters
Type
Northeast Tarrant
Denton
Tornado activity compared to U.S. average
252.8%
247.6%
Earthquake activity compared to U.S. average
578.9%
621.2%
Natural disasters compared to U.S. average
23%
18%
Transportation
Denton, being a smaller city, provides good bike-ability and the Denton County Transportation Authority runs buses and a commuter rail. Northeast Tarrant has robust highway connectivity and access to Dallas-Fort Worth International Airport.
Transport
Type
Northeast Tarrant
Denton
Amtrak stations nearby
1
0
FAA registered aircraft
0
357
FAA registered aircraft manufacturers and dealers
0
6
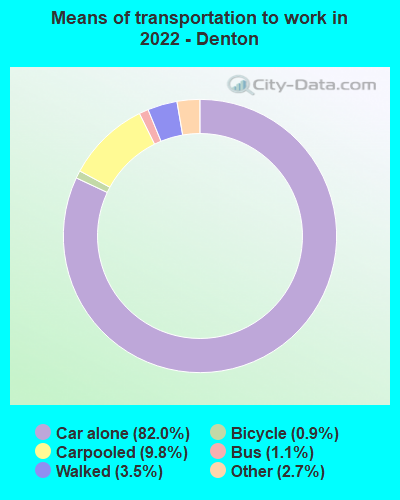
Means of transportation to work
Type
Northeast Tarrant
Denton
Bicycle
0.2%
0.5%
Bus
0%
0.9%
Carpooled
9.8%
11.2%
Car alone
84.8%
82.1%
Motorcycle
0.1%
0.2%
Walked
0.9%
3.4%
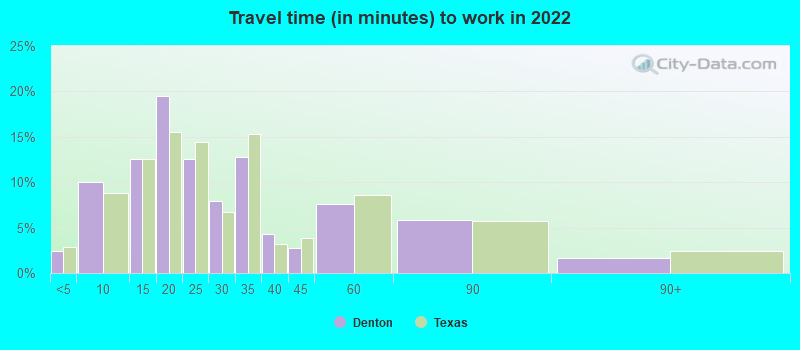
Average travel time to work
Type
Northeast Tarrant
Denton
Average
26.8 min
26.2 min
Real Estate
Real estate in Northeast Tarrant is generally pricier compared to Denton, largely due to higher demand and proximity to Dallas-Fort Worth.
Neighborhoods
Northeast Tarrant hosts upscale neighborhoods with amenities within easy reach. Denton's neighborhoods have a more eclectic mix, including student-populated areas, historic districts, and family-friendly suburbs.
Houses and residents
Type
Northeast Tarrant
Denton
Houses
155,788
61,038
Average household size (people)
2.7
2.5
Houses occupied
149,489 (96%)
57,963 (95%)
Houses occupied by owners
101,491 (67.9%)
27,294 (47.1%)
Houses occupied by renters
47,998 (32.1%)
30,669 (52.9%)
Median rent asked for vacant for-rent units
$1,297
$1,397
Median price asked for vacant for-sale houses and condos
$288,870
$155,749
Estimated median house or condo value
$337,949
$288,300
Median number of rooms in apartments
4.1
4
Median number of rooms in houses and condos
6.5
6.4
Renting percentage
32.5%
53.6%
Housing density (houses/condos per square mile)
752.8
992.6
Household income disparities
38.7%
46.1%
Housing units without a mortgage
18,262 (19.1%)
84 (0.5%)
Housing units with both a second mortgage and home equity loan
88 (0.1%)
500 (2.8%)
Housing units with a mortgage
77,313 (80.9%)
17,647 (99.5%)
Housing units with a home equity loan
4,029 (4.2%)
55 (0.3%)
Housing units with a second mortgage
5,649 (5.9%)
626 (3.5%)
Housing units lacking complete kitchen facilities
0.4%
2.8%
Housing units lacking complete plumbing facilities
Self-employed workers in own not incorporated business
11,886
3,945
State government workers
4,379
7,062
Unpaid family workers
466
0
Industries and Occupations
Major industries in Northeast Tarrant include healthcare, education, and financial services. Conversely, Denton's economy is strongly associated with higher education, healthcare, and commerce linked to its student population.
Both Denton and Northeast Tarrant provide quality healthcare systems. Denton's hospitals are teaching-centered due to the university influence, while Northeast Tarrant steps up with trauma centers and a broader range of specialty clinics.
Northeast Tarrant's infrastructural growth outstrips Denton's, especially in transportation, due to its closer proximity to major metros like Dallas and Fort Worth.
Infrastructure
Type
Northeast Tarrant
Denton
TV stations
25
21
Culture and Food
While Denton boasts a vibrant arts scene and celebrated indie music, Northeast Tarrant offers a mix of cultural attractions in nearby Dallas and Fort Worth. For food enthusiasts, both cities offer a blend of traditional southern cuisine and Mexican-inspired dishes.
Sports Teams
Neither city hosts major sports teams, but Northeast Tarrant's closer proximity to Dallas grants easier access to pro sports venues.
 Northeast Tarrant, TX
 Denton, TX