Comparing Northeast Tarrant and Frisco in Texas involves considering a variety of factors. Both cities have their own unique offerings in terms of quality of life, cost of living, education, and employment opportunities. While Northeast Tarrant is known for its safe neighborhoods and flourishing industries, Frisco is noted for its fast-growing local economy and high-quality education. Here, we critically examine and contrast the two cities in several important life facets to offer a comprehensive view.
Northeast Tarrant enjoys a lower crime rate compared to the national average, making it a generally safe area to live. On the other hand, Frisco is consistently ranked as one of the safest cities in the country, having lower crime rates than Northeast Tarrant. For tourists, both cities provide safe environments. They have efficient public safety departments that ensure swift response to emergencies.
Cost of Living
When it comes to the cost of living, Frisco is notably more expensive than Northeast Tarrant. The higher cost is primarily due to the housing market, with higher median home costs in Frisco, but also includes factors like groceries, health care, and utilities.
Income Tax
Texas, in general, does not impose a state-level income tax, meaning residents of both Northeast Tarrant and Frisco are exempt from this tax type.
Property Tax
Frisco has a slightly higher property tax rate compared to Northeast Tarrant. However, homeowners in both cities can expect a property tax rate higher than the national average.
Sales Tax
Both cities adhere to the general Texas sales tax rate of 8.25%. This percentage includes the 6.25% state tax plus up to 2% for local taxes.
Income
Type
Northeast Tarrant
Frisco
Estimated median household income
$90,881
$130,118
Estimated per capita income
$45,353
$58,153
Cost of living index (U.S. average is 100)
102
96.1
If you make $50,000 in Frisco, you will have to make $53,070 in Northeast Tarrant to maintain the same standard of living.
Geographical Conditions
Both cities are located in the northeastern region of Texas and benefit from flat lands and a handful of lakes and parks. Frisco, however, is more landlocked and situated further away from the coast compared to Northeast Tarrant.
Geographical information
Type
Northeast Tarrant
Frisco
Land area
206.9 sq. miles
69.9 sq. miles
Population density
2,284.3 people per sq. mile
3,015.4 people per sq. mile
Relative area comparison
Northeast Tarrant, TX Frisco, TX
Education
Both cities have strong educational infrastructures, boasting several highly-rated public and private schools. Frisco, in particular, is praised for its education system, with an above-average school ranking and a considerable number of top-performing schools in the state. This result is advantageous for families considering relocation or tourists seeking educational tours.
The economies of both Northeast Tarrant and Frisco are diverse and strong. Northeast Tarrant's economy relies heavily on aviation, logistics, and manufacturing, while Frisco is a budding tech and sports hub, with increased job opportunities in these fields.
Biggest Employers
In Northeast Tarrant, the biggest employers include American Airlines and Bell Helicopter. For Frisco, it's the Frisco Independent School District, city government, and several tech and sports companies.
In Northeast Tarrant (Tarrant County), 41.4% voted for Democrats and 57.1% for Republicans in 2012 Presidential Election. In Frisco (Collin County), 33.6% voted for Democrats and 65.2% for Republicans.
Elections
Type
Democrats
Republicans
Other
Year
Northeast Tarrant
Frisco
Northeast Tarrant
Frisco
Northeast Tarrant
Frisco
2020
49.3%
47.1%
49.1%
51.4%
1.6%
1.5%
2016
43.2%
39.0%
51.8%
55.7%
5.0%
5.4%
2012
41.4%
33.6%
57.1%
65.2%
1.4%
1.2%
2008
43.8%
36.7%
55.5%
62.3%
0.7%
1.0%
2004
37.0%
28.2%
62.5%
71.3%
0.5%
0.6%
2000
36.9%
24.5%
60.9%
73.2%
2.3%
2.3%
1996
41.6%
28.5%
50.9%
63.0%
7.5%
8.5%
Breakdown of population affiliated with a religious congregation
Type
Adherents
Congregations
Religion
Northeast Tarrant
Frisco
Northeast Tarrant
Frisco
SOUTHERN BAPTIST CONVENTION
17.3%
10.1%
33.3%
29.1%
CATHOLIC CHURCH
11.1%
14.2%
1.9%
1.6%
MUSLIM ESTIMATE
2.2%
2.9%
0.9%
1.9%
LUTHERAN CHURCH
0.5%
0.8%
0.9%
1.4%
SEVENTH DAY ADVENTIST CHURCH
0.4%
0.1%
1.6%
0.8%
EPISCOPAL CHURCH
0.3%
0.2%
0.8%
1.0%
EVANGELICAL LUTHERAN CHURCH IN AMERICA
0.3%
0.3%
0.9%
1.0%
Weather
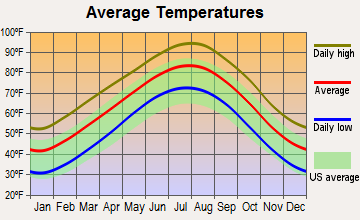
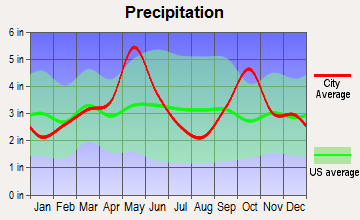
Just like the rest of Texas, both Northeast Tarrant and Frisco experience a subtropical climate. This means hot, humid summers and mild to cool winters. Frisco, however, tends to be slightly cooler in the summer months. Both cities see moderate rainfall throughout the year, but Frisco gets slightly more precipitation.
Weather and climate
Type
Northeast Tarrant
Frisco
Temperature - Average
64.6°F
63.3°F
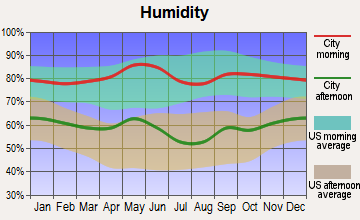
Humidity - Average morning or afternoon humidity
71.3%
71.3%
Humidity - Differences between morning and afternoon humidity
34%
34%
Humidity - Maximum monthly morning or afternoon humidity
82%
82%
Humidity - Minimum monthly morning or afternoon humidity
48%
48%
Precipitation - Yearly average
37.2 in
39.2 in
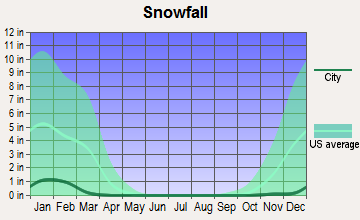
Snowfall - Yearly average
4.2 in
4.2 in
Clouds - Number of days clear of clouds
22.8%
22.8%
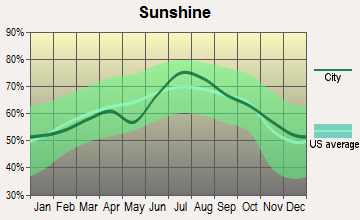
Sunshine amount - Average
66.6%
66.6%
Sunshine amount - Differences during a year
20%
20%
Sunshine amount - Maximum monthly
74%
74%
Sunshine amount - Minimum monthly
54%
54%
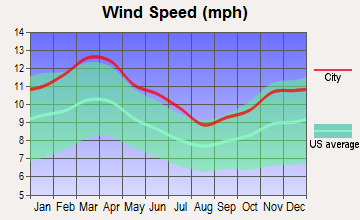
Wind speed - Average
10.3 mph
10.3 mph
Average climate in Northeast Tarrant, Texas
Average climate in Frisco, Texas
Air pollution
Type
AQI
CO
NO2
OZONE
PB
PM25
SO2
Year
Northeast Tarrant
Frisco
Northeast Tarrant
Northeast Tarrant
Frisco
Northeast Tarrant
Frisco
Frisco
Northeast Tarrant
Frisco
Northeast Tarrant
Frisco
2018
86
88
N/A
N/A
5.8
5.8
27.9
31.0
N/A
N/A
9.2
9.1
0.4
0.4
2017
84
85
N/A
N/A
5.9
5.8
28.0
32.2
N/A
N/A
8.6
8.4
0.3
0.3
2016
75
81
N/A
N/A
6.2
6.4
26.4
30.6
N/A
N/A
8.2
8.2
0.2
0.2
2015
81
86
N/A
N/A
6.5
7.2
25.7
30.7
N/A
N/A
8.5
8.4
0.3
0.3
2014
77
87
0.22
N/A
6.6
6.1
27.1
31.4
N/A
N/A
9.4
9.2
0.3
0.3
2013
95
98
0.25
N/A
6.8
7.0
28.0
33.0
N/A
N/A
11.3
11.0
0.2
0.2
2012
108
113
0.26
N/A
8.1
8.5
30.7
35.3
N/A
N/A
10.8
10.5
0.3
0.3
2011
98
105
0.23
N/A
8.0
9.1
30.8
35.0
N/A
N/A
10.2
10.1
0.6
0.6
2010
76
85
0.23
N/A
8.7
9.7
28.0
31.8
N/A
N/A
8.5
8.5
0.7
0.7
2009
93
93
0.25
N/A
8.9
9.6
29.1
32.2
N/A
N/A
8.7
8.7
0.5
0.5
2008
89
86
0.25
N/A
9.7
9.9
27.5
33.3
0.121
N/A
9.4
9.4
0.5
0.5
2007
91
93
0.30
N/A
10.8
10.3
25.1
31.4
0.070
N/A
9.7
9.7
0.3
0.3
2006
99
109
0.34
N/A
10.6
10.5
30.2
35.1
0.106
N/A
9.5
9.5
0.7
0.7
2005
109
105
0.34
N/A
12.3
13.2
29.1
33.6
0.142
N/A
10.7
10.6
0.9
0.9
2004
90
90
0.39
N/A
11.6
11.8
25.7
29.9
0.099
N/A
N/A
N/A
0.8
0.8
2003
97
97
0.40
N/A
12.3
13.9
27.2
31.1
0.121
N/A
N/A
N/A
1.0
1.0
2002
97
96
0.37
N/A
13.0
14.3
25.4
30.6
0.080
N/A
N/A
N/A
0.4
0.4
2001
88
99
0.48
N/A
14.3
12.8
26.0
31.7
0.069
N/A
N/A
N/A
1.0
1.0
2000
104
107
0.55
N/A
14.5
14.5
27.1
32.8
0.092
N/A
N/A
N/A
1.1
1.1
Natural disasters
Type
Northeast Tarrant
Frisco
Tornado activity compared to U.S. average
252.8%
252.4%
Earthquake activity compared to U.S. average
578.9%
608.9%
Natural disasters compared to U.S. average
23%
14%
Transportation
Public transportation is more developed in Northeast Tarrant, where larger populations necessitate well-established bus and train routes. Frisco, however, is largely car-dependent, yet this is offset by less traffic and easy navigation within the city.
Transport
Type
Northeast Tarrant
Frisco
Amtrak stations nearby
1
0
FAA registered aircraft
0
131
FAA registered aircraft manufacturers and dealers
0
10
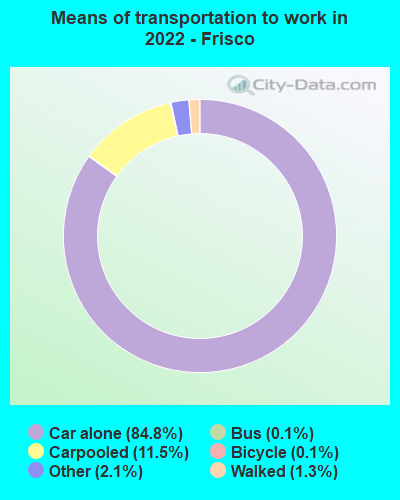
Means of transportation to work
Type
Northeast Tarrant
Frisco
Bicycle
0.2%
0.2%
Carpooled
9.8%
11%
Car alone
84.8%
85.7%
Motorcycle
0.1%
0%
Taxicab
0.1%
0.1%
Walked
0.9%
1%
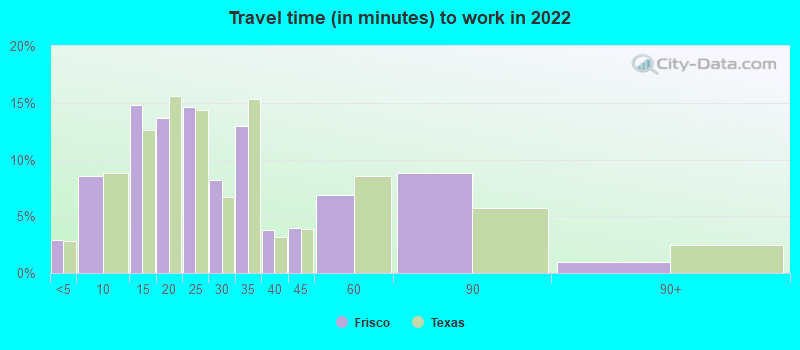
Average travel time to work
Type
Northeast Tarrant
Frisco
Average
26.8 min
26.7 min
Real Estate
Real estate in Frisco tends to be more expensive than in Northeast Tarrant due to demand and fast growth. Both offer diverse housing options, from apartments to single-family homes, but Frisco provides more upscale, modern housing options.
Neighborhoods
Northeast Tarrant is composed of several welcoming neighborhoods with a lower cost of living, while Frisco's neighborhoods tend to be more affluent, reflecting the city's overall higher cost of living. Both places offer quiet, family-friendly communities, making them excellent for relocation.
Houses and residents
Type
Northeast Tarrant
Frisco
Houses
155,788
74,074
Average household size (people)
2.7
2.9
Houses occupied
149,489 (96%)
72,282 (97.6%)
Houses occupied by owners
101,491 (67.9%)
46,921 (64.9%)
Houses occupied by renters
47,998 (32.1%)
25,361 (35.1%)
Median rent asked for vacant for-rent units
$1,297
$773.82
Median price asked for vacant for-sale houses and condos
$288,870
$474,691
Estimated median house or condo value
$337,949
$520,200
Median number of rooms in apartments
4.1
3.8
Median number of rooms in houses and condos
6.5
8.3
Renting percentage
32.5%
23.4%
Housing density (houses/condos per square mile)
752.8
1,060
Household income disparities
38.7%
34.8%
Housing units without a mortgage
18,262 (19.1%)
289 (0.8%)
Housing units with both a second mortgage and home equity loan
88 (0.1%)
897 (2.5%)
Housing units with a mortgage
77,313 (80.9%)
35,782 (99.2%)
Housing units with a home equity loan
4,029 (4.2%)
238 (0.7%)
Housing units with a second mortgage
5,649 (5.9%)
2,028 (5.6%)
Housing units lacking complete kitchen facilities
0.4%
1%
Housing units lacking complete plumbing facilities
Self-employed workers in own not incorporated business
11,886
4,313
State government workers
4,379
1,249
Unpaid family workers
466
688
Industries and Occupations
Northeast Tarrant hosts a variety of industries, including logistics, aerospace, and manufacturing. On the other hand, Frisco’s fast-growing economy includes burgeoning tech and sports industries, resulting in diverse job opportunities.
Both cities offer excellent healthcare with multiple hospitals and clinics. However, due to its rapid growth, Frisco has more recently-built medical facilities.
Northeast Tarrant, due to its more extended existence, has a more established infrastructure than Frisco. However, as Frisco continues to grow, the city has been investing heavily in development projects to upgrade its infrastructure, making it modern, efficient, and convenient.
Infrastructure
Type
Northeast Tarrant
Frisco
TV stations
25
24
Culture and Food
Both Northeast Tarrant and Frisco are filled with rich culture and diverse food options. Northeast Tarrant, being closer to Fort Worth, offers more traditional Texas fare and cultural experiences. Frisco, however, is known for its unique blend of Texan and cosmopolitan life that extends to food and cultural offerings.
Sports Teams
Frisco is a city that cherishes sports, hosting several minor and major league teams, including FC Dallas and the Dallas Cowboys. While Northeast Tarrant doesn't host significant sports teams, it's within a short driving distance of major Dallas and Fort Worth teams.
 Northeast Tarrant, TX
 Frisco, TX