Northeast Tarrant and McKinney, both located in Texas, offer diverse living experiences with various factors shaping the residents' day-to-day routines. Crime rate and safety measures, cost of living, quality of education, industry concentration, availability of jobs, transport connectivity, tax systems, culture, sporting activities, geographical conditions, and access to quality healthcare are among the factors that define these cities. The two are unique in their own rights, but both represent comprehensive aspects of Texas' charm and allure.
Compared to the national average, Northeast Tarrant’s crime rates are significantly lower, displaying about a 43% lower rate, thus making it safer for both residents and tourists. McKinney is also relatively safe, but the crime rate is slightly higher than Northeast Tarrant’s, but still below the US average. Both cities prioritize the safety of their communities and make consistent efforts to maintain peace and serenity.
Cost of Living
The cost of living in both cities varies slightly. Northeast Tarrant, being in closer proximity to Dallas and other urban centers, has a slightly higher cost of living compared to McKinney. However, both cities are still more affordable than many other parts of the country, particularly when considering housing and utility costs.
Income Tax
Texas is one of the seven states in the United States that does not impose a state income tax, benefiting residents of both Northeast Tarrant and McKinney.
Property Tax
While Texas does not have an income tax, it does have comparatively high property taxes. Both Northeast Tarrant and McKinney residents are subject to these property taxes, which fund local amenities like schools, roads, and public safety.
Sales Tax
Both cities fall under the state jurisdiction of Texas, which has a state sales tax rate of 6.25%. Additional local taxes mean the total sales tax rate in both Northeast Tarrant and McKinney can go up to 8.25%.
Income
Type
Northeast Tarrant
McKinney
Estimated median household income
$90,881
$98,317
Estimated per capita income
$45,353
$47,493
Cost of living index (U.S. average is 100)
102
95.6
If you make $50,000 in McKinney, you will have to make $53,347 in Northeast Tarrant to maintain the same standard of living.
Geographical Conditions
Northeast Tarrant, closer to a major urban center, features densely populated areas in contrast to McKinney's more open, suburban, and rural tracts of land. Both cities, however, offer plenty of recreational areas, green spaces, and parks.
Geographical information
Type
Northeast Tarrant
McKinney
Land area
206.9 sq. miles
58 sq. miles
Population density
2,284.3 people per sq. mile
3,493.1 people per sq. mile
Relative area comparison
Northeast Tarrant, TX McKinney, TX
Education
Both cities have a strong focus on education. In Northeast Tarrant, a significant part of the population holds a Bachelor's degree or higher. McKinney has a similar emphasis on education, providing various educational resources and facilities with some of the top-rated schools in the country.
The robust economy of Northeast Tarrant is somewhat more diverse, with an emphasis on information technology, financial services, and manufacturing. Meanwhile, McKinney’s economy leans towards retail trade, construction, and healthcare services. Both cities have a lower unemployment rate compared to the national average, indicating a healthy job market.
Biggest Employers
Some of the significant employers in Northeast Tarrant include the American Airlines Group, Bell Helicopter, and Lockheed Martin Aeronautics. On the other hand, the largest employers in McKinney include Raytheon Space and Airborne Systems, Medical City McKinney, and the McKinney Independent School District.
In Northeast Tarrant (Tarrant County), 41.4% voted for Democrats and 57.1% for Republicans in 2012 Presidential Election. In McKinney (Collin County), 33.6% voted for Democrats and 65.2% for Republicans.
Elections
Type
Democrats
Republicans
Other
Year
Northeast Tarrant
McKinney
Northeast Tarrant
McKinney
Northeast Tarrant
McKinney
2020
49.3%
47.1%
49.1%
51.4%
1.6%
1.5%
2016
43.2%
39.0%
51.8%
55.7%
5.0%
5.4%
2012
41.4%
33.6%
57.1%
65.2%
1.4%
1.2%
2008
43.8%
36.7%
55.5%
62.3%
0.7%
1.0%
2004
37.0%
28.2%
62.5%
71.3%
0.5%
0.6%
2000
36.9%
24.5%
60.9%
73.2%
2.3%
2.3%
1996
41.6%
28.5%
50.9%
63.0%
7.5%
8.5%
Breakdown of population affiliated with a religious congregation
Type
Adherents
Congregations
Religion
Northeast Tarrant
McKinney
Northeast Tarrant
McKinney
SOUTHERN BAPTIST CONVENTION
17.3%
10.1%
33.3%
29.1%
CATHOLIC CHURCH
11.1%
14.2%
1.9%
1.6%
MUSLIM ESTIMATE
2.2%
2.9%
0.9%
1.9%
LUTHERAN CHURCH
0.5%
0.8%
0.9%
1.4%
SEVENTH DAY ADVENTIST CHURCH
0.4%
0.1%
1.6%
0.8%
EPISCOPAL CHURCH
0.3%
0.2%
0.8%
1.0%
EVANGELICAL LUTHERAN CHURCH IN AMERICA
0.3%
0.3%
0.9%
1.0%
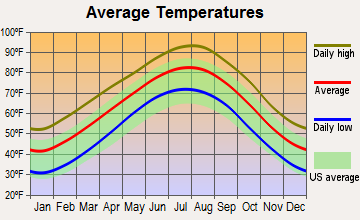
Weather
Both cities experience typical Texan weather: hot, heavy summers and mild winters. However, McKinney, located further inland, experiences a greater range of temperatures throughout the year compared to Northeast Tarrant. Northeast Tarrant, being closer to Dallas, achieves a balance of urban and suburban life whereas McKinney has a more definitive suburban feel.
Weather and climate
Type
Northeast Tarrant
McKinney
Temperature - Average
64.6°F
62.8°F
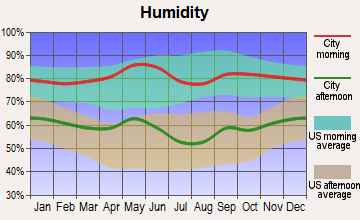
Humidity - Average morning or afternoon humidity
71.3%
71.3%
Humidity - Differences between morning and afternoon humidity
34%
34.1%
Humidity - Maximum monthly morning or afternoon humidity
82%
82%
Humidity - Minimum monthly morning or afternoon humidity
48%
48%
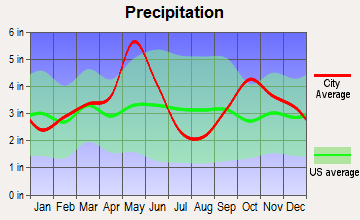
Precipitation - Yearly average
37.2 in
40.9 in
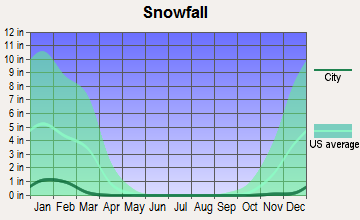
Snowfall - Yearly average
4.2 in
4.2 in
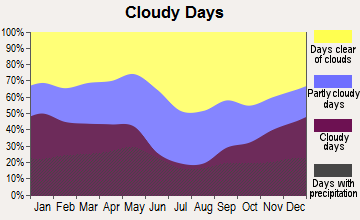
Clouds - Number of days clear of clouds
22.8%
22.8%
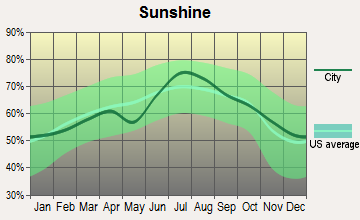
Sunshine amount - Average
66.6%
66.6%
Sunshine amount - Differences during a year
20%
20%
Sunshine amount - Maximum monthly
74%
74%
Sunshine amount - Minimum monthly
54%
54%
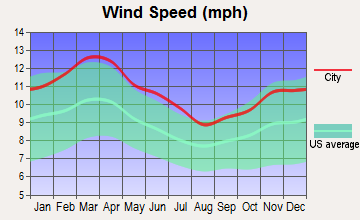
Wind speed - Average
10.3 mph
10.3 mph
Average climate in Northeast Tarrant, Texas
Average climate in McKinney, Texas
Air pollution
Type
AQI
CO
NO2
OZONE
PB
PM25
SO2
Year
Northeast Tarrant
McKinney
Northeast Tarrant
Northeast Tarrant
McKinney
Northeast Tarrant
McKinney
McKinney
Northeast Tarrant
Northeast Tarrant
2018
86
80
N/A
N/A
5.8
5.8
27.9
30.2
N/A
N/A
9.2
N/A
0.4
N/A
2017
84
75
N/A
N/A
5.9
5.8
28.0
31.4
N/A
N/A
8.6
N/A
0.3
N/A
2016
75
73
N/A
N/A
6.2
6.4
26.4
30.0
N/A
N/A
8.2
N/A
0.2
N/A
2015
81
80
N/A
N/A
6.5
7.2
25.7
30.3
N/A
N/A
8.5
N/A
0.3
N/A
2014
77
76
0.22
N/A
6.6
6.1
27.1
31.1
N/A
N/A
9.4
N/A
0.3
N/A
2013
95
83
0.25
N/A
6.8
7.0
28.0
32.6
N/A
N/A
11.3
N/A
0.2
N/A
2012
108
100
0.26
N/A
8.1
8.5
30.7
34.4
N/A
N/A
10.8
N/A
0.3
N/A
2011
98
96
0.23
N/A
8.0
9.1
30.8
34.4
N/A
N/A
10.2
N/A
0.6
N/A
2010
76
81
0.23
N/A
8.7
9.7
28.0
31.3
N/A
N/A
8.5
N/A
0.7
N/A
2009
93
86
0.25
N/A
8.9
9.6
29.1
31.9
N/A
N/A
8.7
N/A
0.5
N/A
2008
89
82
0.25
N/A
9.7
9.9
27.5
32.5
0.121
N/A
9.4
N/A
0.5
N/A
2007
91
89
0.30
N/A
10.8
10.3
25.1
30.0
0.070
N/A
9.7
N/A
0.3
N/A
2006
99
104
0.34
N/A
10.6
10.5
30.2
34.1
0.106
N/A
9.5
N/A
0.7
N/A
2005
109
100
0.34
N/A
12.3
13.2
29.1
32.9
0.142
N/A
10.7
N/A
0.9
N/A
2004
90
90
0.39
N/A
11.6
11.8
25.7
29.6
0.099
N/A
N/A
N/A
0.8
N/A
2003
97
97
0.40
N/A
12.3
13.9
27.2
30.7
0.121
N/A
N/A
N/A
1.0
N/A
2002
97
96
0.37
N/A
13.0
14.3
25.4
29.7
0.080
N/A
N/A
N/A
0.4
N/A
2001
88
99
0.48
N/A
14.3
12.8
26.0
31.0
0.069
N/A
N/A
N/A
1.0
N/A
2000
104
107
0.55
N/A
14.5
14.5
27.1
32.1
0.092
N/A
N/A
N/A
1.1
N/A
Natural disasters
Type
Northeast Tarrant
McKinney
Tornado activity compared to U.S. average
252.8%
250.4%
Earthquake activity compared to U.S. average
578.9%
613.3%
Natural disasters compared to U.S. average
23%
14%
Transportation
Both cities have a robust transport network. Northeast Tarrant residents have the advantage of proximity to Dallas and Forth Worth, providing a mix of personal and public transportation options. McKinney, while still well-connected, has a somewhat lesser public transit availability, necessitating dependence on personal vehicles.
Transport
Type
Northeast Tarrant
McKinney
Amtrak stations nearby
1
0
FAA registered aircraft
0
272
FAA registered aircraft manufacturers and dealers
0
7
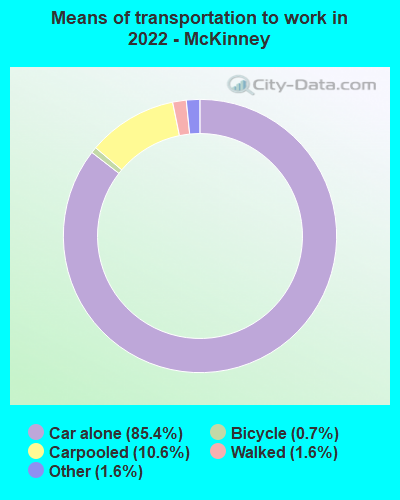
Means of transportation to work
Type
Northeast Tarrant
McKinney
Bicycle
0.2%
0.6%
Carpooled
9.8%
10.4%
Car alone
84.8%
85.6%
Motorcycle
0.1%
0%
Taxicab
0.1%
0.1%
Walked
0.9%
1.3%
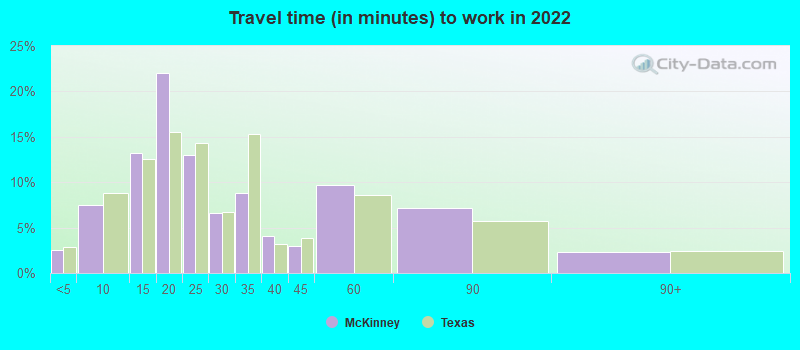
Average travel time to work
Type
Northeast Tarrant
McKinney
Average
26.8 min
28.7 min
Real Estate
The real estate markets in both cities are strong and consistently growing. Northeast Tarrant’s proximity to major urban zones ensures strong demand for property, while McKinney’s thriving economy and family-friendly environment attract many buyers. Both cities offer diverse housing options for different budget ranges.
Neighborhoods
Northeast Tarrant, due to its proximity to urban centers, offers more urban and suburban mixed neighborhoods. McKinney exhibits a more typical suburban living experience with family-friendly neighborhoods and numerous parks and recreational areas.
Houses and residents
Type
Northeast Tarrant
McKinney
Houses
155,788
76,364
Average household size (people)
2.7
2.9
Houses occupied
149,489 (96%)
73,357 (96.1%)
Houses occupied by owners
101,491 (67.9%)
47,064 (64.2%)
Houses occupied by renters
47,998 (32.1%)
26,293 (35.8%)
Median rent asked for vacant for-rent units
$1,297
$1,543
Median price asked for vacant for-sale houses and condos
$288,870
$278,214
Estimated median house or condo value
$337,949
$391,200
Median number of rooms in apartments
4.1
3.6
Median number of rooms in houses and condos
6.5
7.7
Renting percentage
32.5%
29%
Housing density (houses/condos per square mile)
752.8
1,316
Household income disparities
38.7%
40.9%
Housing units without a mortgage
18,262 (19.1%)
138 (0.4%)
Housing units with both a second mortgage and home equity loan
88 (0.1%)
1,162 (3.2%)
Housing units with a mortgage
77,313 (80.9%)
36,370 (99.6%)
Housing units with a home equity loan
4,029 (4.2%)
69 (0.2%)
Housing units with a second mortgage
5,649 (5.9%)
2,081 (5.7%)
Housing units lacking complete kitchen facilities
0.4%
4.4%
Housing units lacking complete plumbing facilities
Self-employed workers in own not incorporated business
11,886
5,610
State government workers
4,379
939
Unpaid family workers
466
291
Industries and Occupations
In Northeast Tarrant, the most common industries are professional, scientific, technical services, and retail trade. Meanwhile, McKinney exhibits a higher concentration of residents employed in the healthcare, education, and retail sectors. Both cities maintain a balanced mix of occupations, with both white-collar and blue-collar jobs.
Both cities are well-equipped in terms of healthcare facilities. Residents of Northeast Tarrant have easy access to the state-of-the-art medical facilities in Dallas and Fort Worth, while McKinney residents enjoy high-quality healthcare providers within the city, including the renowned Medical City McKinney.
Northeast Tarrant boasts of its well-laid infrastructures, ranging from roads, parks, business hubs, and shopping plazas. McKinney’s infrastructure takes on a more classic suburban charm, with attractively designed homes, community centers, nature parks, and schools.
Infrastructure
Type
Northeast Tarrant
McKinney
TV stations
25
22
Culture and Food
Both Northeast Tarrant and McKinney enjoy vibrant cultural scenes, but they express it in their unique ways. Northeast Tarrant’s more cosmopolitan atmosphere fosters a diverse culinary and arts scene boasting foods from around the globe and various cultural festivals. McKinney's culture, on the other hand, is more rooted in the classic Texan tradition, featuring BBQ, chili, and rodeos.
Sports Teams
Northeast Tarrant, due to its proximity to Dallas, plays home to fans of the Dallas Cowboys (NFL), Dallas Stars (NHL), Texas Rangers (MLB), and Dallas Mavericks (NBA). McKinney has various local sports leagues and is also home to a number of Dallas sport team fans due to its relatively close proximity.
 Northeast Tarrant, TX
 McKinney, TX