Comparing the two Texas cities of Northeast Tarrant and Mesquite unveils unique features in each, impacting residents and businesses. This analysis addresses safety, education, costs, work prospects, infrastructure, cultural highlights, and more. Both locales offer a diverse range of opportunities and amenities, each city bragging its unique charm and style to the Lone Star State. Understanding the differences and individual characteristics between these two regions can help you make an informed decision regarding relocation or visitation.
Northeast Tarrant is known for its relatively low crime rates compared to other areas in the state, contributing to a sense of safety among residents and visitors. It's a mix of suburban and urban settings, with law enforcement visible and active. Mesquite has a higher crime rate compared to Northeast Tarrant, but it's worth noting that it still falls below the national average. Both cities have neighborhood watch programs, employing various safety initiatives.
Cost of Living
Northeast Tarrant enjoys a lower cost of living than the national average, making it attractive for people looking for a balance between suburban living and affordability. On the other hand, Mesquite also offers affordable living costs, with slightly higher expenses due to urban investments. However, both cities continue to provide competitive prices for goods and services, housing, and utilities.
Income Tax
Texas is one of the seven states in the US that does not impose a state income tax. This means residents of both Northeast Tarrant and Mesquite are exempt from state income tax, making them financially attractive locations for individuals and businesses alike.
Property Tax
Property taxes tend to be higher in Texas to compensate for the lack of state income tax. However, these rates vary based on local assessments. While Northeast Tarrant's property tax rates might be slightly higher due to its high-end real estate, Mesquite's rates are somewhat more affordable.
Sales Tax
In both Northeast Tarrant and Mesquite, the sales tax rate is the same, given they both fall under Texas jurisdiction. Texas charges a 6.25% state sales tax, with local municipalities allowed to add up to 2%, making the possible maximum sales tax 8.25%.
Income
Type
Northeast Tarrant
Mesquite
Estimated median household income
$90,881
$60,957
Estimated per capita income
$45,353
$28,429
Cost of living index (U.S. average is 100)
102
94.7
If you make $50,000 in Mesquite, you will have to make $53,854 in Northeast Tarrant to maintain the same standard of living.
Geographical Conditions
Geographically, Northeast Tarrant is characterized by gently rolling terrain and lush green landscapes. Mesquite, in contrast, is part of the East Texas Timberlands, offering a combination of prairies, woodlands, and lake views.
Geographical information
Type
Northeast Tarrant
Mesquite
Land area
206.9 sq. miles
43.4 sq. miles
Population density
2,284.3 people per sq. mile
3,401.8 people per sq. mile
Relative area comparison
Northeast Tarrant, TX Mesquite, TX
Education
Northeast Tarrant boasts of high performing schools like Colleyville Heritage High School and Grapevine-Colleyville Independent School District, making it appealing for families prioritizing education. In contrast, Mesquite, hosting the Mesquite Independent School District, provides equitable education, focusing on enriching student experiences through arts, athletics, and rigorous academics.
The job market in Northeast Tarrant is diversified, with sectors like healthcare, retail, and scientific services providing employment. In contrast, Mesquite is an industrial and manufacturing hub, featuring an array of employment opportunities in these areas. Both areas have seen substantial economic growth over the years, promising prospective work opportunities.
Biggest Employers
In Northeast Tarrant, the biggest employers are the North East Independent School District, University Health System, and USAA. Meanwhile, over in Mesquite, United Parcel Service and the Dallas Regional Medical Center contribute significantly to employment.
In Northeast Tarrant (Tarrant County), 41.4% voted for Democrats and 57.1% for Republicans in 2012 Presidential Election. In Mesquite (Dallas County), 57.3% voted for Democrats and 41.8% for Republicans.
Elections
Type
Democrats
Republicans
Other
Year
Northeast Tarrant
Mesquite
Northeast Tarrant
Mesquite
Northeast Tarrant
Mesquite
2020
49.3%
65.1%
49.1%
33.4%
1.6%
1.4%
2016
43.2%
60.8%
51.8%
34.7%
5.0%
4.5%
2012
41.4%
57.3%
57.1%
41.8%
1.4%
1.0%
2008
43.8%
57.4%
55.5%
42.0%
0.7%
0.6%
2004
37.0%
49.0%
62.5%
50.4%
0.5%
0.5%
2000
36.9%
45.0%
60.9%
52.7%
2.3%
2.4%
1996
41.6%
46.0%
50.9%
46.8%
7.5%
7.2%
Breakdown of population affiliated with a religious congregation
Type
Adherents
Congregations
Religion
Northeast Tarrant
Mesquite
Northeast Tarrant
Mesquite
SOUTHERN BAPTIST CONVENTION
17.3%
11.0%
33.3%
31.1%
CATHOLIC CHURCH
11.1%
18.9%
1.9%
2.4%
MUSLIM ESTIMATE
2.2%
3.6%
0.9%
1.1%
LUTHERAN CHURCH
0.5%
0.3%
0.9%
0.7%
SEVENTH DAY ADVENTIST CHURCH
0.4%
0.5%
1.6%
1.7%
EPISCOPAL CHURCH
0.3%
1.0%
0.8%
1.5%
EVANGELICAL LUTHERAN CHURCH IN AMERICA
0.3%
0.3%
0.9%
0.9%
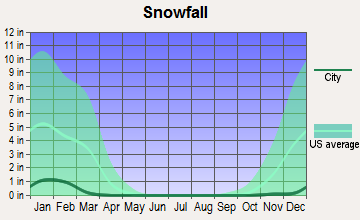
Weather
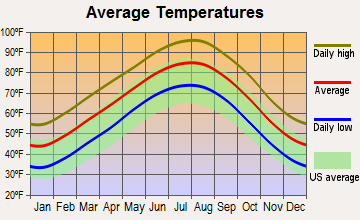
The weather in both Northeast Tarrant and Mesquite remains relatively similar, with hot summers and mild winters. As part of the Southern Plains, both areas are prone to severe thunderstorms, occasionally experiencing tornadoes. However, the pleasant, temperate conditions during fall and spring balances the extreme weather, making the outdoors enjoyable for most of the year.
Weather and climate
Type
Northeast Tarrant
Mesquite
Temperature - Average
64.6°F
65.4°F
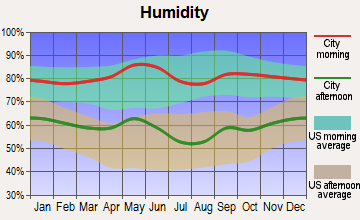
Humidity - Average morning or afternoon humidity
71.3%
71.3%
Humidity - Differences between morning and afternoon humidity
34%
34%
Humidity - Maximum monthly morning or afternoon humidity
82%
82%
Humidity - Minimum monthly morning or afternoon humidity
48%
48%
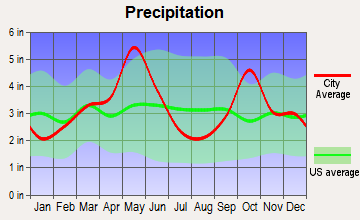
Precipitation - Yearly average
37.2 in
39 in
Snowfall - Yearly average
4.2 in
4.2 in
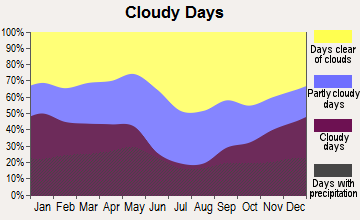
Clouds - Number of days clear of clouds
22.8%
22.7%
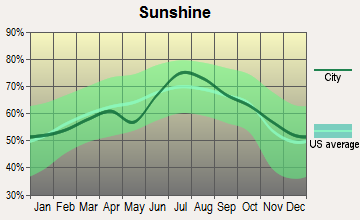
Sunshine amount - Average
66.6%
66.6%
Sunshine amount - Differences during a year
20%
20%
Sunshine amount - Maximum monthly
74%
74%
Sunshine amount - Minimum monthly
54%
54%
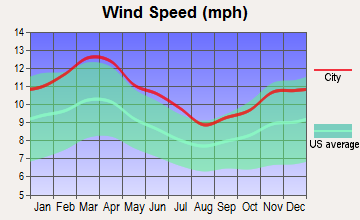
Wind speed - Average
10.3 mph
10.3 mph
Average climate in Northeast Tarrant, Texas
Average climate in Mesquite, Texas
Air pollution
Type
AQI
CO
NO2
OZONE
PM25
SO2
Year
Northeast Tarrant
Mesquite
Northeast Tarrant
Northeast Tarrant
Mesquite
Northeast Tarrant
Mesquite
Northeast Tarrant
Mesquite
Northeast Tarrant
Mesquite
2018
86
86
N/A
N/A
5.8
5.3
27.9
28.1
9.2
9.1
0.4
0.3
2017
84
84
N/A
N/A
5.9
5.0
28.0
29.0
8.6
8.7
0.3
0.4
2016
75
73
N/A
N/A
6.2
5.4
26.4
28.1
8.2
8.1
0.2
0.3
2015
81
82
N/A
N/A
6.5
5.9
25.7
28.3
8.5
8.5
0.3
0.3
2014
77
77
0.22
N/A
6.6
5.6
27.1
29.3
9.4
9.3
0.3
0.4
2013
95
96
0.25
N/A
6.8
6.5
28.0
30.6
11.3
11.7
0.2
0.4
2012
108
110
0.26
N/A
8.1
7.7
30.7
32.2
10.8
11.1
0.3
0.4
2011
98
99
0.23
N/A
8.0
8.3
30.8
32.4
10.2
10.7
0.6
0.7
2010
76
76
0.23
N/A
8.7
8.4
28.0
29.8
8.5
9.3
0.7
0.6
2009
93
90
0.25
N/A
8.9
8.1
29.1
30.4
8.7
9.1
0.5
0.5
2008
89
86
0.25
N/A
9.7
8.7
27.5
30.4
9.4
9.7
0.5
0.6
2007
91
99
0.30
N/A
10.8
9.5
25.1
27.4
9.7
10.2
0.3
0.4
2006
99
104
0.34
N/A
10.6
9.5
30.2
32.4
9.5
9.9
0.7
0.7
2005
109
107
0.34
N/A
12.3
11.3
29.1
31.6
10.7
11.0
0.9
0.8
2004
90
95
0.39
N/A
11.6
10.8
25.7
28.4
N/A
N/A
0.8
0.7
2003
97
100
0.40
N/A
12.3
12.1
27.2
30.4
N/A
N/A
1.0
0.9
2002
97
95
0.37
N/A
13.0
12.3
25.4
28.1
N/A
N/A
0.4
0.4
2001
88
91
0.48
N/A
14.3
12.3
26.0
28.4
N/A
N/A
1.0
0.9
2000
104
104
0.55
N/A
14.5
14.0
27.1
28.2
N/A
N/A
1.1
1.1
Natural disasters
Type
Northeast Tarrant
Mesquite
Tornado activity compared to U.S. average
252.8%
250.2%
Earthquake activity compared to U.S. average
578.9%
562.6%
Natural disasters compared to U.S. average
23%
21%
Transportation
Both locations operate efficient public transit systems that facilitate commuting across the town and connecting areas. Northeast Tarrant enjoys the convenience of the Trinity Railway Express, and Mesquite operates the Mesquite Transportation for the Elderly and Disabled service, offering accessible commuting for all.
Transport
Type
Northeast Tarrant
Mesquite
Amtrak stations nearby
1
1
FAA registered aircraft
0
82
FAA registered aircraft manufacturers and dealers
0
2
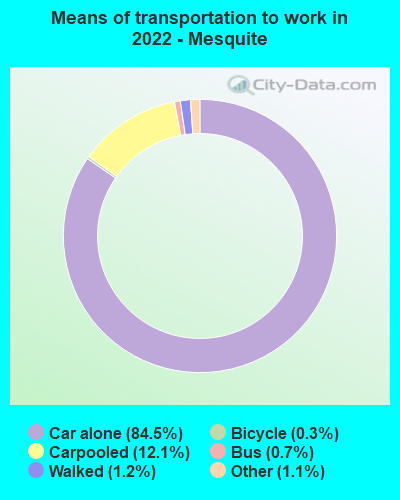
Means of transportation to work
Type
Northeast Tarrant
Mesquite
Bicycle
0.2%
0.3%
Bus
0%
0.6%
Carpooled
9.8%
11.5%
Car alone
84.8%
85.7%
Motorcycle
0.1%
0.1%
Walked
0.9%
1.1%
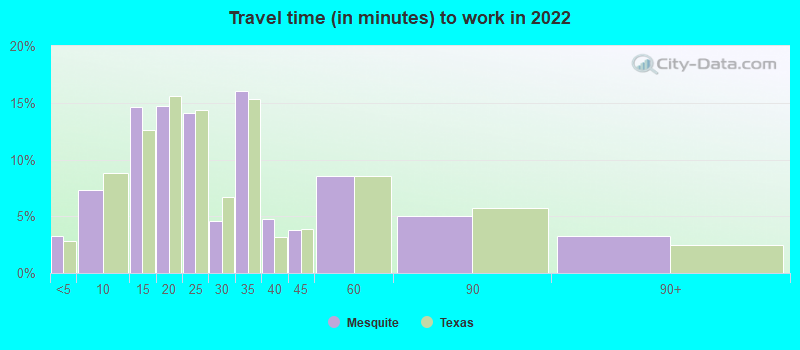
Average travel time to work
Type
Northeast Tarrant
Mesquite
Average
26.8 min
28.2 min
Real Estate
The real estate market in Northeast Tarrant is competitive, offering a range of housing options ranging from mid-range homes to luxury estates. Mesquite offers a diverse real estate market too, with options suitable for varying budgets - from starter homes to higher-end properties.
Neighborhoods
The neighborhoods in both Northeast Tarrant and Mesquite are distinctive and varied. Northeast Tarrant's communities like Colleyville, Keller, and Southlake stand out for their upscale charm, while Mesquite's Town East Estate and Creek Crossing offer a more laid-back lifestyle.
Houses and residents
Type
Northeast Tarrant
Mesquite
Houses
155,788
55,252
Average household size (people)
2.7
2.9
Houses occupied
149,489 (96%)
52,023 (94.2%)
Houses occupied by owners
101,491 (67.9%)
33,675 (64.7%)
Houses occupied by renters
47,998 (32.1%)
18,348 (35.3%)
Median rent asked for vacant for-rent units
$1,297
$1,206
Median price asked for vacant for-sale houses and condos
$288,870
$297,978
Estimated median house or condo value
$337,949
$208,900
Median number of rooms in apartments
4.1
4.2
Median number of rooms in houses and condos
6.5
6
Renting percentage
32.5%
38.6%
Housing density (houses/condos per square mile)
752.8
1,272.6
Household income disparities
38.7%
41.7%
Housing units without a mortgage
18,262 (19.1%)
267 (1.3%)
Housing units with both a second mortgage and home equity loan
88 (0.1%)
611 (2.9%)
Housing units with a mortgage
77,313 (80.9%)
20,601 (98.7%)
Housing units with a home equity loan
4,029 (4.2%)
0 (0%)
Housing units with a second mortgage
5,649 (5.9%)
975 (4.7%)
Housing units lacking complete kitchen facilities
0.4%
0.8%
Housing units lacking complete plumbing facilities
Self-employed workers in own not incorporated business
11,886
4,883
State government workers
4,379
1,369
Unpaid family workers
466
373
Industries and Occupations
As earlier mentioned, the leading industries in Northeast Tarrant include healthcare, retail, and scientific services. In Mesquite, industrial work and manufacturing take the lead. Both cities maintain a balanced occupational structure, promoting a vibrant workforce.
Both Northeast Tarrant and Mesquite are served by a network of healthcare services, including hospitals, clinics, and urgent care centers. Northeast Tarrant hosts facilities like Baylor Scott & White Medical Center, while Mesquite features the Dallas Regional Medical Center.
Health (county statistics)
Type
Northeast Tarrant
Mesquite
General health status score of residents in this county from 1 (poor) to 5 (excellent)
Northeast Tarrant boasts of an impressive infrastructure, with well-planned roads, public buildings, and residential areas. However, Mesquite isn't far behind, featuring efficient roadways and public services that facilitate seamless movement within the city.
Infrastructure
Type
Northeast Tarrant
Mesquite
TV stations
25
25
Culture and Food
Both Northeast Tarrant and Mesquite offer vibrant cultural scenes. Northeast Tarrant, a melting pot of cultures, offers diverse food, music, and art scenes. Similarly, Mesquite is known for the Mesquite Arts Center and its world-famous Mesquite Championship Rodeo, and boasts various dining options ranging from Tex-Mex to barbecue.
Sports Teams
While Northeast Tarrant and Mesquite do not have professional sports teams of their own, they both fall under the Dallas-Fort Worth metroplex, which plays host to the Dallas Cowboys (NFL), Dallas Stars (NHL), Dallas Mavericks (NBA), and Texas Rangers (MLB). The cities' proximity to these teams lets residents and tourists enjoy high-profile sports events.
 Northeast Tarrant, TX
 Mesquite, TX