Choosing between Northeast Tarrant and Plano, TX is a matter of preference. Safety, weather, cost, education, work opportunities, and lifestyle options play a significant role. Northeast Tarrant is part of the larger Dallas-Fort Worth metroplex, known for its suburban comforts, while Plano is a vibrant city, popular for its thriving business scene. The comparison opens a detailed evaluation of both these Texan locations.
Safety is a key consideration when relocating to a new area. Northeast Tarrant's crime rate is quite a bit higher than that of Plano. According to FBI crime data analysis, Northeast Tarrant has a higher property crime rate and slightly elevated violent crime rate compared to Plano, which is generally considered one of Texas' safer cities. However, neighborhoods within both locations have distinct crime profiles, so researching individual areas is recommended.
Cost of Living
The cost of living in Northeast Tarrant is generally lower than in Plano. This includes groceries, housing, utilities, and healthcare expenses. Specifically, home prices are significantly less in Northeast Tarrant, which can be appealing for those considering to relocate. However, Plano offers a diverse mix of high-end and budget-friendly amenities that might appeal to residents and visitors who appreciate upscale living.
Income Tax
Suprisingly, personal income taxation is non-existent at the state level in Texas, which benefits residents of both Northeast Tarrant and Plano. Consequently, the tax burden in these areas is primarily dependent on property and sales taxes.
Property Tax
Property taxes can be a significant expense. The property tax rate in Northeast Tarrant is slightly less than that in Plano, providing an advantage for home owners. These rates, though, can vary by specific area within each city.
Sales Tax
Texas does not have a state income tax, so residents in both Northeast Tarrant and Plano typically pay lower taxes. However, local sales tax rates do differ. Northeast Tarrant has a slightly higher sales tax rate than Plano.
Income
Type
Northeast Tarrant
Plano
Estimated median household income
$90,881
$95,002
Estimated per capita income
$45,353
$49,792
Cost of living index (U.S. average is 100)
102
96.2
If you make $50,000 in Plano, you will have to make $53,015 in Northeast Tarrant to maintain the same standard of living.
Geographical Conditions
Both Northeast Tarrant and Plano are landlocked and flat, typical to the Texas landscape. Their geography features open spaces which are favorable to suburban development. They're also close to several man-made lakes, offering opportunities for watersports and outdoor recreation.
Geographical information
Type
Northeast Tarrant
Plano
Land area
206.9 sq. miles
71.6 sq. miles
Population density
2,284.3 people per sq. mile
4,027.8 people per sq. mile
Relative area comparison
Northeast Tarrant, TX Plano, TX
Education
Education in both Northeast Tarrant and Plano is highly rated. Both locations are served by excellent public school districts, including Northeast Independent School District and Plano ISD. Plano's schools, however, consistently rank higher in statewide rankings. For those seeking higher education, Plano's proximity to Dallas provides easy access to universities such as the University of Texas at Dallas and Dallas Baptist University.
Job opportunities are abundant in both areas, but they differ in focus. Northeast Tarrant benefits from the larger Dallas-Fort Worth metroplex economy, with diverse job sectors. Plano, however, has a more technology-focused economy and is home to many corporate headquarters. Regardless of where you choose to work, the unemployment rate is quite low in both areas.
Biggest Employers
The biggest employers in Northeast Tarrant include Texas Health Resources and the Hurst-Euless-Bedford Independent School District. Plano's largest employers include various high-profile tech companies and corporations, including Toyota, J.C. Penny, and Capital One.
In Northeast Tarrant (Tarrant County), 41.4% voted for Democrats and 57.1% for Republicans in 2012 Presidential Election. In Plano (Collin County), 33.6% voted for Democrats and 65.2% for Republicans.
Elections
Type
Democrats
Republicans
Other
Year
Northeast Tarrant
Plano
Northeast Tarrant
Plano
Northeast Tarrant
Plano
2020
49.3%
47.1%
49.1%
51.4%
1.6%
1.5%
2016
43.2%
39.0%
51.8%
55.7%
5.0%
5.4%
2012
41.4%
33.6%
57.1%
65.2%
1.4%
1.2%
2008
43.8%
36.7%
55.5%
62.3%
0.7%
1.0%
2004
37.0%
28.2%
62.5%
71.3%
0.5%
0.6%
2000
36.9%
24.5%
60.9%
73.2%
2.3%
2.3%
1996
41.6%
28.5%
50.9%
63.0%
7.5%
8.5%
Breakdown of population affiliated with a religious congregation
Type
Adherents
Congregations
Religion
Northeast Tarrant
Plano
Northeast Tarrant
Plano
SOUTHERN BAPTIST CONVENTION
17.3%
10.1%
33.3%
29.1%
CATHOLIC CHURCH
11.1%
14.2%
1.9%
1.6%
MUSLIM ESTIMATE
2.2%
2.9%
0.9%
1.9%
LUTHERAN CHURCH
0.5%
0.8%
0.9%
1.4%
SEVENTH DAY ADVENTIST CHURCH
0.4%
0.1%
1.6%
0.8%
EPISCOPAL CHURCH
0.3%
0.2%
0.8%
1.0%
EVANGELICAL LUTHERAN CHURCH IN AMERICA
0.3%
0.3%
0.9%
1.0%
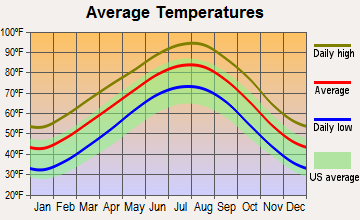
Weather
Residents in both Northeast Tarrant and Plano enjoy a humid subtropical climate. Summers are long, hot, and the winters mild to cool. Northeast Tarrant experiences slightly higher temperature in summer. For visitors, the weather might be more comfortable in Plano during summer. Every so often, both cities experience severe weather conditions, such as thunderstorms and hail.
Weather and climate
Type
Northeast Tarrant
Plano
Temperature - Average
64.6°F
64.2°F
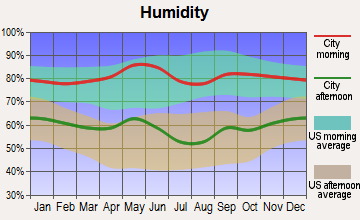
Humidity - Average morning or afternoon humidity
71.3%
71.3%
Humidity - Differences between morning and afternoon humidity
34%
34%
Humidity - Maximum monthly morning or afternoon humidity
82%
82%
Humidity - Minimum monthly morning or afternoon humidity
48%
48%
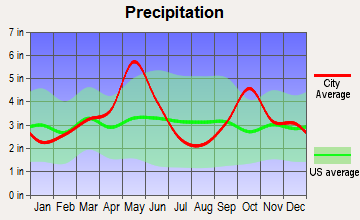
Precipitation - Yearly average
37.2 in
40.2 in
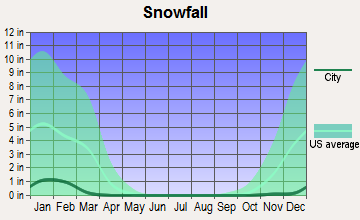
Snowfall - Yearly average
4.2 in
4.2 in
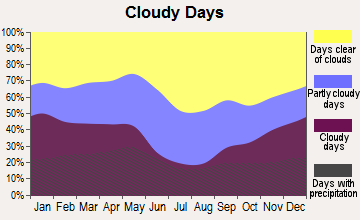
Clouds - Number of days clear of clouds
22.8%
22.8%
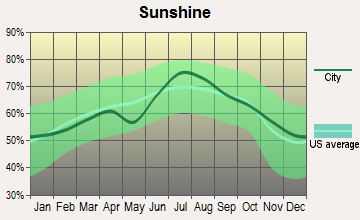
Sunshine amount - Average
66.6%
66.6%
Sunshine amount - Differences during a year
20%
20%
Sunshine amount - Maximum monthly
74%
74%
Sunshine amount - Minimum monthly
54%
54%
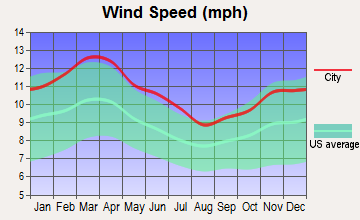
Wind speed - Average
10.3 mph
10.3 mph
Average climate in Northeast Tarrant, Texas
Average climate in Plano, Texas
Air pollution
Type
AQI
CO
NO2
OZONE
PB
PM25
SO2
Year
Northeast Tarrant
Plano
Northeast Tarrant
Northeast Tarrant
Plano
Northeast Tarrant
Plano
Plano
Northeast Tarrant
Plano
Northeast Tarrant
Plano
2018
86
85
N/A
N/A
5.8
5.8
27.9
30.1
N/A
N/A
9.2
9.7
0.4
0.4
2017
84
84
N/A
N/A
5.9
5.8
28.0
31.4
N/A
N/A
8.6
9.1
0.3
0.3
2016
75
77
N/A
N/A
6.2
6.4
26.4
29.9
N/A
N/A
8.2
8.4
0.2
0.2
2015
81
84
N/A
N/A
6.5
7.2
25.7
30.0
N/A
N/A
8.5
8.9
0.3
0.3
2014
77
83
0.22
N/A
6.6
6.1
27.1
30.9
N/A
N/A
9.4
9.9
0.3
0.3
2013
95
95
0.25
N/A
6.8
7.0
28.0
32.2
N/A
N/A
11.3
13.0
0.2
0.2
2012
108
112
0.26
N/A
8.1
8.5
30.7
34.3
N/A
N/A
10.8
12.0
0.3
0.3
2011
98
98
0.23
N/A
8.0
9.1
30.8
33.9
N/A
N/A
10.2
11.9
0.6
0.6
2010
76
78
0.23
N/A
8.7
9.7
28.0
30.8
N/A
N/A
8.5
N/A
0.7
0.7
2009
93
86
0.25
N/A
8.9
9.6
29.1
31.5
N/A
N/A
8.7
N/A
0.5
0.5
2008
89
82
0.25
N/A
9.7
9.9
27.5
32.3
0.121
N/A
9.4
N/A
0.5
0.5
2007
91
89
0.30
N/A
10.8
10.3
25.1
29.7
0.070
N/A
9.7
N/A
0.3
0.3
2006
99
103
0.34
N/A
10.6
10.5
30.2
33.7
0.106
N/A
9.5
N/A
0.7
0.7
2005
109
105
0.34
N/A
12.3
13.2
29.1
32.6
0.142
N/A
10.7
11.0
0.9
0.9
2004
90
92
0.39
N/A
11.6
11.8
25.7
29.2
0.099
N/A
N/A
N/A
0.8
0.8
2003
97
100
0.40
N/A
12.3
13.9
27.2
30.3
0.121
N/A
N/A
N/A
1.0
1.0
2002
97
96
0.37
N/A
13.0
14.3
25.4
29.1
0.080
N/A
N/A
N/A
0.4
0.4
2001
88
99
0.48
N/A
14.3
12.8
26.0
30.6
0.069
N/A
N/A
N/A
1.0
1.0
2000
104
107
0.55
N/A
14.5
14.5
27.1
31.7
0.092
N/A
N/A
N/A
1.1
1.1
Natural disasters
Type
Northeast Tarrant
Plano
Tornado activity compared to U.S. average
252.8%
252.9%
Earthquake activity compared to U.S. average
578.9%
596.9%
Natural disasters compared to U.S. average
23%
14%
Transportation
Being part of the Dallas-Fort Worth metroplex, Northeast Tarrant enjoys extensive public transit options, including train services from Trinity Metro, and bus services from Trinity Metro and Metro ArlingtonXpress. Plano, though smaller, is well-connected with Dallas Area Rapid Transit (DART) light rail and bus system. For commuting, Plano's network of highways includes the President George Bush Turnpike and Dallas North Tollway.
Transport
Type
Northeast Tarrant
Plano
Amtrak stations nearby
1
1
FAA registered aircraft
0
266
FAA registered aircraft manufacturers and dealers
0
11
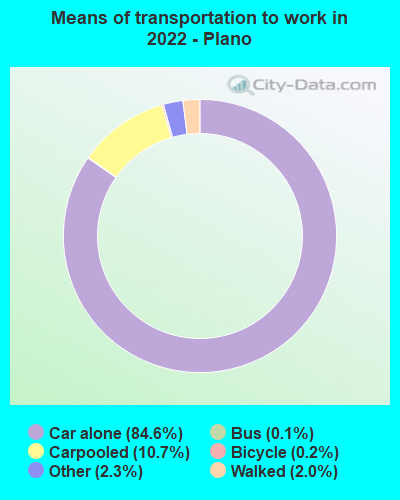
Means of transportation to work
Type
Northeast Tarrant
Plano
Bicycle
0.2%
0.1%
Bus
0%
0.4%
Carpooled
9.8%
7.8%
Car alone
84.8%
89.2%
Motorcycle
0.1%
0.1%
Walked
0.9%
1.2%
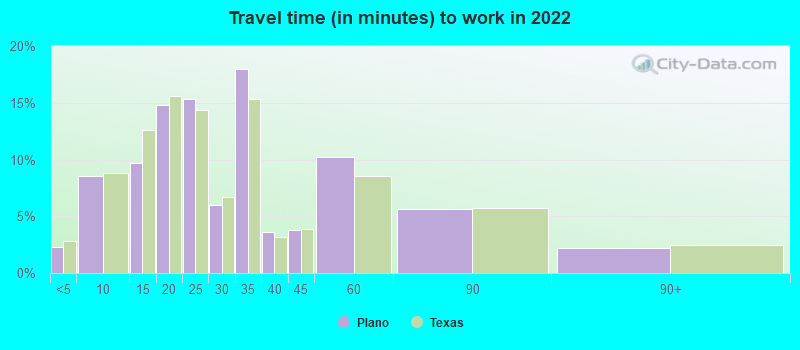
Average travel time to work
Type
Northeast Tarrant
Plano
Average
26.8 min
28.8 min
Real Estate
Real estate in both areas is healthy. Northeast Tarrant offers more affordable housing options, while Plano has a higher median home price. Housing options in both areas range from modern condos to traditional single-family homes. For renters, properties in Northeast Tarrant tend to be more affordable.
Neighborhoods
Everything from quiet, tree-lined streets to bustling downtown areas can be found in both locations. Neighborhoods in Northeast Tarrant tend to be quieter, more suburban, and family-friendly. Plano is known for its well-planned, affluent neighborhoods, as well as vibrant, urban areas.
Houses and residents
Type
Northeast Tarrant
Plano
Houses
155,788
114,797
Average household size (people)
2.7
2.6
Houses occupied
149,489 (96%)
108,472 (94.5%)
Houses occupied by owners
101,491 (67.9%)
60,883 (56.1%)
Houses occupied by renters
47,998 (32.1%)
47,589 (43.9%)
Median rent asked for vacant for-rent units
$1,297
$1,491
Median price asked for vacant for-sale houses and condos
$288,870
$1,044,402
Estimated median house or condo value
$337,949
$387,200
Median number of rooms in apartments
4.1
4
Median number of rooms in houses and condos
6.5
7.6
Renting percentage
32.5%
37%
Housing density (houses/condos per square mile)
752.8
1,604.1
Household income disparities
38.7%
41.5%
Housing units without a mortgage
18,262 (19.1%)
744 (2%)
Housing units with both a second mortgage and home equity loan
88 (0.1%)
1,681 (4.4%)
Housing units with a mortgage
77,313 (80.9%)
37,102 (98%)
Housing units with a home equity loan
4,029 (4.2%)
86 (0.2%)
Housing units with a second mortgage
5,649 (5.9%)
2,508 (6.6%)
Housing units lacking complete kitchen facilities
0.4%
1.9%
Housing units lacking complete plumbing facilities
Self-employed workers in own not incorporated business
11,886
7,541
State government workers
4,379
4,098
Unpaid family workers
466
57
Industries and Occupations
Northeast Tarrant's economy is diverse, with sectors including healthcare, retail trade, and education being significant employers. In contrast, Plano is known as a technology and corporate hub, with companies like Capital One, Toyota Motors North America, and J.C Penny headquartered there.
Access to healthcare is good in both locations. Northeast Tarrant has access to high-quality medical centers in the larger Dallas-Fort Worth metroplex, while Plano has several hospitals within city limits, including the highly-ranked Texas Health Presbyterian Hospital Plano.
The infrastructure in Plano is generally more developed than Northeast Tarrant, with modern buildings and facilities. There is also greater access to broadband internet. However, Northeast Tarrant does not lack behind, with recent investments in infrastructure development to accommodate its growing population.
Infrastructure
Type
Northeast Tarrant
Plano
TV stations
25
25
Culture and Food
Culturally, both Northeast Tarrant and Plano are diversely rich and offer a wide array of experiences. Northeast Tarrant has a small-town charm with annual festivals, while Plano, being an international business hub, offers a diverse food scene, higher-end dining, and cultural events.
Sports Teams
While Northeast Tarrant doesn't host any major sports teams, it's a short commute to Dallas, where fans can enjoy Dallas Cowboys (NFL), Dallas Mavericks (NBA), and Texas Rangers (MLB). Plano, despite not playing host to major sports teams, harbours excellent sports facilities for recreational athletes.
 Northeast Tarrant, TX
 Plano, TX