Given the economic, cultural, and quality of life differences, a move from Tulsa, Oklahoma, to Northeast Tarrant, Texas might be in the best interest of some individuals, whereas others might prefer to remain in Tulsa. This evaluation focuses on numerous distinct aspects of each location including safety, cost of living, and culture, to help you make a more informed decision about where to settle down.
Both cities exhibit standard levels of crime for mid-sized American cities. Tulsa, OK, has a slightly higher crime rate than the national average with property crimes being more common. Northeast Tarrant, TX also has crime rates that are comparable to the national average, but violent crimes happen less frequently than in Tulsa. Check local neighborhood crime rates before making a move to a specific area for a more detailed picture.
Cost of Living
Living in Northeast Tarrant, TX tends to be more affordable than in Tulsa, OK. While both cities have lower than average cost of living when compared to the national average, Northeast Tarrant has a significant edge in terms of housing, healthcare, and transportation costs. Food and grocery costs are roughly equal between the two cities.
Income Tax
Texas does not have a state income tax, which is a significant financial incentive for many considering a move to the state. Astronomically, Oklahoma imposes a state income tax, with rates varying between 0.5% to 5% based on income levels.
Property Tax
Property taxes tend to be higher in Texas than in Oklahoma, a significant point to consider for homebuyers. Both states provide homestead exemptions, which can lower the tax burden for homeowners.
Sales Tax
Texas has a higher sales tax rate compared to Oklahoma. Northeast Tarrant residents face a 6.25% state sales tax and 2% local sales tax. Tulsa residents, on the other hand, pay 4.5% in state sales tax and 3.167% in local sales tax, totaling 7.667%.
Income
Type
Northeast Tarrant
Tulsa
Estimated median household income
$90,881
$51,008
Estimated per capita income
$45,353
$33,002
Cost of living index (U.S. average is 100)
102
86.5
If you make $50,000 in Tulsa, you will have to make $58,960 in Northeast Tarrant to maintain the same standard of living.
Geographical Conditions
Both cities have flat topography, typical in the Great Plains region. Northeast Tarrant is closer to man-made lakes and rivers, offering more opportunities for water-related activities. Tulsa meanwhile is nestled in the Green Country of Oklahoma, known for its rolling green hills.
Geographical information
Type
Northeast Tarrant
Tulsa
Land area
206.9 sq. miles
182.6 sq. miles
Population density
2,284.3 people per sq. mile
2,252.4 people per sq. mile
Relative area comparison
Northeast Tarrant, TX Tulsa, OK
Education
Both places offer good public and private schools, with similar performance ratings. Northeast Tarrant, being part of the metropolitan Dallas-Fort Worth area, has more access to higher education with multiple colleges and universities in proximity. Tulsa does host several institutions of higher learning, including the University of Tulsa.
The Tulsa economy depends more on the energy sector, with a significant number of high-paying jobs in this area. Northeast Tarrant, being part of the larger Dallas-Fort Worth metroplex, has a more diversified economy, with jobs spread across tech, finance, and healthcare sectors. Unemployment rates are similar in both cities but tend to be slightly lower in Northeast Tarrant.
Biggest Employers
In Tulsa, some of the biggest employers include American Airlines, Saint Francis Health System, and the University of Tulsa. In Northeast Tarrant, large employers include AMR Corporation (American Airlines), Texas Health Resources, and Lockheed Martin.
In Northeast Tarrant (Tarrant County), 41.4% voted for Democrats and 57.1% for Republicans in 2012 Presidential Election. In Tulsa (Tulsa County), 36.3% voted for Democrats and 63.7% for Republicans.
Elections
Type
Democrats
Republicans
Other
Year
Northeast Tarrant
Tulsa
Northeast Tarrant
Tulsa
Northeast Tarrant
Tulsa
2020
49.3%
40.9%
49.1%
56.5%
1.6%
2.7%
2016
43.2%
35.6%
51.8%
58.4%
5.0%
6.1%
2012
41.4%
36.3%
57.1%
63.7%
1.4%
0.0%
2008
43.8%
37.8%
55.5%
62.2%
0.7%
0.0%
2004
37.0%
35.6%
62.5%
64.4%
0.5%
0.0%
2000
36.9%
37.3%
60.9%
61.3%
2.3%
1.3%
1996
41.6%
37.1%
50.9%
53.6%
7.5%
9.3%
Breakdown of population affiliated with a religious congregation
Type
Adherents
Congregations
Religion
Northeast Tarrant
Tulsa
Northeast Tarrant
Tulsa
SOUTHERN BAPTIST CONVENTION
17.3%
14.9%
33.3%
18.6%
CATHOLIC CHURCH
11.1%
8.1%
1.9%
3.1%
MUSLIM ESTIMATE
2.2%
0.5%
0.9%
0.7%
LUTHERAN CHURCH
0.5%
0.7%
0.9%
1.2%
SEVENTH DAY ADVENTIST CHURCH
0.4%
0.4%
1.6%
1.1%
EPISCOPAL CHURCH
0.3%
0.8%
0.8%
1.3%
EVANGELICAL LUTHERAN CHURCH IN AMERICA
0.3%
0.4%
0.9%
0.9%
AMERICAN BAPTIST CHURCHES IN THE USA
0.0%
0.3%
0.1%
0.5%
INTERNA PENTECO HOLINESS CHURCH
0.0%
0.7%
0.1%
0.7%
NATIONAL ASSOCIATION FREE WILL BAPTISTS
0.0%
0.5%
0.1%
3.1%
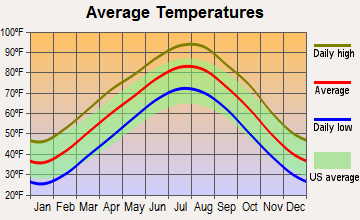
Weather
Northeast Tarrant has a subtropical climate, heavily influenced by its southern location. Expect long, hot summers and mild winters. Tulsa, on the other hand, experiences a typical midwestern climate, with hot summers and somewhat colder winters. Tornado activity can occur in both areas due to their proximity to Tornado Alley.
Weather and climate
Type
Northeast Tarrant
Tulsa
Temperature - Average
64.6°F
60.4°F
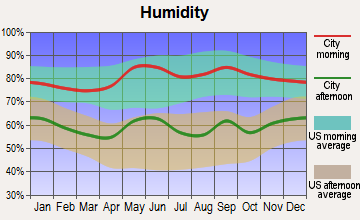
Humidity - Average morning or afternoon humidity
71.3%
73.8%
Humidity - Differences between morning and afternoon humidity
34%
33%
Humidity - Maximum monthly morning or afternoon humidity
82%
85%
Humidity - Minimum monthly morning or afternoon humidity
48%
52%
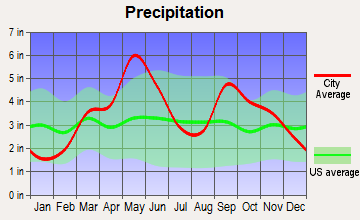
Precipitation - Yearly average
37.2 in
42.1 in
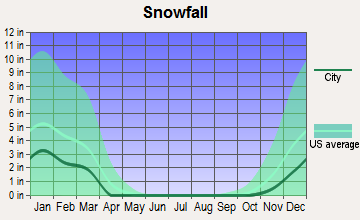
Snowfall - Yearly average
4.2 in
18.4 in
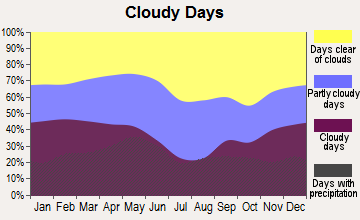
Clouds - Number of days clear of clouds
22.8%
21.1%
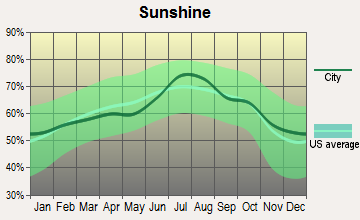
Sunshine amount - Average
66.6%
64.8%
Sunshine amount - Differences during a year
20%
24%
Sunshine amount - Maximum monthly
74%
74%
Sunshine amount - Minimum monthly
54%
50%
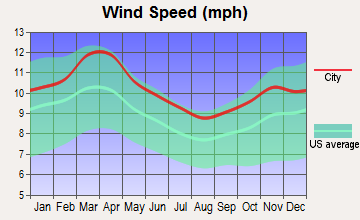
Wind speed - Average
10.3 mph
10.2 mph
Average climate in Northeast Tarrant, Texas
Average climate in Tulsa, Oklahoma
Air pollution
Type
AQI
CO
NO2
OZONE
PB
PM25
SO2
Year
Northeast Tarrant
Tulsa
Northeast Tarrant
Tulsa
Northeast Tarrant
Tulsa
Northeast Tarrant
Tulsa
Tulsa
Northeast Tarrant
Tulsa
Northeast Tarrant
Tulsa
2018
86
88
N/A
0.24
5.8
N/A
27.9
28.6
0.004
N/A
9.2
11.6
0.4
0.4
2017
84
80
N/A
0.22
5.9
N/A
28.0
29.9
0.004
N/A
8.6
10.2
0.3
0.5
2016
75
86
N/A
0.24
6.2
N/A
26.4
29.1
0.005
N/A
8.2
9.5
0.2
0.5
2015
81
74
N/A
0.25
6.5
N/A
25.7
28.1
0.004
N/A
8.5
8.6
0.3
0.8
2014
77
74
0.22
0.16
6.6
N/A
27.1
29.2
0.005
N/A
9.4
9.2
0.3
0.3
2013
95
85
0.25
0.21
6.8
N/A
28.0
29.8
0.005
N/A
11.3
10.1
0.2
0.5
2012
108
103
0.26
0.21
8.1
N/A
30.7
32.4
0.007
N/A
10.8
11.7
0.3
0.7
2011
98
108
0.23
0.27
8.0
N/A
30.8
33.8
0.005
N/A
10.2
13.8
0.6
0.8
2010
76
83
0.23
0.26
8.7
N/A
28.0
30.1
0.004
N/A
8.5
12.2
0.7
0.7
2009
93
88
0.25
0.26
8.9
N/A
29.1
29.8
0.004
N/A
8.7
12.2
0.5
0.7
2008
89
71
0.25
N/A
9.7
N/A
27.5
26.7
0.007
N/A
9.4
N/A
0.5
N/A
2007
91
77
0.30
0.32
10.8
N/A
25.1
28.8
0.007
N/A
9.7
N/A
0.3
0.8
2006
99
95
0.34
N/A
10.6
N/A
30.2
32.9
N/A
N/A
9.5
N/A
0.7
N/A
2005
109
84
0.34
N/A
12.3
N/A
29.1
28.9
N/A
N/A
10.7
N/A
0.9
N/A
2004
90
71
0.39
N/A
11.6
N/A
25.7
27.5
N/A
N/A
N/A
N/A
0.8
N/A
2003
97
94
0.40
N/A
12.3
N/A
27.2
29.2
N/A
N/A
N/A
N/A
1.0
N/A
2002
97
85
0.37
0.83
13.0
7.8
25.4
27.7
N/A
N/A
N/A
N/A
0.4
N/A
2001
88
102
0.48
0.75
14.3
14.4
26.0
30.6
N/A
N/A
N/A
N/A
1.0
N/A
2000
104
101
0.55
0.69
14.5
15.3
27.1
28.9
N/A
N/A
N/A
N/A
1.1
N/A
Natural disasters
Type
Northeast Tarrant
Tulsa
Tornado activity compared to U.S. average
252.8%
277.6%
Earthquake activity compared to U.S. average
578.9%
901.9%
Natural disasters compared to U.S. average
23%
34%
Transportation
Public transportation options are more plentiful and frequently used in Northeast Tarrant, with light rail, buses, and carpool options available. Tulsa primarily depends on personal vehicle use, with limited bus service. Commute times tend to be shorter in Northeast Tarrant due to its extensive public transit system.
Transport
Type
Northeast Tarrant
Tulsa
Amtrak stations
0
1
Amtrak stations nearby
1
1
FAA registered aircraft
0
808
FAA registered aircraft manufacturers and dealers
0
35
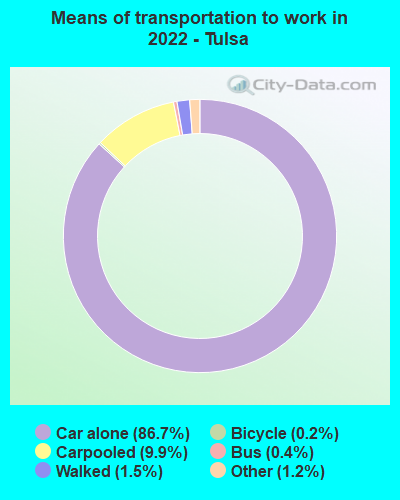
Means of transportation to work
Type
Northeast Tarrant
Tulsa
Bicycle
0.2%
0.1%
Bus
0%
0.1%
Carpooled
9.8%
9%
Car alone
84.8%
87.9%
Motorcycle
0.1%
0.1%
Taxicab
0.1%
0.1%
Walked
0.9%
1.4%
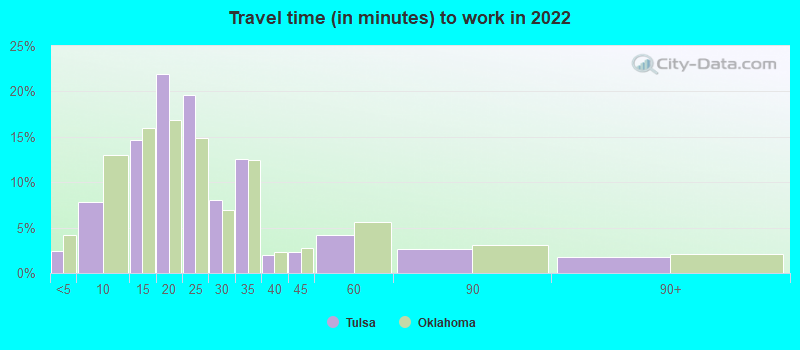
Average travel time to work
Type
Northeast Tarrant
Tulsa
Average
26.8 min
23.8 min
Real Estate
Home prices in Northeast Tarrant tend to be slightly higher than Tulsa, reflecting the city's overall higher cost of living. However, renters might find similar prices in both cities. The home ownership rate is higher in Northeast Tarrant, suggesting a more stable housing market.
Neighborhoods
Northeast Tarrant offers a diverse array of neighborhoods that cater to different lifestyles, such as suburban, family-focused communities and more urban, single-professional focused areas. Similarly, Tulsa hosts various neighborhoods known for their heritage and historic charm, as well as more modern districts attracting younger populations.
Houses and residents
Type
Northeast Tarrant
Tulsa
Houses
155,788
194,402
Average household size (people)
2.7
2.3
Houses occupied
149,489 (96%)
173,943 (89.5%)
Houses occupied by owners
101,491 (67.9%)
89,307 (51.3%)
Houses occupied by renters
47,998 (32.1%)
84,636 (48.7%)
Median rent asked for vacant for-rent units
$1,297
$899.30
Median price asked for vacant for-sale houses and condos
$288,870
$163,212
Estimated median house or condo value
$337,949
$172,000
Median number of rooms in apartments
4.1
4.1
Median number of rooms in houses and condos
6.5
6.4
Renting percentage
32.5%
46.5%
Housing density (houses/condos per square mile)
752.8
1,064.4
Household income disparities
38.7%
48.1%
Housing units without a mortgage
18,262 (19.1%)
855 (1.7%)
Housing units with both a second mortgage and home equity loan
88 (0.1%)
2,464 (4.8%)
Housing units with a mortgage
77,313 (80.9%)
50,494 (98.3%)
Housing units with a home equity loan
4,029 (4.2%)
93 (0.2%)
Housing units with a second mortgage
5,649 (5.9%)
3,580 (7%)
Housing units lacking complete kitchen facilities
0.4%
2.9%
Housing units lacking complete plumbing facilities
Self-employed workers in own not incorporated business
11,886
13,964
State government workers
4,379
5,897
Unpaid family workers
466
284
Industries and Occupations
Tulsa's economy primarily focuses on the energy sector, particularly oil and gas. Confusingly, Northeast Tarrant has a more diversified economy, including technology, defense, finance, and healthcare. The median household income is higher in Northeast Tarrant, reflecting the higher paying jobs in these sectors.
Healthcare in Northeast Tarrant is highly rated with numerous high-quality hospitals and clinics. Tulsa also has well-rated healthcare facilities, including the Saint Francis Hospital, which is one of its largest employers.
Health (county statistics)
Type
Northeast Tarrant
Tulsa
General health status score of residents in this county from 1 (poor) to 5 (excellent)
Northeast Tarrant benefits from being part of the Dallas-Fort Worth metroplex, with well-developed public infrastructure including roads, parks, and public buildings. Tulsa's infrastructure is also well maintained, but it doesn't possess the same level of urban development seen in Northeast Tarrant due to its slightly smaller population.
Infrastructure
Type
Northeast Tarrant
Tulsa
TV stations
25
20
Culture and Food
Both cities offer rich cultural experiences. Tulsa is known for its vibrant arts scene, including renowned museums like the Philbrook and Gilcrease. Northeast Tarrant, as part of the Dallas-Fort Worth area, offers a blend of Texas charm and metropolitan culture. The food scene in both cities is robust, with Texas known for its barbecue and Tex-Mex while Tulsa offers a blend of classic American fare and international cuisine.
Sports Teams
Sports enthusiasts would find living in Northeast Tarrant more thrilling. The area hosts professional football, baseball, basketball, hockey, and soccer teams. Tulsa does have a professional soccer team, and college sports, particularly football, are extremely popular.
 Northeast Tarrant, TX
 Tulsa, OK