Oakland and Fremont are two significant cities located in the San Francisco Bay Area of California. Oakland is known for its vibrant culture, rich history, and diverse neighborhoods, while Fremont is recognized for its safe neighborhoods, strong education system, and considerable tech-industry presence. While each city has its unique advantages and challenges, their comparison in terms of crime and safety, weather, cost of living, education, and economic conditions reveal nuanced differences and similarities.
Distance between
Oakland, CA and
Fremont, CA : 22.0 miles
Oakland's population is larger by 91%. Its population has grown by 34,339 people (8.6%) since 2000. The population of Fremont has grown by 24,101 people (11.8%) during that time.
In terms of safety, Fremont is generally considered safer than Oakland. The violent crime rate in Oakland is higher than the national average, though efforts are continually being made to improve safety in the city. Conversely, Fremont has one of the lowest crime rates among cities its size in the Bay Area, making it a desired location for families and retirees. However, like any urban areas, both cities do experience crime.
City-data.com crime index counts serious crimes and violent crime more heavily. It adjusts for the number of visitors and daily workers commuting into cities. (higher means more crime, U.S. average = 301.1)
City-data.com crime index counts serious crimes and violent crime more heavily. It adjusts for the number of visitors and daily workers commuting into cities. (higher means more crime, U.S. average = 301.1)
Sex Offenders
According to our data, there are 916 registered sex offenders living in Oakland and 106 registered sex offenders living in . The ratio of residents to sex offenders in Oakland is 459 to 1; the ratio in Fremont is 2,199 to 1. The number of registered sex offenders compared to the number of residents is much larger in Oakland than that in Fremont.
Cost of Living
The cost of living in both Oakland and Fremont is significantly higher than the national average, consistent with many cities in California. However, Oakland tends to be cheaper than Fremont, particularly when it comes to housing. While both cities are expensive, the cost of living is slightly more affordable in Oakland.
Income Tax
California has a progressive income tax, which means rates are based on income level. Both cities follow the same state tax system, and residents may have to pay the same rates, which can go as high as 13.3% for top earners.
Property Tax
The property tax in both Oakland and Fremont is based on the assessed value of the property. While rates can vary, generally, Fremont has slightly lower property tax rates compared to Oakland.
Sales Tax
The sales tax in both Oakland and Fremont is higher than the national average, with Oakland having a slightly higher rate. The current total local sales tax rate in Oakland is 9.25%, while in Fremont, it's 9.25%.
Income
Type
Oakland
Fremont
Estimated median household income
$82,236
$155,968
Estimated per capita income
$49,966
$64,320
Cost of living index (U.S. average is 100)
126.7
124.5
If you make $50,000 in Fremont, you will have to make $50,884 in Oakland to maintain the same standard of living.
Geographical Conditions
Oakland occupies a unique geographical location with the city center situated on the Bay, and the city stretching into the East Bay hills. Fremont too, has a varied geography ranging from flatlands to rolling hills. Both cities are subject to the fault lines running through the Bay Area with the attendant risks of earthquakes.
The education system in Fremont is rated higher than that in Oakland. Fremont schools consistently rank above the state and national averages, making the city a popular choice for parents. Although Oakland has some highly rated schools and educational programs, it also has several schools struggling with low test scores and other challenges.
Oakland has a more diverse economy with healthcare, professional services, and retail trade being the largest sectors. Fremont, on the other hand, is a significant hub for the tech industry. Major global tech companies have their bases in Fremont, opening wide job opportunities in technology and associated services.
Biggest Employers
In Oakland, the biggest employers include Kaiser Permanente, the City of Oakland, and the Unified School District. Fremont's largest employers are tech-based, with Tesla, Lam Research, and Western Digital employing a significant portion of the local workforce.
There were 114 building permits issued in Oakland in 2012 (73 more than in 2011) compared to 141 building permits issued in Fremont in 2012 (14 more than in 2011).
Weather
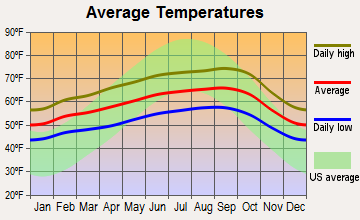
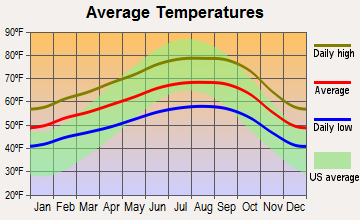
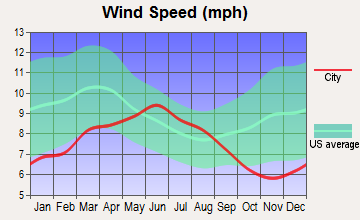
The weather in both cities is relatively mild throughout the year due to their coastal Californian locations. They experience a Mediterranean climate, characterized by dry summers and relatively wet winters. However, Oakland is generally cooler and has more fog than Fremont due to its close proximity to the San Francisco Bay.
Weather and climate
Type
Oakland
Fremont
Temperature - Average
59.1°F
60°F
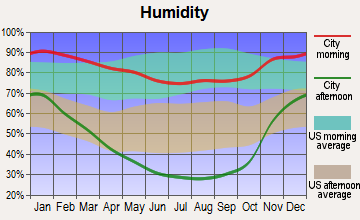
Humidity - Average morning or afternoon humidity
84.2%
81.4%
Humidity - Differences between morning and afternoon humidity
29%
29.9%
Humidity - Maximum monthly morning or afternoon humidity
90.9%
87.6%
Humidity - Minimum monthly morning or afternoon humidity
61.9%
57.7%
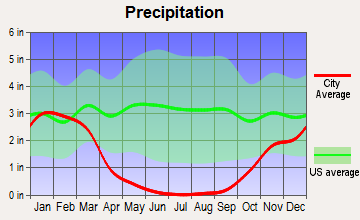
Precipitation - Yearly average
23.5 in
14.9 in
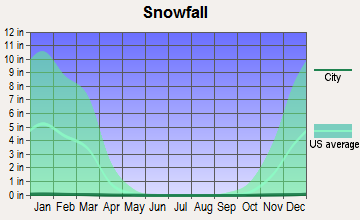
Snowfall - Yearly average
0 in
0 in
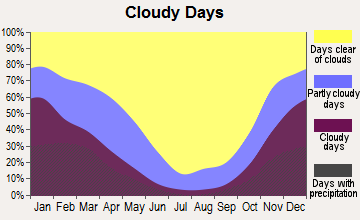
Clouds - Number of days clear of clouds
26.9%
27%
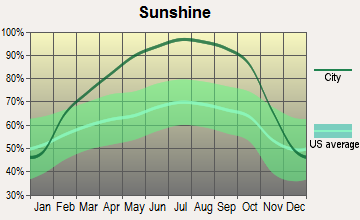
Sunshine amount - Average
73%
73.2%
Sunshine amount - Differences during a year
22%
22.3%
Sunshine amount - Maximum monthly
77%
77.1%
Sunshine amount - Minimum monthly
55%
54.8%
Wind speed - Average
11.4 mph
11 mph
Average climate in Oakland, California
Average climate in Fremont, California
Air pollution
Type
AQI
CO
NO2
OZONE
PB
PM25
SO2
Year
Oakland
Fremont
Oakland
Fremont
Oakland
Fremont
Oakland
Fremont
Oakland
Fremont
Oakland
Fremont
Oakland
Fremont
2018
105
101
0.46
0.47
13.0
12.5
20.9
25.7
0.012
0.006
13.7
12.3
0.4
0.3
2017
100
101
0.48
0.45
13.5
11.9
21.2
25.0
0.008
0.004
11.3
9.8
0.5
0.3
2016
80
94
0.41
0.41
12.9
11.0
20.3
24.2
0.005
0.003
7.9
8.2
0.9
0.4
2015
93
96
0.43
0.45
14.5
12.5
20.6
24.1
0.004
0.004
9.5
8.4
0.8
0.4
2014
90
93
0.42
0.40
14.7
12.2
20.6
23.4
0.005
0.004
9.1
8.0
0.5
0.3
2013
89
98
0.39
0.41
15.2
12.3
18.0
21.7
0.004
0.004
11.6
10.4
0.5
0.4
2012
87
85
0.38
0.38
13.7
10.9
18.7
22.9
0.003
0.002
8.5
8.3
0.7
0.7
2011
94
93
0.32
0.39
14.4
12.0
18.5
22.7
0.003
0.002
10.1
10.0
1.1
0.7
2010
90
92
0.21
0.38
14.4
12.2
19.4
19.9
0.013
0.002
8.4
8.7
1.0
0.5
2009
99
98
0.22
0.38
15.2
13.0
19.0
20.3
0.006
0.004
11.3
9.6
1.3
0.6
2008
110
112
0.29
0.44
15.1
14.0
20.1
21.4
0.006
N/A
12.4
10.8
1.0
N/A
2007
100
102
0.41
0.44
13.4
14.2
21.3
20.7
0.006
0.007
9.5
9.8
1.1
N/A
2006
106
109
0.47
0.51
13.8
15.3
22.6
21.6
N/A
N/A
9.4
10.5
1.3
N/A
2005
97
104
0.56
0.46
13.3
15.4
15.3
19.7
N/A
N/A
9.6
11.5
1.4
N/A
2004
107
109
0.51
0.39
14.3
15.1
15.3
20.5
0.004
N/A
11.3
10.9
1.8
N/A
2003
82
90
0.63
0.44
16.1
17.0
15.8
21.3
N/A
N/A
N/A
N/A
1.7
N/A
2002
81
90
0.69
0.54
18.8
19.3
16.7
20.5
0.008
0.005
N/A
N/A
1.6
1.6
2001
87
87
0.70
0.54
17.2
19.4
12.7
19.6
0.008
0.005
N/A
N/A
1.5
N/A
2000
78
89
0.84
0.56
17.1
19.6
11.8
18.1
0.012
0.005
N/A
N/A
1.8
N/A
Natural disasters
Type
Oakland
Fremont
Tornado activity compared to U.S. average
8.8%
9.5%
Earthquake activity compared to U.S. average
7,647.7%
7,767.1%
Natural disasters compared to U.S. average
20%
20%
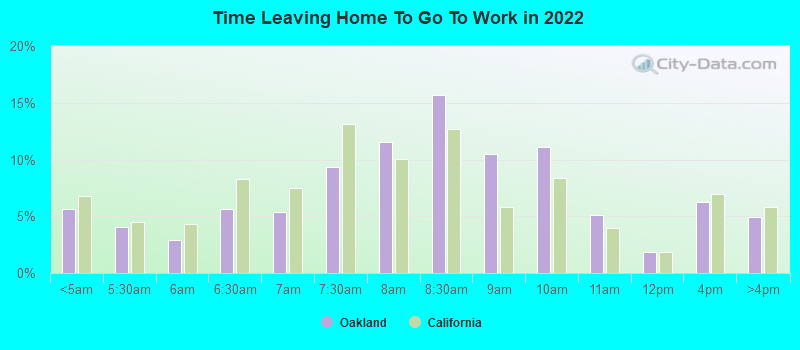
Transportation
Both Oakland and Fremont are well-served by public transportation, including BART (Bay Area Rapid Transit) which makes commuting to other parts of the Bay Area easy. However, traffic congestion can be a concern, especially during peak commuting hours.
Transport
Type
Oakland
Fremont
Amtrak stations
1
1
Amtrak stations nearby
3
3
FAA registered aircraft
154
54
FAA registered aircraft manufacturers and dealers
2
2
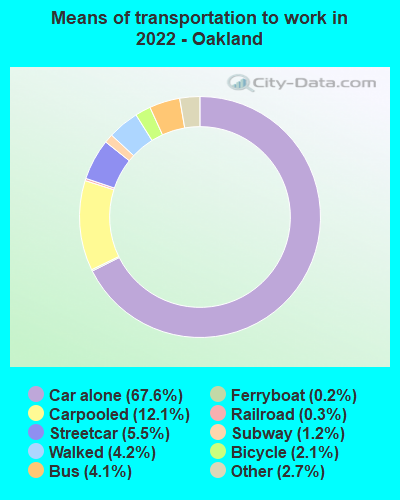
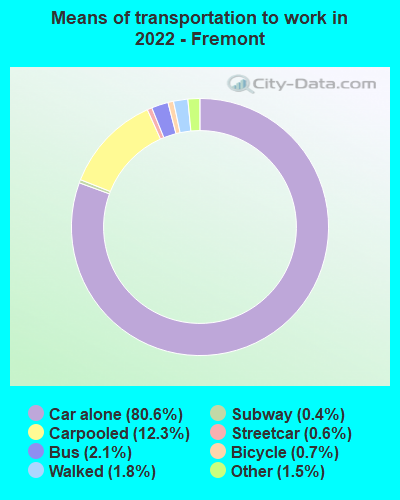
Means of transportation to work
Type
Oakland
Fremont
Bicycle
1%
1.5%
Bus
3.2%
3.6%
Carpooled
12.6%
11.2%
Car alone
72.2%
79.7%
Ferryboat
0.1%
0.1%
Motorcycle
0.4%
0.3%
Railroad
0.1%
0.7%
Streetcar
2.3%
0.3%
Subway
0.5%
0.6%
Taxicab
0.1%
0.1%
Walked
5.5%
1%
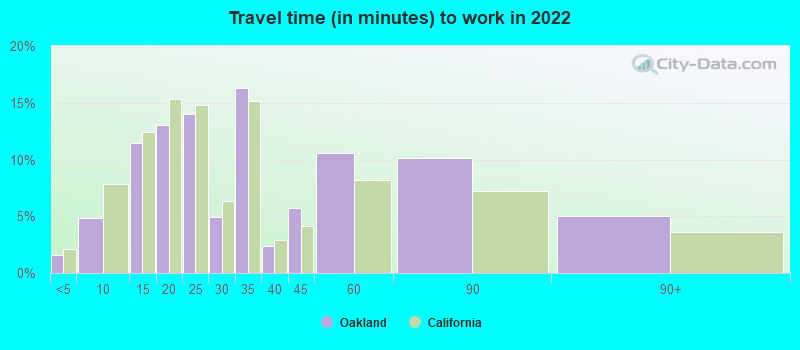
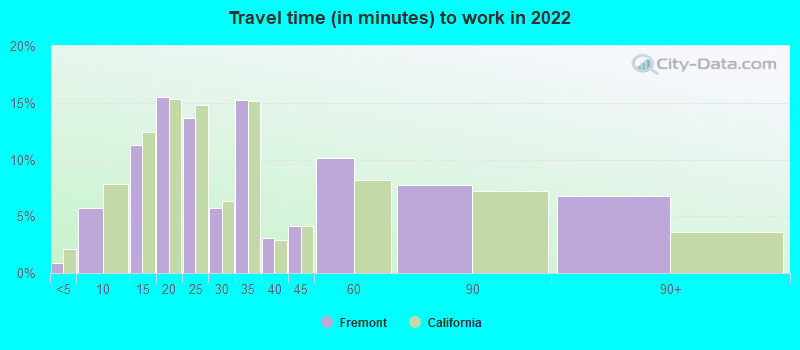
Average travel time to work
Type
Oakland
Fremont
Average
33.6 min
35.4 min
Other means
29 min
32.3 min
Public transportation
45.3 min
59.1 min
Private vehicle occupancy
Type
Oakland
Fremont
Average
1.2
1.1
Drove alone
88.1%
91.7%
In 2 person carpool
9.2%
6.4%
In 3 person carpool
2%
1.9%
In 4 person carpool
0.6%
0%
How many people usually rode to work in the car, truck or van.
Real Estate
The real estate market in both cities is competitive, with home prices significantly above the national average. However, prices in Fremont tend to be higher than in Oakland. Rent prices are also notably high in both cities but are generally more affordable in Oakland.
Neighborhoods
Both cities boast diverse neighborhoods with different vibes. Oakland is known for its eclectic mix of neighborhoods like vibrant Uptown, creative Fruitvale, and posh Rockridge. Fremont is divided into districts, including historic Niles, upscale Mission San Jose, and the more suburban Centerville.
Houses and residents
Type
Oakland
Fremont
Houses
186,660
79,480
Average household size (people)
2.5
3
Median year apartment built
1958
1982
Median year house/condo built
1943
1976
Length of stay in the house since moving in
15.4 years
14.3 years
Houses occupied
170,366 (91.3%)
75,716 (95.3%)
Houses occupied by owners
72,661 (42.7%)
46,436 (61.3%)
Houses occupied by renters
97,705 (57.4%)
29,280 (38.7%)
Median rent asked for vacant for-rent units
$3,127
$3,296
Median monthly housing costs
$1,921
$2,624
Median price asked for vacant for-sale houses and condos
$923,387
$1,442,729
Estimated median house or condo value
$848,600
Over $1,000,000
Median numbers of rooms
4.3
4.9
Median number of rooms in apartments
3.6
3.4
Median number of rooms in houses and condos
5.7
5.9
Median house price - detached houses
Over $1,000,000
Over $1,000,000
Median house price - in 2-unit structures
$781,885
$768,136
Median house price - in 3-to-4-unit structures
$716,428
$760,811
Median house price - in 5 or more unit structures
$709,698
$629,984
Median house price - mobile homes
$365,144
$188,169
Median house price - Townhouses or other attached units
$834,685
$938,095
Median house price - All housing units
$991,120
Over $1,000,000
Median house age
69
42
Renting percentage
58.9%
37.4%
Housing density (houses/condos per square mile)
3,329.9
1,036.4
House value disparities
22.3%
17.4%
Household income disparities
45.9%
33.8%
Median household income for houses/condes with a mortgage
$153,718
$217,141
Median household income for apartments without a mortgage
$81,904
$105,634
Housing units without a mortgage
1,176 (2.2%)
500 (1.5%)
Housing units with both a second mortgage and home equity loan
4,996 (9.4%)
2,014 (6.2%)
Housing units with a mortgage
51,720 (97.8%)
32,079 (98.5%)
Housing units with a home equity loan
139 (0.3%)
169 (0.5%)
Housing units with a second mortgage
6,096 (11.5%)
2,762 (8.5%)
House/condo owner moved in on average (years ago)
13
12
House/condo renter moved in on average (years ago)
4
1
Housing units lacking complete kitchen facilities
2.4%
1.3%
Housing units lacking complete plumbing facilities
1.6%
0.3%
Housing units in structures
Housing units in structures
Oakland
Fremont
One, detached
42.3%
55.0%
One, attached
4.9%
15.7%
Two
6.2%
0.7%
3 or 4
11.1%
2.3%
5 to 9
6.6%
3.5%
10 to 19
6.9%
2.7%
20 to 49
9.9%
3.5%
50 or more
11.7%
15.0%
Mobile homes
0.3%
1.6%
Boats, RVs, vans, etc.
0.1%
0.1%
Median real estate property taxes paid for housing units
Self-employed workers in own not incorporated business
20,615
5,630
State government workers
9,112
2,311
Unpaid family workers
529
0
Industries and Occupations
While Oakland's economy is broader in its industry and occupational mix, Fremont has a robust presence of the tech industry due to its location in Silicon Valley. The majority of jobs in Fremont are in high tech, scientific, and technical service fields, whereas Oakland offers more variety, with healthcare, social services, and education ranking highly.
Arts, design, entertainment, sports, and media occupations
5.5%
1.9%
Personal care and service occupations
5.0%
2.5%
Building and grounds cleaning and maintenance occupations
4.6%
1.1%
Healthcare support occupations
4.4%
4.3%
Health diagnosing and treating practitioners and other technical occupations
4.3%
5.6%
Food preparation and serving related occupations
4.2%
3.4%
Community and social service occupations
3.2%
1.8%
Computer and mathematical occupations
3.0%
14.7%
Production occupations
2.8%
4.2%
Legal occupations
2.6%
1.7%
Life, physical, and social science occupations
2.6%
3.6%
Material moving occupations
2.5%
1.7%
Health technologists and technicians
2.0%
2.2%
Architecture and engineering occupations
1.3%
3.3%
Health Care
Oakland boasts several well-rated hospitals including UCSF Benioff Children's Hospital Oakland and Alta Bates Summit Medical Center. Fremont is home to Washington Hospital, a highly-rated healthcare provider in the region.
Oakland has many historic buildings and a vibrant downtown area. Its infrastructure is a mix of old and new developments. Conversely, most of Fremont's infrastructure is newer due to its significant growth and development in recent decades. It is home to numerous tech companies which further contribute to its modern and tech-influenced landscape.
Infrastructure
Type
Oakland
Fremont
Hospitals
9
7
TV stations
28
24
Bank branches located here
76
45
Bank institutions located here
29
20
Main business address for public companies
10
35
Drinking water stations with no reported violations in the past
10
3
Drinking water stations with reported violations in the past
HMDA - Conventional home purchase loans - Applications denied
Year
Oakland
Fremont
1999
1,291
898
2000
1,721
511
2001
1,244
341
2002
1,370
384
2003
2,021
859
2004
3,261
1,298
2005
3,850
1,454
2006
4,422
1,462
2007
2,645
941
2008
1,041
565
2009
700
363
Culture and Food
Oakland is rich in culture and diversity, known for its art scene, music, and festivals. The city boasts a vast array of dining options, featuring cuisines from around the world. Fremont also has a diverse cultural scene, with significant Asian and Indian communities influencing its culinary landscape.
Sports Teams
Oakland has been home to a variety of sports teams such as the Oakland Raiders (NFL), Golden State Warriors (NBA) and the Oakland A's (MLB). However, the Warriors and Raiders have recently relocated. Fremont doesn't host any major league teams but is close enough to enjoy sports in Oakland and San Francisco.

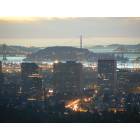


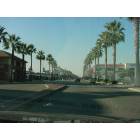
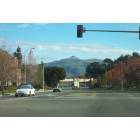

 Oakland, CA
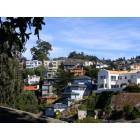
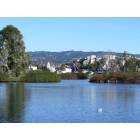
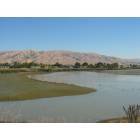
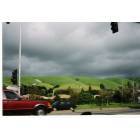
 Fremont, CA