This analysis offers a side-by-side consideration of life in Oklahoma City, OK, and Arlington, TX, two significant urban areas in the central United States. The comparison signifies the major characteristics of each city across various factors including crime rates, weather patterns, cost of living, education, economy, infrastructure, leading industries and employers, and real estate market. Comparison also extends to neighborhoods, public transit, tax structures, culinary culture, sports teams, geographical features, and healthcare services.
Distance between
Oklahoma City, OK and
Arlington, TX : 193.3 miles
Oklahoma City's population is larger by 75%. Its population has grown by 181,593 people (35.9%) since 2000. The population of Arlington has grown by 59,817 people (18.0%) during that time.
Oklahoma City has a slightly higher crime rate compared to Arlington when considering violent and property crimes. However, crime rates can fluctuate between different neighborhoods within each city. While both cities have law enforcement agencies actively working on reducing crime rates, it is always recommended for locals and visitors to remain aware of their surroundings and report suspicious activity.
City-data.com crime index counts serious crimes and violent crime more heavily. It adjusts for the number of visitors and daily workers commuting into cities. (higher means more crime, U.S. average = 301.1)
City-data.com crime index counts serious crimes and violent crime more heavily. It adjusts for the number of visitors and daily workers commuting into cities. (higher means more crime, U.S. average = 301.1)
Sex Offenders
According to our data, there are 1,386 registered sex offenders living in Oklahoma City and 594 registered sex offenders living in . The ratio of residents to sex offenders in Oklahoma City is 461 to 1; the ratio in Arlington is 661 to 1. The number of registered sex offenders compared to the number of residents is larger in Oklahoma City than in Arlington.
Cost of Living
Arlington, TX, is marginally more expensive than Oklahoma City when considering the cost of living. This includes factors like housing, groceries, healthcare, utilities, and others. Oklahoma City residents generally enjoy a lower cost of living, which can be an attractive factor for people considering relocation.
Income Tax
Oklahoma City's top state income tax rate is 5%, while Arlington residents enjoy a significant advantage here as Texas does not impose a state income tax.
Property Tax
Average property tax rate in Oklahoma is less than that in Texas. Consequently, homeowners in Oklahoma City generally pay less in property taxes than those in Arlington.
Sales Tax
Oklahoma City has a combined city and state sales tax rate of 8.63%, which is slightly lower than Arlington's rate of 8.25%.
Income
Type
Oklahoma City
Arlington
Estimated median household income
$59,214
$59,889
Estimated per capita income
$31,630
$31,722
Cost of living index (U.S. average is 100)
85.4
95.9
If you make $50,000 in Oklahoma City, you will have to make $56,148 in Arlington to maintain the same standard of living.
Geographical Conditions
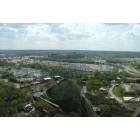
Oklahoma City is located in the Great Plains region and has a geographic diversity, ranging from flat plains to low hills. Arlington, on the other hand, is situated in North Texas in the prairie region, with generally flat terrain.
Arlington is known for its strong educational foundation, hosting the University of Texas at Arlington and various well-regarded primary and secondary schools. Oklahoma City also has robust education offerings, including Oklahoma City University and the University of Oklahoma Health Sciences Center.
Both cities have strong economies, with health care and education being significant sectors. Oklahoma City's economy is also strongly influenced by its livestock market, petroleum products, and natural gas. In contrast, Arlington is known for its entertainment and sporting sectors, hosting several major sporting venues.
Biggest Employers
The biggest employers in Oklahoma City include the State of Oklahoma, Integris Health, and the University of Oklahoma. In Arlington, top employers include Texas Health Resources, Arlington Independent School District, and the University of Texas at Arlington.
There were 4,127 building permits issued in Oklahoma City in 2012 (2834 more than in 2011) compared to 976 building permits issued in Arlington in 2012 (744 more than in 2011).
In Oklahoma City (Oklahoma County), 41.7% voted for Democrats and 58.3% for Republicans in 2012 Presidential Election. In Arlington (Tarrant County), 41.4% voted for Democrats and 57.1% for Republicans.
Elections
Type
Democrats
Republicans
Other
Year
Oklahoma City
Arlington
Oklahoma City
Arlington
Oklahoma City
Arlington
2020
48.1%
49.3%
49.2%
49.1%
2.7%
1.6%
2016
41.2%
43.2%
51.7%
51.8%
7.1%
5.0%
2012
41.7%
41.4%
58.3%
57.1%
0.0%
1.4%
2008
41.6%
43.8%
58.4%
55.5%
0.0%
0.7%
2004
35.8%
37.0%
64.2%
62.5%
0.0%
0.5%
2000
36.6%
36.9%
62.3%
60.9%
1.1%
2.3%
1996
36.5%
41.6%
54.7%
50.9%
8.8%
7.5%
Breakdown of population affiliated with a religious congregation
Type
Adherents
Congregations
Religion
Oklahoma City
Arlington
Oklahoma City
Arlington
SOUTHERN BAPTIST CONVENTION
20.7%
17.3%
20.0%
33.3%
CATHOLIC CHURCH
8.5%
11.1%
3.0%
1.9%
EPISCOPAL CHURCH
0.7%
0.3%
1.3%
0.8%
INTERNA PENTECO HOLINESS CHURCH
0.7%
0.0%
2.9%
0.1%
LUTHERAN CHURCH
0.5%
0.5%
1.0%
0.9%
SEVENTH DAY ADVENTIST CHURCH
0.4%
0.4%
1.5%
1.6%
AMERICAN BAPTIST CHURCHES IN THE USA
0.3%
0.0%
0.1%
0.1%
MUSLIM ESTIMATE
0.3%
2.2%
0.6%
0.9%
Weather
Both Oklahoma City and Arlington experience a humid subtropical climate, characterized by hot, humid summers and mild to cool winters. However, Oklahoma City is situated in Tornado Alley and is susceptible to severe weather conditions, including hail storms and tornadoes.
Weather and climate
Type
Oklahoma City
Arlington
Temperature - Average
60.1°F
65°F
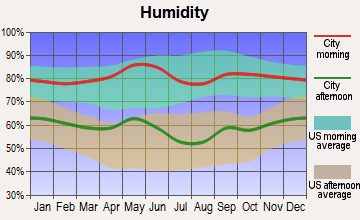
Humidity - Average morning or afternoon humidity
73.1%
71.4%
Humidity - Differences between morning and afternoon humidity
35%
34%
Humidity - Maximum monthly morning or afternoon humidity
85%
82%
Humidity - Minimum monthly morning or afternoon humidity
50%
48%
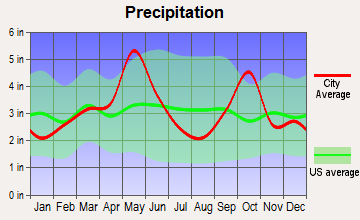
Precipitation - Yearly average
35.7 in
37.9 in
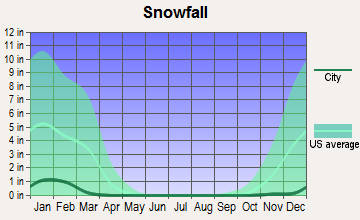
Snowfall - Yearly average
17.2 in
4.2 in
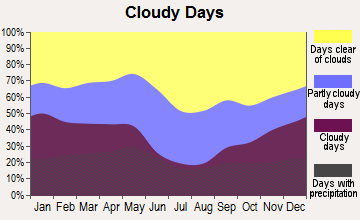
Clouds - Number of days clear of clouds
23.1%
22.7%
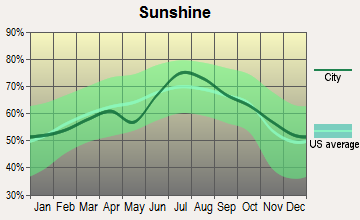
Sunshine amount - Average
72.1%
66.6%
Sunshine amount - Differences during a year
21%
20%
Sunshine amount - Maximum monthly
79%
74%
Sunshine amount - Minimum monthly
58%
54%
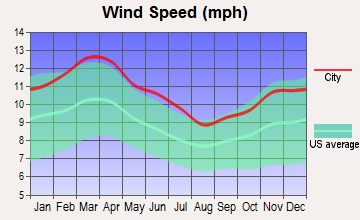
Wind speed - Average
12.3 mph
10.3 mph
Average climate in Oklahoma City, Oklahoma
Average climate in Arlington, Texas
Air pollution
Type
AQI
CO
NO2
OZONE
PB
PM10
PM25
SO2
Year
Oklahoma City
Arlington
Oklahoma City
Arlington
Oklahoma City
Arlington
Oklahoma City
Arlington
Oklahoma City
Oklahoma City
Oklahoma City
Arlington
Oklahoma City
Arlington
2018
85
86
0.29
N/A
6.6
5.8
31.9
27.1
0.002
N/A
21.3
N/A
9.6
9.4
0.0
0.4
2017
82
86
0.32
N/A
6.7
6.2
33.0
27.2
0.002
N/A
20.7
N/A
8.9
9.1
0.0
0.3
2016
72
76
0.29
N/A
6.6
6.3
31.9
25.5
0.002
N/A
19.4
N/A
8.5
8.2
0.2
0.2
2015
76
80
0.24
N/A
7.0
6.5
31.5
24.8
0.002
N/A
19.1
N/A
7.8
8.6
0.5
0.3
2014
84
78
0.15
0.22
7.1
6.8
32.4
26.6
0.002
N/A
N/A
N/A
8.7
9.3
0.1
0.3
2013
84
96
0.14
0.25
8.6
6.4
32.8
27.2
0.002
N/A
N/A
N/A
9.3
11.0
0.2
0.2
2012
97
108
0.13
0.26
9.4
7.8
34.0
30.3
0.007
N/A
N/A
N/A
7.9
10.5
0.3
0.3
2011
107
96
0.24
0.23
9.9
8.2
36.3
30.7
0.003
N/A
N/A
N/A
9.9
9.5
0.8
0.6
2010
81
76
0.30
0.23
8.8
8.9
31.7
27.7
0.002
N/A
N/A
N/A
9.8
8.4
0.7
0.7
2009
82
91
0.52
0.25
8.1
8.7
31.9
29.5
0.002
N/A
N/A
N/A
10.2
8.5
0.7
0.5
2008
78
92
0.51
0.25
9.8
9.6
31.0
25.8
N/A
N/A
N/A
N/A
N/A
10.7
1.4
0.5
2007
81
95
0.44
0.30
10.2
10.6
29.4
24.6
N/A
N/A
N/A
N/A
N/A
9.8
2.0
0.5
2006
95
102
0.43
0.34
10.1
10.4
33.7
29.7
N/A
N/A
N/A
N/A
N/A
9.9
1.2
0.8
2005
88
110
0.38
0.34
11.6
11.7
31.0
28.4
N/A
N/A
N/A
N/A
N/A
11.3
1.3
1.0
2004
75
90
0.46
0.39
10.5
10.8
28.6
25.4
N/A
N/A
N/A
N/A
N/A
N/A
0.6
0.9
2003
87
97
0.42
0.40
10.9
11.1
30.8
27.2
N/A
N/A
N/A
N/A
N/A
N/A
N/A
1.0
2002
91
97
0.35
0.37
14.3
11.8
29.0
25.8
N/A
N/A
N/A
N/A
N/A
N/A
2.0
0.6
2001
87
88
0.69
0.48
13.1
14.7
31.0
25.0
N/A
N/A
N/A
N/A
N/A
N/A
1.8
1.1
2000
89
104
0.66
0.55
13.4
14.5
29.5
26.2
N/A
N/A
N/A
N/A
N/A
N/A
3.0
1.3
Natural disasters
Type
Oklahoma City
Arlington
Tornado activity compared to U.S. average
353.4%
254.3%
Earthquake activity compared to U.S. average
938.9%
558.3%
Natural disasters compared to U.S. average
43%
23%
Transportation
While both cities are well-connected via interstate highways, there's a notable difference in public transportation. Oklahoma City offers more public transit options, including a bus service and a modern streetcar system. In contrast, Arlington is the largest U.S. city without a comprehensive public transit system.
Transport
Type
Oklahoma City
Arlington
Amtrak stations
1
0
Amtrak stations nearby
2
2
FAA registered aircraft
0
362
FAA registered aircraft manufacturers and dealers
0
5
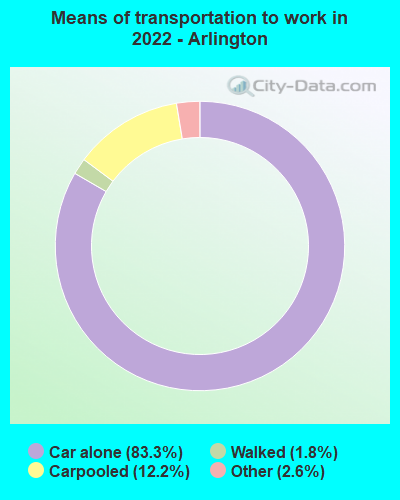
Means of transportation to work
Type
Oklahoma City
Arlington
Bicycle
0.2%
0.2%
Bus
0.3%
0%
Carpooled
8.6%
11.9%
Car alone
87.6%
85%
Motorcycle
0.1%
0.1%
Taxicab
0.2%
0%
Walked
1.4%
1.4%
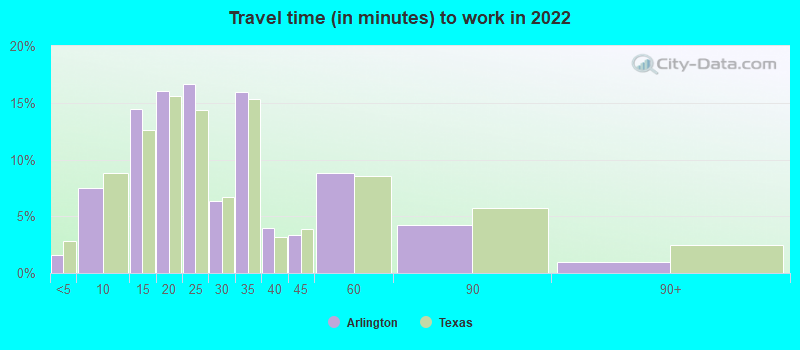
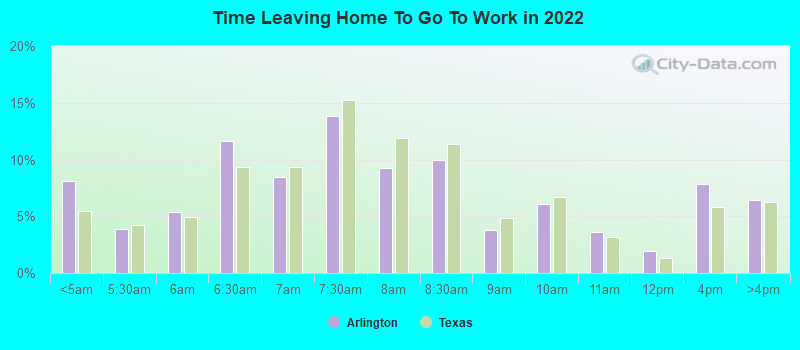
Average travel time to work
Type
Oklahoma City
Arlington
Average
25.6 min
26.1 min
Other means
21 min
27.6 min
Public transportation
33.1 min
45.1 min
Private vehicle occupancy
Type
Oklahoma City
Arlington
Average
1.2
1.2
Drove alone
89.5%
88.7%
In 2 person carpool
7.1%
7.8%
In 3 person carpool
1.9%
2.2%
In 4 person carpool
0.7%
0.8%
In 5-6 person carpool
0.5%
0.4%
In 7+ person carpool
0.2%
0.1%
How many people usually rode to work in the car, truck or van.
Real Estate
Real estate in Oklahoma City tends to be more affordable than in Arlington, reflecting the overall lower cost of living. Depending on specific neighborhoods, the type and size of the property, prices can vary.
Neighborhoods
Both cities offer a mix of urban and suburban neighborhoods, each with their distinctive characteristics. Neighborhoods in Oklahoma City like Mesta Park and Heritage Hills offer historic charm, while in Arlington, neighborhoods like Dalworthington Gardens and Pantego are known for their suburban feel and family-friendly environment.
Houses and residents
Type
Oklahoma City
Arlington
Houses
302,241
156,653
Average household size (people)
2.5
2.7
Median year apartment built
1978
1983
Median year house/condo built
1986
1984
Length of stay in the house since moving in
11.8 years
13 years
Houses occupied
275,285 (91.1%)
146,888 (93.8%)
Houses occupied by owners
164,470 (59.7%)
78,883 (53.7%)
Houses occupied by renters
110,815 (40.3%)
68,005 (46.3%)
Median rent asked for vacant for-rent units
$1,241
$1,609
Median monthly housing costs
$983
$1,220
Median price asked for vacant for-sale houses and condos
$278,299
$199,415
Estimated median house or condo value
$190,900
$254,700
Median numbers of rooms
5.5
5.4
Median number of rooms in apartments
4.3
4.1
Median number of rooms in houses and condos
6.2
6.5
Median house price - detached houses
$254,772
$265,594
Median house price - in 2-unit structures
$318,820
$415,006
Median house price - in 3-to-4-unit structures
$128,784
$224,044
Median house price - in 5 or more unit structures
$170,231
$131,545
Median house price - mobile homes
$112,256
$92,300
Median house price - occupied boats, rvs, vans etc.
$67,765
$23,762
Median house price - Townhouses or other attached units
$245,885
$171,140
Median house price - All housing units
$249,488
$259,527
Median house age
40
37
Renting percentage
40.3%
42.6%
Housing density (houses/condos per square mile)
497.9
1,634.9
House value disparities
34.7%
25%
Household income disparities
44.3%
43.9%
Median household income for houses/condes with a mortgage
$87,907
$97,883
Median household income for apartments without a mortgage
$61,761
$67,452
Housing units without a mortgage
1,238 (1.2%)
948 (2%)
Housing units with both a second mortgage and home equity loan
4,838 (4.7%)
1,684 (3.6%)
Housing units with a mortgage
100,798 (98.8%)
46,456 (98%)
Housing units with a home equity loan
123 (0.1%)
0 (0%)
Housing units with a second mortgage
5,921 (5.8%)
1,967 (4.1%)
House/condo owner moved in on average (years ago)
9
13
House/condo renter moved in on average (years ago)
1
1
Housing units lacking complete kitchen facilities
3.1%
1.7%
Housing units lacking complete plumbing facilities
1.9%
1%
Housing units in structures
Housing units in structures
Oklahoma City
Arlington
One, detached
67.8%
60.2%
One, attached
3.4%
10.8%
Two
2.0%
1.5%
3 or 4
5.1%
4.3%
5 to 9
6.0%
5.7%
10 to 19
5.6%
7.7%
20 to 49
2.4%
3.3%
50 or more
4.6%
5.2%
Mobile homes
3.1%
1.3%
Boats, RVs, vans, etc.
0.1%
0.1%
Median real estate property taxes paid for housing units
Self-employed workers in own not incorporated business
20,964
10,953
State government workers
17,132
6,771
Unpaid family workers
555
396
Industries and Occupations
In Oklahoma City, some of the largest industries include healthcare, public services, and energy. In contrast, the predominant industries in Arlington are education, healthcare, and entertainment.
Both cities have excellent healthcare systems with world-class medical centers and hospitals. Oklahoma City is home to the University of Oklahoma Health Sciences Center, while Arlington is serviced by the Texas Health Resources.
Health (county statistics)
Type
Oklahoma City
Arlington
General health status score of residents in this county from 1 (poor) to 5 (excellent)
Oklahoma City boasts an extensive highway system and a growing public transportation network, including bus and streetcar services. Arlington has a robust highway system but lacks in public transit options compared to other similar-sized cities.
Infrastructure
Type
Oklahoma City
Arlington
Hospitals
61
39
TV stations
20
25
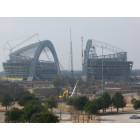
Arenas or stadiums
4
1
Bank branches located here
183
74
Bank institutions located here
44
23
Main business address for public companies
15
2
Drinking water stations with no reported violations in the past
4
0
Drinking water stations with reported violations in the past
HMDA - Conventional home purchase loans - Applications denied
Year
Oklahoma City
Arlington
1999
2,925
1,768
2000
2,396
1,198
2001
1,824
1,140
2002
1,507
847
2003
2,014
1,216
2004
2,323
1,504
2005
3,134
2,158
2006
3,132
2,107
2007
2,036
1,390
2008
1,143
558
2009
593
235
Culture and Food
Both cities have rich cultural scenes with numerous festivals, arts venues, and museums. Oklahoma City is known for its cowboy culture and hearty, meat-heavy cuisine. Arlington is known for its diverse food scene, with plenty of Tex-Mex, barbecue, and international cuisine options.
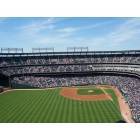
Sports Teams
Sports lovers will find plenty to cheer about in both cities. Oklahoma City is home to the NBA's Thunder, while Arlington boasts of the NFL's Cowboys and MLB's Rangers.


 Oklahoma City, OK
 Arlington, TX