Relocating or visiting a new city involves a comprehensive understanding of many factors, including crime and safety, weather, cost of living, etc. In this discussion, we will compare Oklahoma City, OK, and East Seattle, WA. Both cities have their unique features and aspects and comparing them will help address various aspects to fit different needs and preferences.
When it comes to crime and safety, both East Seattle and Oklahoma City have varied statistics. East Seattle has a higher crime rate compared to the national average, but it's mostly concentrated in specific neighborhoods. On the other hand, Oklahoma City, OK, registers a higher crime rate than East Seattle, especially in property crime. Therefore, safety usually necessitates caution in both cities. However, most residential areas are considered safe.
Cost of Living
The cost of living in East Seattle, WA, is considerably higher than in Oklahoma City, OK. Everything from housing to groceries tends to be pricier in Seattle. Oklahoma City is one of the most affordable major cities in the U.S., largely due to its relatively inexpensive housing.
Income Tax
Washington State, including East Seattle, does not impose a state income tax. Oklahoma, on the other hand, has a state income tax, with rates ranging from 0.5% to 5%.
Property Tax
Property taxes also vary. In Oklahoma City, the average property tax rate is around 0.89%. In contrast, East Seattle homeowners pay an average property tax rate of 0.92%.
Sales Tax
The sales tax differs significantly. The combined state and local sales tax in Oklahoma City is around 8.63%. In contrast, East Seattle has a sales tax rate of approximately 10.1%, one of the highest in the country.
Income
Type
Oklahoma City
East Seattle
Estimated median household income
$59,214
$135,835
Estimated per capita income
$31,630
$77,151
Cost of living index (U.S. average is 100)
85.4
128.6
If you make $50,000 in Oklahoma City, you will have to make $75,293 in East Seattle to maintain the same standard of living.
Geographical Conditions
Geographically, East Seattle offers incredible natural beauty with stunning views of mountains and water bodies. Oklahoma City, in contrast, is located in the Great Plains region and offers vast flatlands and a few small mountain ranges.
Geographical information
Type
Oklahoma City
East Seattle
Land area
607 sq. miles
217.1 sq. miles
Population density
1,133 people per sq. mile
2,361.6 people per sq. mile
Relative area comparison
Oklahoma City, OK East Seattle, WA
Education
When it comes to education, both cities have prominent educational institutions. East Seattle hosts reputed institutions like the University of Washington. In contrast, Oklahoma City is home to the University of Oklahoma, which is recognized for its excellent research programs. Both cities offer good educational opportunities, making them attractive for families with school-going children.
East Seattle boasts a robust economy with growth in sectors such as tech, biotech, healthcare, and manufacturing. Oklahoma City's economy is more diversified, with significant contributions from sectors like government, natural gas, and oil. Both cities offer good job opportunities, although the types of jobs available may differ in each city.
Biggest Employers
In East Seattle, some of the biggest employers are Microsoft, Amazon, and the University of Washington. In Oklahoma City, major employers include the state of Oklahoma, Integris Health, and the University of Oklahoma.
In Oklahoma City (Oklahoma County), 41.7% voted for Democrats and 58.3% for Republicans in 2012 Presidential Election. In East Seattle (King County), 69.0% voted for Democrats and 28.5% for Republicans.
Elections
Type
Democrats
Republicans
Other
Year
Oklahoma City
East Seattle
Oklahoma City
East Seattle
Oklahoma City
East Seattle
2020
48.1%
75.1%
49.2%
22.3%
2.7%
2.6%
2016
41.2%
70.0%
51.7%
21.1%
7.1%
8.9%
2012
41.7%
69.0%
58.3%
28.5%
0.0%
2.5%
2008
41.6%
70.2%
58.4%
28.1%
0.0%
1.7%
2004
35.8%
65.1%
64.2%
33.8%
0.0%
1.1%
2000
36.6%
60.3%
62.3%
34.5%
1.1%
5.2%
1996
36.5%
56.4%
54.7%
31.4%
8.8%
12.2%
Breakdown of population affiliated with a religious congregation
Type
Adherents
Congregations
Religion
Oklahoma City
East Seattle
Oklahoma City
East Seattle
SOUTHERN BAPTIST CONVENTION
20.7%
0.3%
20.0%
3.8%
CATHOLIC CHURCH
8.5%
14.4%
3.0%
4.9%
EPISCOPAL CHURCH
0.7%
0.8%
1.3%
2.4%
INTERNA PENTECO HOLINESS CHURCH
0.7%
0.0%
2.9%
0.0%
LUTHERAN CHURCH
0.5%
0.5%
1.0%
2.0%
SEVENTH DAY ADVENTIST CHURCH
0.4%
0.6%
1.5%
2.3%
AMERICAN BAPTIST CHURCHES IN THE USA
0.3%
0.6%
0.1%
2.9%
MUSLIM ESTIMATE
0.3%
0.6%
0.6%
1.4%
EVANGELICAL LUTHERAN CHURCH IN AMERICA
0.2%
1.3%
0.9%
4.7%
Weather
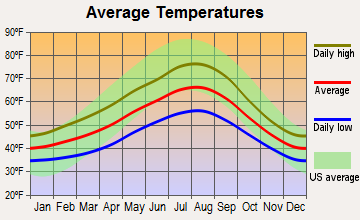
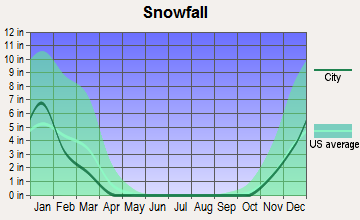
Comparatively, East Seattle, WA, experiences a temperate marine climate, with damp, mild winters and warm, dry summers. Oklahoma City, OK, in contrast, features a humid subtropical climate. This means hot, humid summers and cold, dry winters, with the possibility of extreme weather such as tornadoes. These weather conditions might significantly impact a visitor's or resident's daily activities.
Weather and climate
Type
Oklahoma City
East Seattle
Temperature - Average
60.1°F
52.5°F
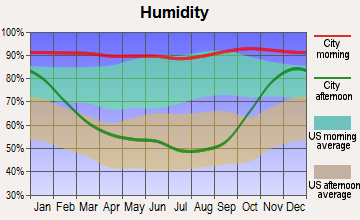
Humidity - Average morning or afternoon humidity
73.1%
78.5%
Humidity - Differences between morning and afternoon humidity
35%
38%
Humidity - Maximum monthly morning or afternoon humidity
85%
86%
Humidity - Minimum monthly morning or afternoon humidity
50%
48%
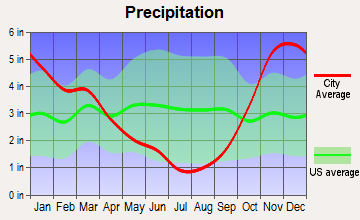
Precipitation - Yearly average
35.7 in
36.8 in
Snowfall - Yearly average
17.2 in
21.4 in
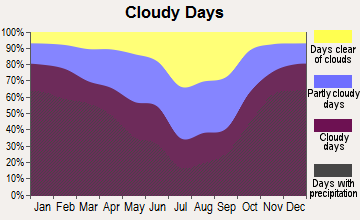
Clouds - Number of days clear of clouds
23.1%
11.7%
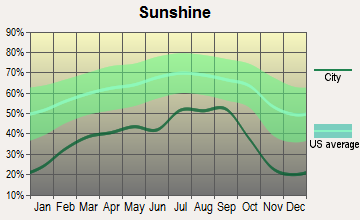
Sunshine amount - Average
72.1%
49.4%
Sunshine amount - Differences during a year
21%
44%
Sunshine amount - Maximum monthly
79%
64%
Sunshine amount - Minimum monthly
58%
20%
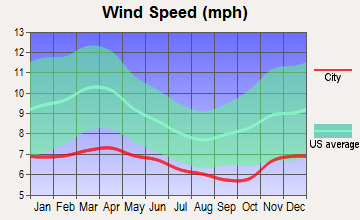
Wind speed - Average
12.3 mph
8.6 mph
Average climate in Oklahoma City, Oklahoma
Average climate in East Seattle, Washington
Air pollution
Type
AQI
CO
NO2
OZONE
PB
PM10
PM25
SO2
Year
Oklahoma City
East Seattle
Oklahoma City
East Seattle
Oklahoma City
East Seattle
Oklahoma City
East Seattle
Oklahoma City
East Seattle
Oklahoma City
East Seattle
Oklahoma City
East Seattle
Oklahoma City
East Seattle
2018
85
85
0.29
0.21
6.6
10.6
31.9
21.0
0.002
N/A
21.3
N/A
9.6
5.1
0.0
0.7
2017
82
100
0.32
0.23
6.7
11.1
33.0
21.2
0.002
N/A
20.7
N/A
8.9
4.6
0.0
0.3
2016
72
67
0.29
0.22
6.6
11.9
31.9
20.2
0.002
N/A
19.4
N/A
8.5
3.8
0.2
0.6
2015
76
88
0.24
0.23
7.0
10.8
31.5
19.4
0.002
N/A
19.1
N/A
7.8
5.6
0.5
0.8
2014
84
75
0.15
0.24
7.1
11.5
32.4
19.5
0.002
N/A
N/A
N/A
8.7
5.7
0.1
N/A
2013
84
81
0.14
0.24
8.6
N/A
32.8
17.2
0.002
N/A
N/A
N/A
9.3
5.9
0.2
0.8
2012
97
83
0.13
0.23
9.4
N/A
34.0
19.3
0.007
N/A
N/A
N/A
7.9
5.2
0.3
1.0
2011
107
73
0.24
0.24
9.9
N/A
36.3
18.6
0.003
N/A
N/A
N/A
9.9
5.2
0.8
1.1
2010
81
73
0.30
0.24
8.8
N/A
31.7
18.0
0.002
N/A
N/A
N/A
9.8
4.4
0.7
1.1
2009
82
94
0.52
0.27
8.1
N/A
31.9
18.3
0.002
N/A
N/A
N/A
10.2
6.0
0.7
1.4
2008
78
80
0.51
0.30
9.8
N/A
31.0
17.8
N/A
N/A
N/A
N/A
N/A
5.4
1.4
1.3
2007
81
85
0.44
0.30
10.2
N/A
29.4
17.7
N/A
N/A
N/A
19.0
N/A
6.4
2.0
1.5
2006
95
102
0.43
N/A
10.1
N/A
33.7
18.4
N/A
N/A
N/A
21.1
N/A
7.2
1.2
N/A
2005
88
104
0.38
0.80
11.6
18.3
31.0
N/A
N/A
N/A
N/A
22.9
N/A
7.6
1.3
3.5
2004
75
110
0.46
0.81
10.5
17.9
28.6
N/A
N/A
N/A
N/A
N/A
N/A
8.3
0.6
3.0
2003
87
100
0.42
0.85
10.9
18.5
30.8
N/A
N/A
N/A
N/A
N/A
N/A
8.3
N/A
2.4
2002
91
90
0.35
1.07
14.3
19.3
29.0
N/A
N/A
N/A
N/A
N/A
N/A
10.7
2.0
2.7
2001
87
91
0.69
1.08
13.1
20.5
31.0
N/A
N/A
0.004
N/A
N/A
N/A
11.1
1.8
3.7
2000
89
99
0.66
1.21
13.4
20.9
29.5
N/A
N/A
N/A
N/A
N/A
N/A
12.1
3.0
3.2
Natural disasters
Type
Oklahoma City
East Seattle
Tornado activity compared to U.S. average
353.4%
5.5%
Earthquake activity compared to U.S. average
938.9%
1,403%
Natural disasters compared to U.S. average
43%
30%
Transportation
Both cities have efficient public transportation systems. East Seattle is known for its extensive network of buses, light rail, and ferries. Oklahoma City, on the other hand, has a well-functioning bus system, and recently added a modern streetcar line serving downtown.
Transport
Type
Oklahoma City
East Seattle
Amtrak stations
1
0
Amtrak stations nearby
2
3
Means of transportation to work
Type
Oklahoma City
East Seattle
Bicycle
0.2%
0.3%
Bus
0.3%
5%
Carpooled
8.6%
11%
Car alone
87.6%
76.3%
Motorcycle
0.1%
0.1%
Taxicab
0.2%
0%
Walked
1.4%
1.7%
Average travel time to work
Type
Oklahoma City
East Seattle
Average
25.6 min
25 min
Real Estate
The real estate market is pricier in East Seattle with a median home cost around $690,000. In contrast, Oklahoma City's housing market is very affordable, with a median home cost of around $140,000. This significant price difference can factor into a relocation decision.
Neighborhoods
Both cities have unique neighborhoods. East Seattle is known for its urban, vibrant neighborhoods like Capitol Hill and Madison Valley. Oklahoma City offers a variety of neighborhood options, from the historic charm of the Heritage Hills to the urban atmosphere of the Bricktown district.
Houses and residents
Type
Oklahoma City
East Seattle
Houses
302,241
199,933
Average household size (people)
2.5
2.5
Houses occupied
275,285 (91.1%)
191,630 (95.8%)
Houses occupied by owners
164,470 (59.7%)
128,209 (66.9%)
Houses occupied by renters
110,815 (40.3%)
63,421 (33.1%)
Median rent asked for vacant for-rent units
$1,241
$2,281
Median price asked for vacant for-sale houses and condos
$278,299
$820,468
Estimated median house or condo value
$190,900
$877,325
Median number of rooms in apartments
4.3
3.5
Median number of rooms in houses and condos
6.2
7.8
Housing density (houses/condos per square mile)
497.9
920.9
Household income disparities
44.3%
34.9%
Housing units without a mortgage
1,238 (1.2%)
22,582 (20.8%)
Housing units with both a second mortgage and home equity loan
4,838 (4.7%)
352 (0.3%)
Housing units with a mortgage
100,798 (98.8%)
85,751 (79.2%)
Housing units with a home equity loan
123 (0.1%)
11,674 (10.8%)
Housing units with a second mortgage
5,921 (5.8%)
9,796 (9%)
Housing units lacking complete kitchen facilities
3.1%
0.8%
Housing units lacking complete plumbing facilities
Self-employed workers in own not incorporated business
20,964
16,907
State government workers
17,132
10,270
Unpaid family workers
555
584
Industries and Occupations
In East Seattle, the dominant industries include technology, healthcare, and professional services. In Oklahoma City, the largest sectors are government, oil, natural gas, and diversified health services. This difference in key industries shapes the occupational landscape of each city.
Both cities have excellent healthcare systems. East Seattle is home to the highly renowned University of Washington Medical Center. Oklahoma City is served by several healthcare facilities such as the OU Medical Center and the Integris Health system.
Health (county statistics)
Type
Oklahoma City
East Seattle
General health status score of residents in this county from 1 (poor) to 5 (excellent)
Infrastructure in both cities is well developed, with good transportation systems, healthcare facilities, and public amenities. The wide-range of infrastructure in East Seattle tends to cater to its varied demographics, whereas Oklahoma City infrastructure has a more conservative look and feel, attributed to its historical background.
Infrastructure
Type
Oklahoma City
East Seattle
TV stations
20
16
Schools
School facilities
Type
Oklahoma City
East Seattle
Private elementary/middle schools
19
1
Private high schools
10
1
Public elementary/middle schools
126
2
Public high schools
25
2
Colleges/Universities
22
0
Culture and Food
Culturally, both cities are diverse with unique food scenes. East Seattle is known for its vibrant seafood, craft beer, and coffee culture, while Oklahoma City offers a diverse food scene with strong influences from BBQ and southern cuisine.
Sports Teams
Sports enthusiasm is high in both cities. East Seattle is home to the Seattle Seahawks (NFL) and Seattle Mariners (MLB). Oklahoma City boasts the Oklahoma City Thunder (NBA).
 Oklahoma City, OK
 East Seattle, WA