Oklahoma City, OK and Mesa, AZ are two unique cities offering distinctive experiences in terms of quality of life, cost of living, and opportunities. Oklahoma City, known as the state's bustling capital, is known for its cowboy culture, whereas Mesa, part of the Greater Phoenix area, highlights the wonders of desert living. This comparison provides insights into various aspects of these cities, enabling individuals to make informed decisions about relocation or simply visiting.
Distance between
Oklahoma City, OK and
Mesa, AZ : 821.5 miles
Oklahoma City's population is larger by 35%. Its population has grown by 181,593 people (35.9%) since 2000. The population of Mesa has grown by 113,100 people (28.5%) during that time.
Regarding crime and safety, both Oklahoma City and Mesa have areas where caution is advisable. Oklahoma City's crime rate is notably higher than the national average, with property crime being more prevalent. Mesa, on the other hand, records a lower crime rate than Oklahoma City but slightly higher than the national average. Both cities have initiated community policing efforts and crime reduction strategies to improve safety.
City-data.com crime index counts serious crimes and violent crime more heavily. It adjusts for the number of visitors and daily workers commuting into cities. (higher means more crime, U.S. average = 301.1)
City-data.com crime index counts serious crimes and violent crime more heavily. It adjusts for the number of visitors and daily workers commuting into cities. (higher means more crime, U.S. average = 301.1)
Sex Offenders
According to our data, there are 1,386 registered sex offenders living in Oklahoma City and 635 registered sex offenders living in . The ratio of residents to sex offenders in Oklahoma City is 461 to 1; the ratio in Mesa is 763 to 1. The number of registered sex offenders compared to the number of residents is larger in Oklahoma City than in Mesa.
Cost of Living
The cost of living in Oklahoma City is generally lower than the national average, making it an affordable place to live. Housing, utilities, and groceries tend to be cheaper. Mesa, being part of the Greater Phoenix area, is slightly more expensive with higher housing costs, though still relatively affordable compared to other large cities in the US.
Income Tax
Oklahoma imposes a state income tax, while Arizona also has a state income tax, with rates that vary based on income level. However, keep in mind that neither city levies a city income tax.
Property Tax
Oklahoma City's property tax rates are comparatively lower than the national average. Mesa, on the other hand, has slightly higher rates, but still relatively affordable compared to many other cities in Arizona.
Sales Tax
Oklahoma City has a combined city and state sales tax rate of around 8.375%, marginally higher than Mesa's total rate of approximately 8.020%.
Income
Type
Oklahoma City
Mesa
Estimated median household income
$59,214
$69,266
Estimated per capita income
$31,630
$35,439
Cost of living index (U.S. average is 100)
85.4
101
If you make $50,000 in Oklahoma City, you will have to make $59,133 in Mesa to maintain the same standard of living.
Geographical Conditions
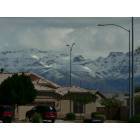
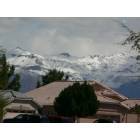
Oklahoma City is in the Great Plains region, offering a mix of urban and rural landscapes. Mesa is in the Sonoran Desert and close to the Superstition Mountains, providing ample opportunities for outdoor exploration.
Both cities have commendable education systems. Oklahoma City is home to several primary, secondary and charter schools, plus institutions for higher education like the University of Oklahoma. Mesa is served by numerous public school districts and is near Arizona State University, one of the largest public universities in the U.S.
Oklahoma City's economy is diverse, with sectors like oil, natural gas, petroleum products and related industries playing significant roles. Conversely, Mesa's economy is supported by healthcare, education, and tourism. Both cities enjoy lower-than-average unemployment rates, signaling positive job growth.
Biggest Employers
Significant employers in Oklahoma City are the State of Oklahoma, Integris Health, and the University of Oklahoma. Mesa's largest employers are Banner Health System, Mesa Public Schools, and the City of Mesa, offering a range of opportunities for professionals in various fields.
There were 4,127 building permits issued in Oklahoma City in 2012 (2834 more than in 2011) compared to 2,046 building permits issued in Mesa in 2012 (1543 more than in 2011).
In Oklahoma City (Oklahoma County), 41.7% voted for Democrats and 58.3% for Republicans in 2012 Presidential Election. In Mesa (Maricopa County), 43.6% voted for Democrats and 54.3% for Republicans.
Elections
Type
Democrats
Republicans
Other
Year
Oklahoma City
Mesa
Oklahoma City
Mesa
Oklahoma City
Mesa
2020
48.1%
50.2%
49.2%
48.0%
2.7%
1.8%
2016
41.2%
44.9%
51.7%
47.7%
7.1%
7.5%
2012
41.7%
43.6%
58.3%
54.3%
0.0%
2.1%
2008
41.6%
44.0%
58.4%
54.5%
0.0%
1.5%
2004
35.8%
42.4%
64.2%
57.0%
0.0%
0.6%
2000
36.6%
43.0%
62.3%
53.4%
1.1%
3.6%
1996
36.5%
44.5%
54.7%
47.2%
8.8%
8.2%
Breakdown of population affiliated with a religious congregation
Type
Adherents
Congregations
Religion
Oklahoma City
Mesa
Oklahoma City
Mesa
SOUTHERN BAPTIST CONVENTION
20.7%
1.9%
20.0%
6.5%
CATHOLIC CHURCH
8.5%
13.6%
3.0%
4.3%
EPISCOPAL CHURCH
0.7%
0.3%
1.3%
1.3%
INTERNA PENTECO HOLINESS CHURCH
0.7%
0.0%
2.9%
0.6%
LUTHERAN CHURCH
0.5%
0.5%
1.0%
1.5%
SEVENTH DAY ADVENTIST CHURCH
0.4%
0.4%
1.5%
2.0%
AMERICAN BAPTIST CHURCHES IN THE USA
0.3%
0.2%
0.1%
0.6%
MUSLIM ESTIMATE
0.3%
0.2%
0.6%
1.0%
EVANGELICAL LUTHERAN CHURCH IN AMERICA
0.2%
0.8%
0.9%
2.0%
VINEYARD USA
0.0%
0.3%
0.1%
0.6%
Weather
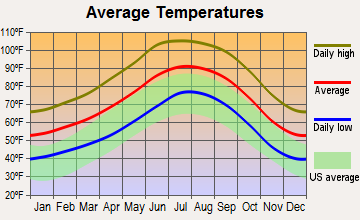
Weather is a major point of divergence between these two cities. Oklahoma City has a humid subtropical climate, which means hot, humid summers and mild to cool winters, with occasional bouts of severe weather, including tornadoes. Conversely, Mesa enjoys a hot desert climate, with blazing, dry summers and mild, relatively short winters. This difference may appeal to different individuals depending on their weather preferences.
Weather and climate
Type
Oklahoma City
Mesa
Temperature - Average
60.1°F
71.7°F
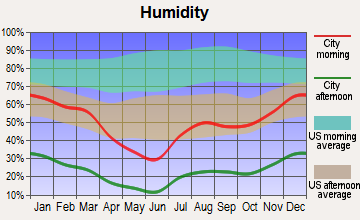
Humidity - Average morning or afternoon humidity
73.1%
37.5%
Humidity - Differences between morning and afternoon humidity
35%
48%
Humidity - Maximum monthly morning or afternoon humidity
85%
60%
Humidity - Minimum monthly morning or afternoon humidity
50%
12%
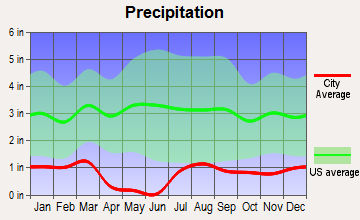
Precipitation - Yearly average
35.7 in
9.5 in
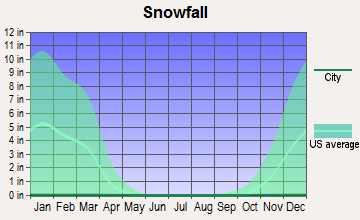
Snowfall - Yearly average
17.2 in
0 in
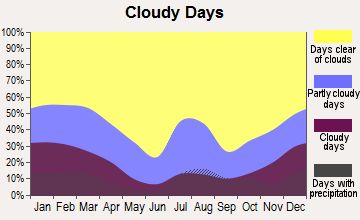
Clouds - Number of days clear of clouds
23.1%
35.2%
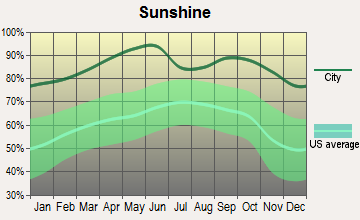
Sunshine amount - Average
72.1%
92.8%
Sunshine amount - Differences during a year
21%
16%
Sunshine amount - Maximum monthly
79%
95%
Sunshine amount - Minimum monthly
58%
79%
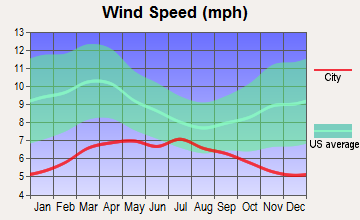
Wind speed - Average
12.3 mph
6.6 mph
Average climate in Oklahoma City, Oklahoma
Average climate in Mesa, Arizona
Air pollution
Type
AQI
CO
NO2
OZONE
PB
PM10
PM25
SO2
Year
Oklahoma City
Mesa
Oklahoma City
Mesa
Oklahoma City
Mesa
Oklahoma City
Mesa
Oklahoma City
Oklahoma City
Mesa
Oklahoma City
Mesa
Oklahoma City
Mesa
2018
85
200
0.29
0.28
6.6
15.1
31.9
34.8
0.002
N/A
21.3
28.1
9.6
7.5
0.0
0.6
2017
82
128
0.32
0.28
6.7
15.8
33.0
35.1
0.002
N/A
20.7
24.5
8.9
8.2
0.0
1.4
2016
72
121
0.29
0.31
6.6
15.7
31.9
34.6
0.002
N/A
19.4
21.5
8.5
6.8
0.2
0.4
2015
76
104
0.24
0.34
7.0
17.6
31.5
33.4
0.002
N/A
19.1
17.7
7.8
6.8
0.5
0.9
2014
84
135
0.15
0.33
7.1
19.6
32.4
34.0
0.002
N/A
N/A
30.8
8.7
8.4
0.1
1.1
2013
84
141
0.14
0.31
8.6
19.9
32.8
34.8
0.002
N/A
N/A
29.3
9.3
5.8
0.2
0.9
2012
97
159
0.13
0.38
9.4
21.2
34.0
33.7
0.007
N/A
N/A
37.9
7.9
8.1
0.3
1.3
2011
107
205
0.24
0.31
9.9
18.5
36.3
34.1
0.003
N/A
N/A
40.4
9.9
9.5
0.8
0.9
2010
81
100
0.30
0.31
8.8
16.4
31.7
32.9
0.002
N/A
N/A
29.5
9.8
8.3
0.7
1.2
2009
82
109
0.52
0.33
8.1
16.6
31.9
32.3
0.002
N/A
N/A
37.8
10.2
N/A
0.7
1.0
2008
78
106
0.51
0.29
9.8
17.5
31.0
34.2
N/A
N/A
N/A
39.9
N/A
N/A
1.4
1.1
2007
81
134
0.44
0.43
10.2
19.3
29.4
31.0
N/A
N/A
N/A
50.6
N/A
N/A
2.0
1.9
2006
95
138
0.43
0.44
10.1
22.1
33.7
30.9
N/A
N/A
N/A
57.5
N/A
N/A
1.2
1.8
2005
88
109
0.38
0.49
11.6
22.6
31.0
30.0
N/A
N/A
N/A
49.1
N/A
N/A
1.3
1.7
2004
75
97
0.46
0.51
10.5
22.4
28.6
30.4
N/A
N/A
N/A
33.4
N/A
N/A
0.6
1.4
2003
87
99
0.42
0.56
10.9
24.0
30.8
31.7
N/A
N/A
N/A
42.6
N/A
N/A
N/A
1.4
2002
91
110
0.35
0.69
14.3
24.9
29.0
28.0
N/A
N/A
N/A
41.8
N/A
N/A
2.0
1.6
2001
87
105
0.69
0.65
13.1
23.8
31.0
27.2
N/A
N/A
N/A
37.8
N/A
N/A
1.8
1.5
2000
89
117
0.66
0.76
13.4
29.8
29.5
27.1
N/A
N/A
N/A
45.6
N/A
N/A
3.0
1.7
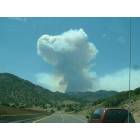
Natural disasters
Type
Oklahoma City
Mesa
Tornado activity compared to U.S. average
353.4%
18.1%
Earthquake activity compared to U.S. average
938.9%
2,348.6%
Natural disasters compared to U.S. average
43%
16%
Transportation
Oklahoma City is car-dependent with a growing focus on public transit including buses and streetcars. Mesa offers excellent public transportation, including light rail, buses, and a robust network of highways.
Transport
Type
Oklahoma City
Mesa
Amtrak stations
1
0
Amtrak stations nearby
2
2
FAA registered aircraft
0
828
FAA registered aircraft manufacturers and dealers
0
20
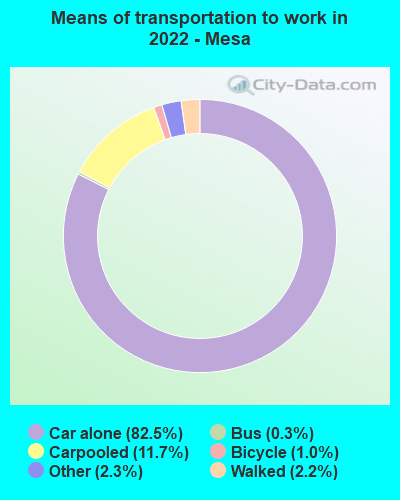
Means of transportation to work
Type
Oklahoma City
Mesa
Bicycle
0.2%
0.6%
Bus
0.3%
0.3%
Carpooled
8.6%
14.4%
Car alone
87.6%
79.9%
Motorcycle
0.1%
0.5%
Taxicab
0.2%
0.1%
Walked
1.4%
2.5%
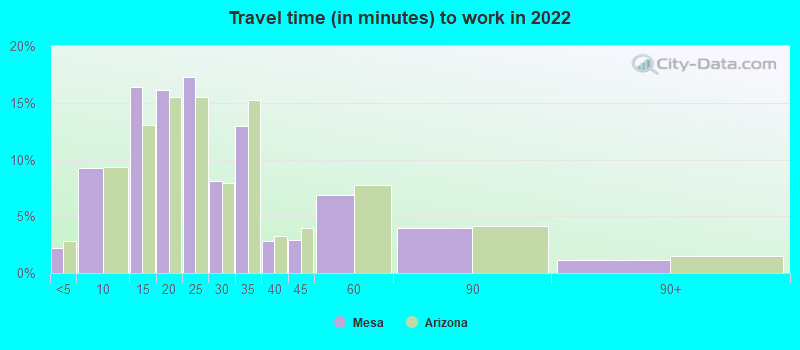
Average travel time to work
Type
Oklahoma City
Mesa
Average
25.6 min
25 min
Other means
21 min
26.9 min
Public transportation
33.1 min
45.9 min
Private vehicle occupancy
Type
Oklahoma City
Mesa
Average
1.2
1.2
Drove alone
89.5%
85.8%
In 2 person carpool
7.1%
11.1%
In 3 person carpool
1.9%
2.1%
In 4 person carpool
0.7%
0.5%
In 5-6 person carpool
0.5%
0.5%
In 7+ person carpool
0.2%
0.1%
How many people usually rode to work in the car, truck or van.
Real Estate
Real estate in Oklahoma City is generally more affordable than in Mesa, with median home prices well below the national average. Mesa's housing market is more expensive but still affordable compared to other Arizona cities. Both cities offer an array of options from downtown apartments to suburban houses.
Neighborhoods
Oklahoma City’s neighborhoods are diverse, with the historic Heritage Hills or bustling Midtown catering to different lifestyles. Similarly, Mesa offers choices from the vibrant Downtown area to tranquil suburban neighborhoods like Dobson Ranch.
Houses and residents
Type
Oklahoma City
Mesa
Houses
302,241
221,995
Average household size (people)
2.5
2.6
Median year apartment built
1978
1987
Median year house/condo built
1986
1989
Length of stay in the house since moving in
11.8 years
11.2 years
Houses occupied
275,285 (91.1%)
199,112 (89.7%)
Houses occupied by owners
164,470 (59.7%)
126,146 (63.4%)
Houses occupied by renters
110,815 (40.3%)
72,966 (36.6%)
Median rent asked for vacant for-rent units
$1,241
$1,890
Median monthly housing costs
$983
$1,220
Median price asked for vacant for-sale houses and condos
$278,299
$262,297
Estimated median house or condo value
$190,900
$350,100
Median numbers of rooms
5.5
5.2
Median number of rooms in apartments
4.3
4
Median number of rooms in houses and condos
6.2
5.9
Median house price - detached houses
$254,772
$421,563
Median house price - in 2-unit structures
$318,820
$124,748
Median house price - in 3-to-4-unit structures
$128,784
$226,327
Median house price - in 5 or more unit structures
$170,231
$250,077
Median house price - mobile homes
$112,256
$70,636
Median house price - occupied boats, rvs, vans etc.
$67,765
$94,693
Median house price - Townhouses or other attached units
$245,885
$256,984
Median house price - All housing units
$249,488
$364,728
Median house age
40
33
Renting percentage
40.3%
36.8%
Housing density (houses/condos per square mile)
497.9
1,776.1
House value disparities
34.7%
31.1%
Household income disparities
44.3%
42.1%
Median household income for houses/condes with a mortgage
$87,907
$97,987
Median household income for apartments without a mortgage
$61,761
$63,218
Housing units without a mortgage
1,238 (1.2%)
1,338 (1.6%)
Housing units with both a second mortgage and home equity loan
4,838 (4.7%)
5,628 (6.9%)
Housing units with a mortgage
100,798 (98.8%)
80,572 (98.4%)
Housing units with a home equity loan
123 (0.1%)
48 (0.1%)
Housing units with a second mortgage
5,921 (5.8%)
7,236 (8.8%)
House/condo owner moved in on average (years ago)
9
8
House/condo renter moved in on average (years ago)
1
1
Housing units lacking complete kitchen facilities
3.1%
0.9%
Housing units lacking complete plumbing facilities
1.9%
0.4%
Housing units in structures
Housing units in structures
Oklahoma City
Mesa
One, detached
67.8%
55.9%
One, attached
3.4%
6.6%
Two
2.0%
1.0%
3 or 4
5.1%
5.1%
5 to 9
6.0%
6.0%
10 to 19
5.6%
5.0%
20 to 49
2.4%
2.8%
50 or more
4.6%
5.3%
Mobile homes
3.1%
11.8%
Boats, RVs, vans, etc.
0.1%
0.6%
Median real estate property taxes paid for housing units
Self-employed workers in own not incorporated business
20,964
10,562
State government workers
17,132
6,039
Unpaid family workers
555
830
Industries and Occupations
Key industries in Oklahoma City include energy, aviation, healthcare, and manufacturing, whereas in Mesa, healthcare, aerospace, education, and tourism are prominent. Opportunities abound in these sectors, with diverse occupations attracting professionals from different fields.
Both cities boast strong healthcare systems. Oklahoma City is home to the Oklahoma University Medical Center, while Banner Health System, one of the largest employers in Mesa, operates several hospitals and clinics across the city.
Health (county statistics)
Type
Oklahoma City
Mesa
General health status score of residents in this county from 1 (poor) to 5 (excellent)
Oklahoma City boasts a developed infrastructure with the recent implementation of MAPS, a public project enhancing parks, transportation, and more. Mesa, a suburban city, is also well-developed, with excellent road networks, public parks, and walking trails. Both cities are investing in infrastructure improvements for future growth.
Infrastructure
Type
Oklahoma City
Mesa
Hospitals
61
13
TV stations
20
18
Bank branches located here
183
97
Bank institutions located here
44
22
Main business address for public companies
15
2
Drinking water stations with no reported violations in the past
4
1
Drinking water stations with reported violations in the past
HMDA - Conventional home purchase loans - Applications denied
Year
Oklahoma City
Mesa
1999
2,925
2,532
2000
2,396
2,428
2001
1,824
1,854
2002
1,507
1,520
2003
2,014
1,991
2004
2,323
2,897
2005
3,134
3,857
2006
3,132
3,727
2007
2,036
1,896
2008
1,143
765
2009
593
440
Culture and Food
Oklahoma City offers a unique mix of cowboy culture, with festivals, rodeos, and renowned BBQ joints. In contrast, Mesa reflects Arizona's Southwestern culture, with an emphasis on outdoor activities, Native American art, and Mexican food.
Sports Teams
Oklahoma City hosts the NBA's Oklahoma City Thunder, while Mesa doesn't have its own major league teams but is a short drive from the sports action in Phoenix, which includes NFL, NBA, and MLB teams.


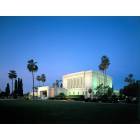
 Oklahoma City, OK
 Mesa, AZ