Oklahoma City, the capital of Oklahoma, and St. Louis, the Gateway City of Missouri, both offer distinct lifestyles for both residents and visitors. By comparing important categories such as cost of living, crime and safety, weather, education, work and economy, and others, we can gain insights on the differences and similarities between these two cities. We'll dive into various sections to understand how these cities can cater to differing lifestyles and preferences. Whether you're considering relocation or just a visitor, this comparison aims to provide a comprehensive overview of living in these cities.
Distance between
Oklahoma City, OK and
St. Louis, MO : 456.8 miles
Oklahoma City's population is larger by 135%. Its population has grown by 181,593 people (35.9%) since 2000. The population of St. Louis has decreased by 54,879 people (15.8%) during that time.
St. Louis has a higher crime rate compared to Oklahoma City. However, these rates are highly concentrated in certain areas and vary widely across neighborhoods. Both cities are putting efforts into improving safety and crime prevention measures. It's advisable to research the specific neighborhoods you're interested in for the most accurate information.
City-data.com crime index counts serious crimes and violent crime more heavily. It adjusts for the number of visitors and daily workers commuting into cities. (higher means more crime, U.S. average = 301.1)
City-data.com crime index counts serious crimes and violent crime more heavily. It adjusts for the number of visitors and daily workers commuting into cities. (higher means more crime, U.S. average = 301.1)
Sex Offenders
According to our data, there are 1,388 registered sex offenders living in Oklahoma City and 2,529 registered sex offenders living in . The ratio of residents to sex offenders in Oklahoma City is 460 to 1; the ratio in St. Louis is 123 to 1. The number of registered sex offenders compared to the number of residents is a lot smaller in Oklahoma City than in St. Louis.
Cost of Living
Oklahoma City has a lower cost of living compared to St. Louis. Housing is particularly more affordable in Oklahoma City. However, individual expenses will of course vary depending on lifestyle and personal circumstances.
Income Tax
Missouri has a progressive income tax, while Oklahoma has a flat rate. Thus, your income tax in St. Louis would increase as your income increases, whereas in Oklahoma City it would stay the same.
Property Tax
Property taxes tend to be lower in Oklahoma than in Missouri, so homeowners in Oklahoma City generally pay less property tax than those in St. Louis.
Sales Tax
Oklahoma has a higher state sales tax rate than Missouri. However, local sales tax varies by city, so the actual sales tax rate will depend on the specific area.
Income
Type
Oklahoma City
St. Louis
Estimated median household income
$59,214
$49,965
Estimated per capita income
$31,630
$33,810
Cost of living index (U.S. average is 100)
85.4
96.5
If you make $50,000 in Oklahoma City, you will have to make $56,499 in St. Louis to maintain the same standard of living.
Geographical Conditions
Oklahoma City is located in the Great Plains region, and is known for its prairies and severe weather conditions including tornadoes. St. Louis is situated by the Mississippi River, and features diverse natural beauty, such as Forest Park.
Both cities offer a variety of educational opportunities. St. Louis is known for its university scene, with renowned institutions like Washington University. Oklahoma City, meanwhile, is home to the University of Oklahoma, which is one of the top public universities in the country.
St. Louis has a more diversified economy, with industries ranging from healthcare to manufacturing, finance, and trade. Oklahoma City's economy largely revolves around oil, gas, and other energy sectors, although it is diversifying into sectors such as aviation, healthcare, and technology.
Biggest Employers
Some of the largest employers in Oklahoma City include the State of Oklahoma, the University of Oklahoma, and Hobby Lobby Stores. In St. Louis, top employers include BJC HealthCare, Wal-Mart Stores, and Boeing Defense, Space & Security.
There were 4,127 building permits issued in Oklahoma City in 2012 (2834 more than in 2011) compared to 146 building permits issued in St. Louis in 2012 (105 more than in 2011).
In Oklahoma City (Oklahoma County), 41.7% voted for Democrats and 58.3% for Republicans in 2012 Presidential Election. In St. Louis (St. Louis city), 82.4% voted for Democrats and 15.9% for Republicans.
Elections
Type
Democrats
Republicans
Other
Year
Oklahoma City
St. Louis
Oklahoma City
St. Louis
Oklahoma City
St. Louis
2020
48.1%
82.4%
49.2%
16.1%
2.7%
1.6%
2016
41.2%
79.0%
51.7%
15.8%
7.1%
5.2%
2012
41.7%
82.4%
58.3%
15.9%
0.0%
1.6%
2008
41.6%
83.8%
58.4%
15.5%
0.0%
0.7%
2004
35.8%
80.4%
64.2%
19.2%
0.0%
0.3%
2000
36.6%
77.5%
62.3%
19.9%
1.1%
2.6%
1996
36.5%
74.8%
54.7%
18.1%
8.8%
7.1%
Breakdown of population affiliated with a religious congregation
Type
Adherents
Congregations
Religion
Oklahoma City
St. Louis
Oklahoma City
St. Louis
SOUTHERN BAPTIST CONVENTION
20.7%
2.5%
20.0%
9.0%
CATHOLIC CHURCH
8.5%
15.4%
3.0%
9.5%
EPISCOPAL CHURCH
0.7%
0.5%
1.3%
1.5%
INTERNA PENTECO HOLINESS CHURCH
0.7%
0.0%
2.9%
0.0%
LUTHERAN CHURCH
0.5%
2.2%
1.0%
6.1%
SEVENTH DAY ADVENTIST CHURCH
0.4%
0.3%
1.5%
0.5%
AMERICAN BAPTIST CHURCHES IN THE USA
0.3%
1.8%
0.1%
2.4%
MUSLIM ESTIMATE
0.3%
1.1%
0.6%
2.4%
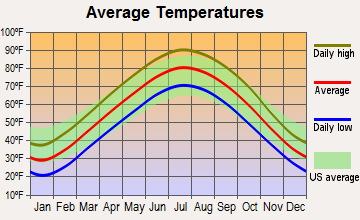
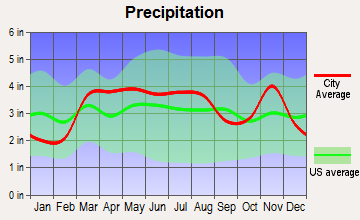
Weather
Both cities experience a wide range of weather conditions. St. Louis has a humid continental climate with hot summers and cold winters, while Oklahoma City has a subtropical climate with hot, often humid summers, and cold winters. Both cities get a fair amount of rainfall, with the spring being the wettest season.
Weather and climate
Type
Oklahoma City
St. Louis
Temperature - Average
60.1°F
56.5°F
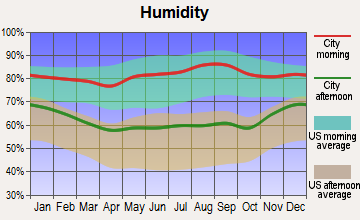
Humidity - Average morning or afternoon humidity
73.1%
74.8%
Humidity - Differences between morning and afternoon humidity
35%
32%
Humidity - Maximum monthly morning or afternoon humidity
85%
85%
Humidity - Minimum monthly morning or afternoon humidity
50%
53%
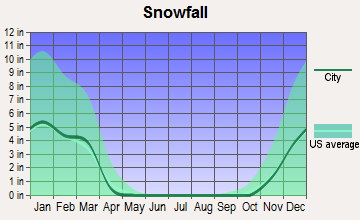
Precipitation - Yearly average
35.7 in
39 in
Snowfall - Yearly average
17.2 in
37.2 in
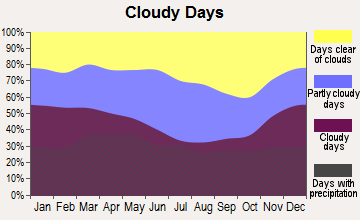
Clouds - Number of days clear of clouds
23.1%
16.7%
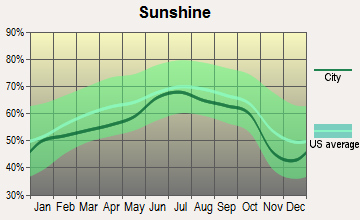
Sunshine amount - Average
72.1%
62.2%
Sunshine amount - Differences during a year
21%
30%
Sunshine amount - Maximum monthly
79%
71%
Sunshine amount - Minimum monthly
58%
41%
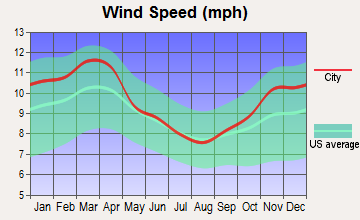
Wind speed - Average
12.3 mph
9.8 mph
Average climate in Oklahoma City, Oklahoma
Average climate in St. Louis, Missouri
Air pollution
Type
AQI
CO
NO2
OZONE
PB
PM10
PM25
SO2
Year
Oklahoma City
St. Louis
Oklahoma City
St. Louis
Oklahoma City
St. Louis
Oklahoma City
St. Louis
Oklahoma City
St. Louis
Oklahoma City
St. Louis
Oklahoma City
St. Louis
Oklahoma City
St. Louis
2018
85
101
0.29
0.26
6.6
10.7
31.9
27.5
0.002
N/A
21.3
19.7
9.6
9.8
0.0
0.8
2017
82
90
0.32
0.25
6.7
10.4
33.0
28.5
0.002
N/A
20.7
16.2
8.9
8.0
0.0
1.4
2016
72
96
0.29
0.29
6.6
11.1
31.9
25.8
0.002
N/A
19.4
15.5
8.5
8.5
0.2
1.2
2015
76
97
0.24
0.28
7.0
11.8
31.5
22.2
0.002
N/A
19.1
16.6
7.8
10.5
0.5
1.6
2014
84
97
0.15
0.27
7.1
12.2
32.4
25.5
0.002
N/A
N/A
17.8
8.7
10.5
0.1
1.8
2013
84
92
0.14
0.27
8.6
12.2
32.8
26.2
0.002
N/A
N/A
16.3
9.3
10.6
0.2
2.1
2012
97
114
0.13
0.27
9.4
14.4
34.0
27.9
0.007
N/A
N/A
17.5
7.9
10.2
0.3
2.3
2011
107
107
0.24
0.27
9.9
13.2
36.3
27.0
0.003
N/A
N/A
17.3
9.9
12.4
0.8
2.7
2010
81
110
0.30
0.31
8.8
12.8
31.7
23.1
0.002
N/A
N/A
16.2
9.8
12.9
0.7
3.3
2009
82
101
0.52
0.31
8.1
12.5
31.9
22.2
0.002
0.039
N/A
21.6
10.2
12.4
0.7
2.8
2008
78
98
0.51
0.32
9.8
12.9
31.0
22.9
N/A
0.054
N/A
32.4
N/A
12.8
1.4
2.6
2007
81
125
0.44
0.37
10.2
14.1
29.4
24.3
N/A
0.055
N/A
38.8
N/A
14.6
2.0
2.9
2006
95
109
0.43
0.38
10.1
15.2
33.7
23.3
N/A
0.044
N/A
38.2
N/A
14.7
1.2
3.1
2005
88
110
0.38
0.39
11.6
16.3
31.0
24.4
N/A
0.056
N/A
41.4
N/A
N/A
1.3
4.1
2004
75
92
0.46
0.49
10.5
20.0
28.6
19.6
N/A
0.013
N/A
38.3
N/A
N/A
0.6
3.7
2003
87
106
0.42
0.49
10.9
19.6
30.8
21.7
N/A
0.044
N/A
37.8
N/A
N/A
N/A
3.7
2002
91
117
0.35
0.56
14.3
21.7
29.0
21.1
N/A
0.022
N/A
45.4
N/A
N/A
2.0
4.4
2001
87
100
0.69
0.57
13.1
22.4
31.0
20.4
N/A
0.057
N/A
46.6
N/A
N/A
1.8
5.0
2000
89
98
0.66
0.78
13.4
23.8
29.5
20.6
N/A
0.057
N/A
N/A
N/A
N/A
3.0
5.5
Natural disasters
Type
Oklahoma City
St. Louis
Tornado activity compared to U.S. average
353.4%
182.4%
Earthquake activity compared to U.S. average
938.9%
413.3%
Natural disasters compared to U.S. average
43%
0%
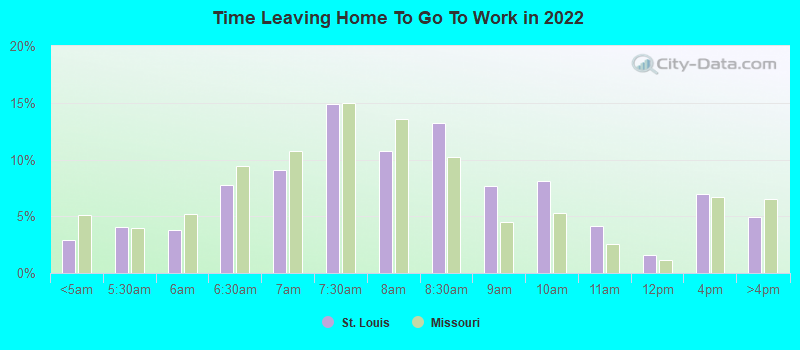
Transportation
Both cities have developed transportation systems, although St. Louis offers more extensive public transit with the MetroLink light rail system. Commuting times in both cities are generally reasonable, though this can vary depending on the specific area.
Transport
Type
Oklahoma City
St. Louis
Amtrak stations
1
1
Amtrak stations nearby
2
2
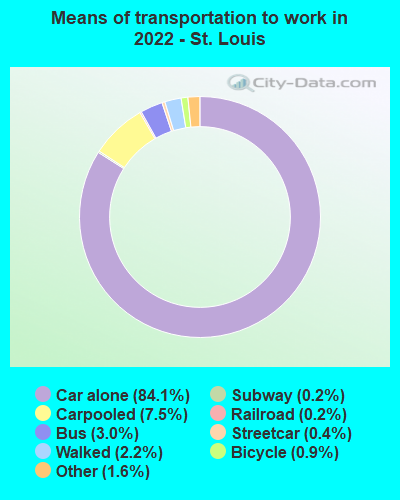
Means of transportation to work
Type
Oklahoma City
St. Louis
Bicycle
0.2%
0.5%
Bus
0.3%
3.7%
Carpooled
8.6%
7.5%
Car alone
87.6%
83.9%
Railroad
0%
0.3%
Streetcar
0%
0.2%
Subway
0%
0.3%
Taxicab
0.2%
0.3%
Walked
1.4%
2.5%
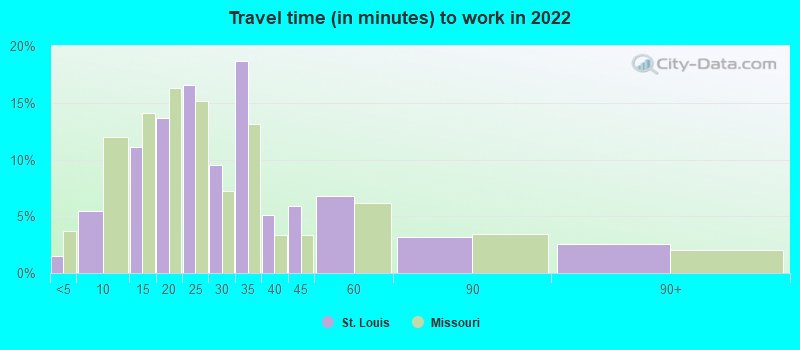
Average travel time to work
Type
Oklahoma City
St. Louis
Average
25.6 min
29.4 min
Other means
21 min
22.9 min
Public transportation
33.1 min
42.8 min
Private vehicle occupancy
Type
Oklahoma City
St. Louis
Average
1.2
1.1
Drove alone
89.5%
91.6%
In 2 person carpool
7.1%
6.5%
In 3 person carpool
1.9%
1%
In 4 person carpool
0.7%
0.1%
In 5-6 person carpool
0.5%
0.1%
In 7+ person carpool
0.2%
0.7%
How many people usually rode to work in the car, truck or van.
Real Estate
The cost of real estate is generally more affordable in Oklahoma City than in St. Louis. There are diverse neighborhoods in both cities, offering a range of housing options to suit various preferences and budgets.
Neighborhoods
Both cities feature a variety of neighborhoods with distinct characteristics. From the historical charm of the Central West End in St. Louis to the vibrant energy of Bricktown in Oklahoma City, both cities offer neighborhoods to cater to a myriad of tastes.
Houses and residents
Type
Oklahoma City
St. Louis
Houses
302,241
173,493
Average household size (people)
2.5
2.2
Median year apartment built
1978
1943
Length of stay in the house since moving in
11.8 years
14.2 years
Houses occupied
275,285 (91.1%)
139,736 (80.5%)
Houses occupied by owners
164,470 (59.7%)
63,653 (45.6%)
Houses occupied by renters
110,815 (40.3%)
76,083 (54.4%)
Median rent asked for vacant for-rent units
$1,241
$923.98
Median monthly housing costs
$983
$883
Median price asked for vacant for-sale houses and condos
$278,299
$56,913
Estimated median house or condo value
$190,900
$170,800
Median numbers of rooms
5.5
4.8
Median number of rooms in apartments
4.3
4
Median number of rooms in houses and condos
6.2
5.9
Median house price - detached houses
$254,772
$196,007
Median house price - in 2-unit structures
$318,820
$166,673
Median house price - in 3-to-4-unit structures
$128,784
$155,363
Median house price - in 5 or more unit structures
$170,231
$260,843
Median house price - mobile homes
$112,256
$35,054
Median house price - Townhouses or other attached units
$245,885
$272,667
Median house price - All housing units
$249,488
$200,041
Median house age
40
2,021
Renting percentage
40.3%
54.6%
Housing density (houses/condos per square mile)
497.9
2,801.7
House value disparities
34.7%
38.7%
Household income disparities
44.3%
48.3%
Median household income for houses/condes with a mortgage
$87,907
$87,762
Median household income for apartments without a mortgage
$61,761
$55,824
Housing units without a mortgage
1,238 (1.2%)
1,236 (2.9%)
Housing units with both a second mortgage and home equity loan
4,838 (4.7%)
2,537 (6%)
Housing units with a mortgage
100,798 (98.8%)
41,018 (97.1%)
Housing units with a home equity loan
123 (0.1%)
188 (0.4%)
Housing units with a second mortgage
5,921 (5.8%)
3,349 (7.9%)
House/condo owner moved in on average (years ago)
9
10
House/condo renter moved in on average (years ago)
1
2
Housing units lacking complete kitchen facilities
3.1%
9.2%
Housing units lacking complete plumbing facilities
1.9%
5.8%
Housing units in structures
Housing units in structures
Oklahoma City
St. Louis
One, detached
67.8%
43.2%
One, attached
3.4%
4.1%
Two
2.0%
14.2%
3 or 4
5.1%
13.5%
5 to 9
6.0%
4.9%
10 to 19
5.6%
2.2%
20 to 49
2.4%
3.8%
50 or more
4.6%
13.5%
Mobile homes
3.1%
0.5%
Boats, RVs, vans, etc.
0.1%
0.0%
Median real estate property taxes paid for housing units
Self-employed workers in own not incorporated business
20,964
8,126
State government workers
17,132
2,962
Unpaid family workers
555
315
Industries and Occupations
The predominant industries in Oklahoma City are oil, gas, and energy, with growing sectors in aviation and biotechnology. St. Louis, on the other hand, is home to various industries including healthcare, finance, manufacturing, and trade.
Both cities have exceptional healthcare institutions. St. Louis is known for its specialized children's hospitals, and Oklahoma City for its robust medical research facilities.
Health (county statistics)
Type
Oklahoma City
St. Louis
General health status score of residents in this county from 1 (poor) to 5 (excellent)
Both cities have invested significantly in infrastructure development. There are ongoing efforts in both St. Louis and Oklahoma City to improve public facilities, transportation systems, utilities, and more.
HMDA - Conventional home purchase loans - Applications denied
Year
Oklahoma City
St. Louis
1999
2,925
0
2000
2,396
0
2001
1,824
0
2002
1,507
0
2003
2,014
1,583
2004
2,323
2,101
2005
3,134
2,853
2006
3,132
3,391
2007
2,036
2,022
2008
1,143
841
2009
593
247
Culture and Food
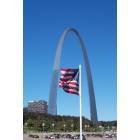
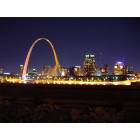
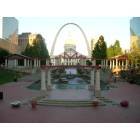
St. Louis boasts an exciting food and cultural scene, from its famous BBQ to the iconic Gateway Arch. Oklahoma City offers a unique blend of Western heritage and modern culture with diverse cuisines and strong performing arts scene.
Sports Teams
While St. Louis is home to the Cardinals (MLB) and Blues (NHL), Oklahoma City is best known for the Thunder (NBA). Each city has a strong sports tradition that fosters a sense of community pride.


 Oklahoma City, OK
 St. Louis, MO