Omaha, Nebraska, and Tulsa, Oklahoma, are two vibrant American cities offering unique attractions, communities, and economies. While Omaha boasts a blend of urban sophistication and Midwestern friendliness, Tulsa prides itself on a rich cultural scene and robust petroleum-based economy. However, each city's characteristics can sway one's decision toward relocation or tourism, hence the necessity to consider factors such as cost of living, local industries, and cultural scenes. This guide offers an in-depth comparison of these cities, from safety to health care.
Distance between
Omaha, NE and
Tulsa, OK : 354.4 miles
Omaha's population is larger by 18%. Its population has grown by 97,293 people (24.9%) since 2000. The population of Tulsa has grown by 18,352 people (4.7%) during that time.
Both Tulsa and Omaha have higher crime rates compared to national averages. Omaha's crime rate is slightly lower than Tulsa's, making it considerably safer. In Omaha, crime rates are significantly lower in suburban neighborhoods. Likewise, Tulsa's suburban areas are safer. Police presence is visible in both towns, and authorities are actively improving community relations and implementing preventive tactics.
Cost of Living
Both Tulsa and Omaha boast cost of living indices below the national average, but Tulsa is somewhat less expensive overall. While both cities have affordable housing markets, Tulsa's median home cost is lower than Omaha's. However, income levels are higher in Omaha, somewhat offsetting the cost difference.
Income Tax
Nebraska imposes a graduated state income tax that ranges from 2.46% to 6.84%. Oklahoma, on the other hand, places a graduated state income tax that varies from 0.5% to 5.0% on its residents. Therefore, depending on your income bracket, you could potentially pay more income tax living in Omaha than in Tulsa.
Property Tax
Omaha has a higher property tax rate than Tulsa which can influence home buyer's decisions. The average property tax rate in Omaha is around 2%, while in Tulsa it's approximately 1.12%, making Tulsa more attractive for potential homeowners favouring lower property taxes.
Sales Tax
Omaha, located in Nebraska, has a combined city and state sales tax rate of approximately 7.25%, which is higher than Tulsa, located in Oklahoma, that stands at approximately 8.5%. Therefore, Tulsa residents may find themselves paying slightly higher sales taxes than their Omaha counterparts.
Income
Type
Omaha
Tulsa
Estimated median household income
$62,948
$51,008
Estimated per capita income
$38,062
$33,002
Cost of living index (U.S. average is 100)
89.4
86.5
If you make $50,000 in Tulsa, you will have to make $51,676 in Omaha to maintain the same standard of living.
Geographical Conditions
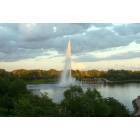
Omaha is located in the heartland of America on the banks of Missouri River, offering multiple parks and trails. Tulsa is located near the Ozark Mountains with the majestic Arkansas River running through the city. Both cities offer picturesque landscapes, outdoor recreational activities, but Tulsa's geographic location lends itself to more dramatic natural beauty.
Omaha houses several well-regarded school districts and institutions of higher learning such as the University of Nebraska Omaha. Tulsa also offers a good education scene with highly-rated public schools and a range of colleges including the University of Tulsa. Both cities have public and private school options, but Omaha has a slightly better average school test score.
Omaha has a diverse economy with a focus on finance, insurance, and health services. Berkshire Hathaway, headquartered in Omaha, heavily influences the city's economic landscape. Tulsa's economy revolves around energy, aviation, telecommunications, and manufacturing. While Omaha's job market seems more robust and dynamic, Tulsa's economy offers specialty industry opportunities.
Biggest Employers
In Omaha, some of the biggest employers include Berkshire Hathaway, Mutual of Omaha, and the University of Nebraska Medical Center. Meanwhile, Tulsa hosts large employers like American Airlines Maintenance Base, ONEOK, and Saint Francis Health System. Both cities offer a wide range of employment opportunities.
There were 1,620 building permits issued in Omaha in 2012 (460 more than in 2011) compared to 652 building permits issued in Tulsa in 2012 (333 more than in 2011).
In Omaha (Douglas County), 47.5% voted for Democrats and 50.6% for Republicans in 2012 Presidential Election. In Tulsa (Tulsa County), 36.3% voted for Democrats and 63.7% for Republicans.
Elections
Type
Democrats
Republicans
Other
Year
Omaha
Tulsa
Omaha
Tulsa
Omaha
Tulsa
2020
54.4%
40.9%
43.1%
56.5%
2.5%
2.7%
2016
47.3%
35.6%
45.0%
58.4%
7.7%
6.1%
2012
47.5%
36.3%
50.6%
63.7%
1.9%
0.0%
2008
51.7%
37.8%
47.0%
62.2%
1.3%
0.0%
2004
40.4%
35.6%
58.6%
64.4%
1.0%
0.0%
2000
40.1%
37.3%
55.2%
61.3%
4.7%
1.3%
1996
39.3%
37.1%
51.4%
53.6%
9.3%
9.3%
Breakdown of population affiliated with a religious congregation
Type
Adherents
Congregations
Religion
Omaha
Tulsa
Omaha
Tulsa
CATHOLIC CHURCH
24.0%
8.1%
11.8%
3.1%
EVANGELICAL LUTHERAN CHURCH IN AMERICA
4.1%
0.4%
6.6%
0.9%
LUTHERAN CHURCH
2.5%
0.7%
4.3%
1.2%
SOUTHERN BAPTIST CONVENTION
1.5%
14.9%
5.2%
18.6%
MUSLIM ESTIMATE
0.9%
0.5%
0.7%
0.7%
AMERICAN BAPTIST CHURCHES IN THE USA
0.5%
0.3%
2.8%
0.5%
EPISCOPAL CHURCH
0.5%
0.8%
1.4%
1.3%
SALVATION ARMY
0.4%
0.1%
0.9%
0.4%
SEVENTH DAY ADVENTIST CHURCH
0.3%
0.4%
1.7%
1.1%
EVANGELICAL PRESBYTERIAN CHURCH
0.2%
0.4%
0.2%
0.1%
INTERNA PENTECO HOLINESS CHURCH
0.0%
0.7%
0.7%
0.7%
NATIONAL ASSOCIATION FREE WILL BAPTISTS
0.0%
0.5%
0.0%
3.1%
Weather
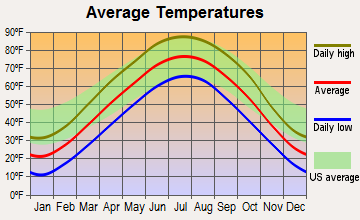
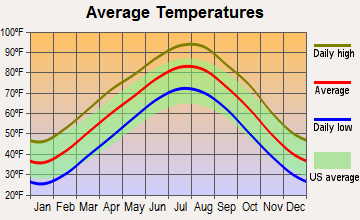
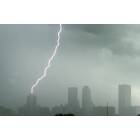
Omaha experiences fairly broad seasonal weather patterns with hot, humid summers and cold, snowy winters. Tulsa, on the other hand, has a temperate climate with more mild winters and considerably hotter summers. Tulsa's proximity to "Tornado Alley" can result in occasional severe weather. Overall, your preference between a four-season climate or milder winters might influence your choice.
Weather and climate
Type
Omaha
Tulsa
Temperature - Average
50.6°F
60.4°F
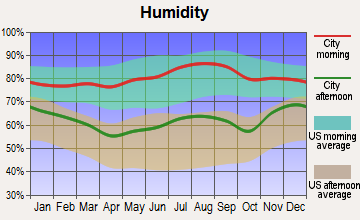
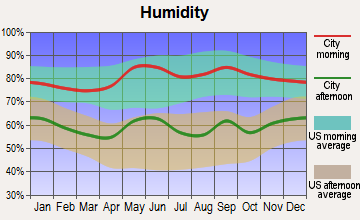
Humidity - Average morning or afternoon humidity
75.9%
73.8%
Humidity - Differences between morning and afternoon humidity
35%
33%
Humidity - Maximum monthly morning or afternoon humidity
87%
85%
Humidity - Minimum monthly morning or afternoon humidity
52%
52%
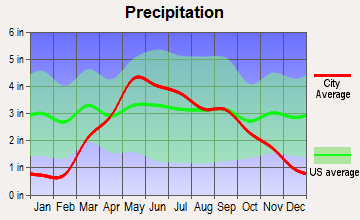
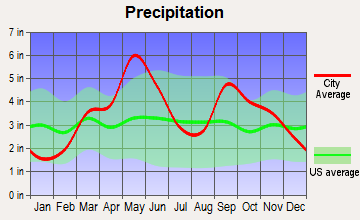
Precipitation - Yearly average
30 in
42.1 in
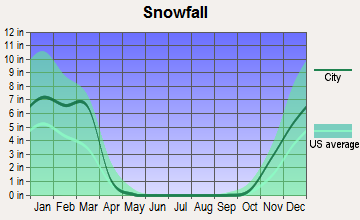
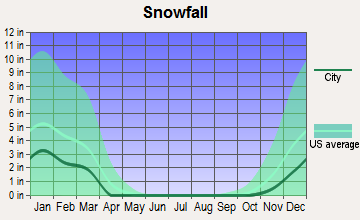
Snowfall - Yearly average
57.2 in
18.4 in
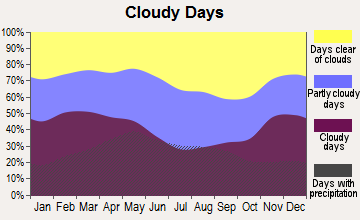
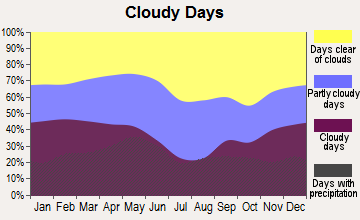
Clouds - Number of days clear of clouds
18.4%
21.1%
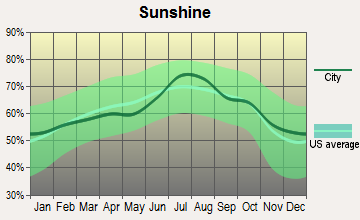
Sunshine amount - Average
66.7%
64.8%
Sunshine amount - Differences during a year
27%
24%
Sunshine amount - Maximum monthly
74%
74%
Sunshine amount - Minimum monthly
47%
50%
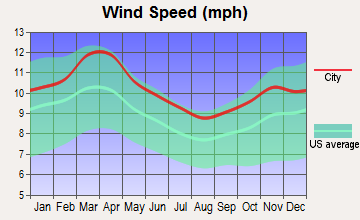
Wind speed - Average
10.8 mph
10.2 mph
Average climate in Omaha, Nebraska
Average climate in Tulsa, Oklahoma
Air pollution
Type
AQI
CO
NO2
OZONE
PB
PM10
PM25
SO2
Year
Omaha
Tulsa
Omaha
Tulsa
Tulsa
Omaha
Tulsa
Omaha
Tulsa
Omaha
Omaha
Tulsa
Omaha
Tulsa
2018
75
88
0.18
0.24
N/A
N/A
26.7
28.6
N/A
0.004
19.3
N/A
8.4
11.6
0.5
0.4
2017
76
80
0.19
0.22
N/A
N/A
26.3
29.9
N/A
0.004
21.6
N/A
9.6
10.2
0.9
0.5
2016
80
86
0.18
0.24
N/A
N/A
26.3
29.1
N/A
0.005
19.3
N/A
8.1
9.5
0.7
0.5
2015
79
74
0.20
0.25
N/A
N/A
26.9
28.1
N/A
0.004
20.3
N/A
9.3
8.6
0.9
0.8
2014
80
74
0.23
0.16
N/A
N/A
27.9
29.2
N/A
0.005
23.5
N/A
8.8
9.2
1.2
0.3
2013
79
85
0.20
0.21
N/A
N/A
28.0
29.8
N/A
0.005
26.9
N/A
9.3
10.1
1.4
0.5
2012
100
103
0.21
0.21
N/A
N/A
27.1
32.4
N/A
0.007
39.0
N/A
8.4
11.7
1.6
0.7
2011
96
108
0.21
0.27
N/A
N/A
25.4
33.8
N/A
0.005
32.9
N/A
9.2
13.8
1.6
0.8
2010
102
83
N/A
0.26
N/A
N/A
28.0
30.1
N/A
0.004
43.2
N/A
10.5
12.2
2.1
0.7
2009
73
88
N/A
0.26
N/A
N/A
24.3
29.8
N/A
0.004
28.7
N/A
N/A
12.2
1.8
0.7
2008
104
71
N/A
N/A
N/A
N/A
26.9
26.7
N/A
0.007
45.0
N/A
18.9
N/A
1.1
N/A
2007
109
77
0.51
0.32
N/A
N/A
29.0
28.8
N/A
0.007
N/A
N/A
16.5
N/A
1.7
0.8
2006
86
95
0.50
N/A
N/A
N/A
30.0
32.9
N/A
N/A
N/A
N/A
13.0
N/A
1.3
N/A
2005
78
84
0.47
N/A
N/A
N/A
32.8
28.9
N/A
N/A
N/A
N/A
12.9
N/A
2.8
N/A
2004
51
71
0.44
N/A
N/A
N/A
30.9
27.5
N/A
N/A
N/A
N/A
N/A
N/A
1.5
N/A
2003
50
94
0.43
N/A
N/A
N/A
26.6
29.2
N/A
N/A
N/A
N/A
N/A
N/A
0.7
N/A
2002
48
85
0.38
0.83
7.8
N/A
27.6
27.7
0.030
N/A
N/A
N/A
N/A
N/A
1.1
N/A
2001
39
102
0.35
0.75
14.4
N/A
25.0
30.6
0.038
N/A
N/A
N/A
N/A
N/A
0.4
N/A
2000
44
101
0.50
0.69
15.3
N/A
26.1
28.9
0.049
N/A
N/A
N/A
N/A
N/A
0.5
N/A
Natural disasters
Type
Omaha
Tulsa
Tornado activity compared to U.S. average
191.9%
277.6%
Earthquake activity compared to U.S. average
415.1%
901.9%
Natural disasters compared to U.S. average
21%
34%
Transportation
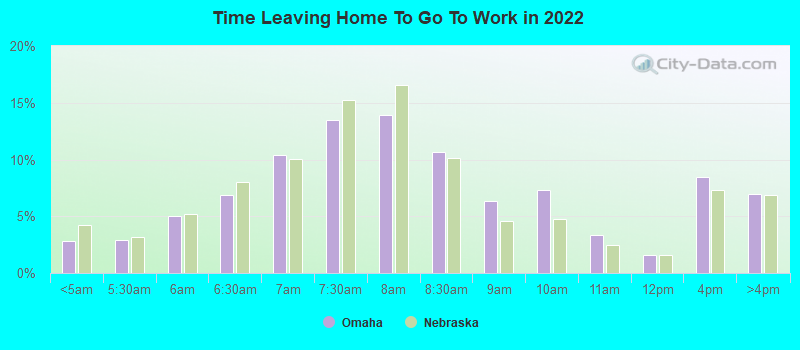
Both Tulsa and Omaha have comprehensive transportation systems including bus services, bike-sharing programs, and taxi services. However, Omaha's public transit is seen as more efficient, and the city is also continually improving its bike lanes. Car commuting is common in both cities, but Omaha has a slightly shorter average commute time.
Transport
Type
Omaha
Tulsa
Amtrak stations
1
1
Amtrak stations nearby
1
1
FAA registered aircraft
405
808
FAA registered aircraft manufacturers and dealers
24
35
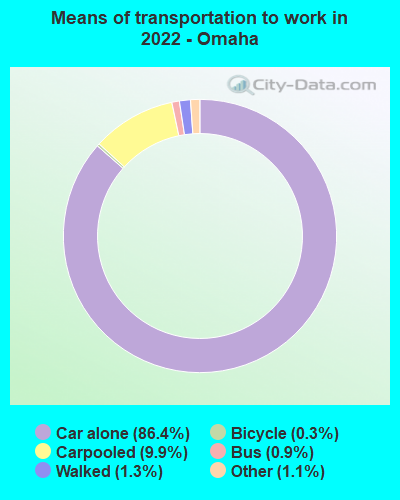
Means of transportation to work
Type
Omaha
Tulsa
Bicycle
0.2%
0.1%
Bus
0.7%
0.1%
Carpooled
8.2%
9%
Car alone
87.8%
87.9%
Motorcycle
0.1%
0.1%
Taxicab
0.1%
0.1%
Walked
2%
1.4%
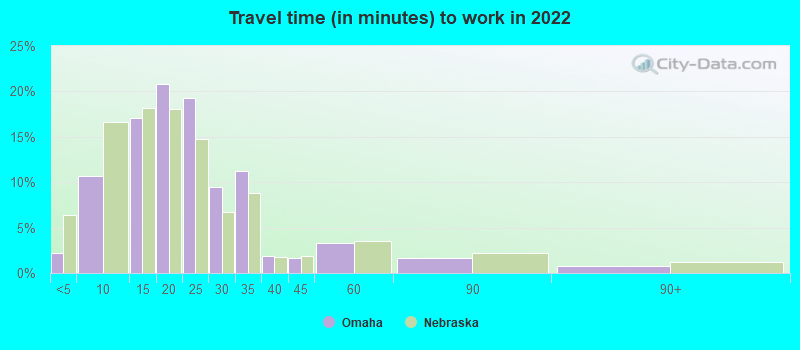
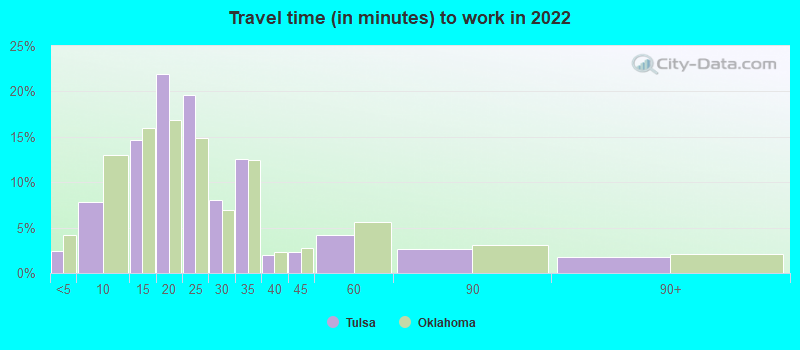
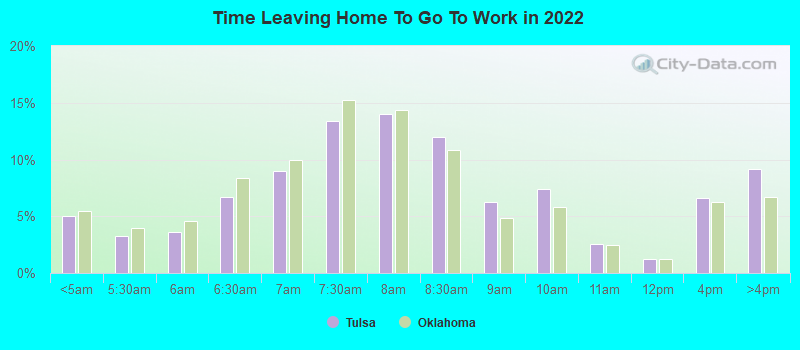
Average travel time to work
Type
Omaha
Tulsa
Average
22.5 min
23.8 min
Other means
18.8 min
19.2 min
Public transportation
39 min
40.1 min
Private vehicle occupancy
Type
Omaha
Tulsa
Average
1.1
1.2
Drove alone
90.4%
88.9%
In 2 person carpool
6.9%
8.7%
In 3 person carpool
1.4%
1.5%
In 4 person carpool
0.7%
0.3%
In 5-6 person carpool
0.6%
0.5%
In 7+ person carpool
0.1%
0.1%
How many people usually rode to work in the car, truck or van.
Real Estate
Omaha's real-estate market is a mix of classic Midwestern homes, modern condos, and townhouses catering to diverse needs. In contrast, Tulsa property market offers historic homes, especially in midtown areas, alongside new builds. Both cities offer attractive choices, but you might find cheaper options in Tulsa.
Neighborhoods
Omaha is recognized for its highly-ranked neighborhoods like Elkhorn known for its great schools and family-friendly environment. In Tulsa, neighborhoods like Brookside stand out for their vibrant arts scene and trendy eateries. Both cities offer a mix of suburban feel and urban conveniences, but neighborhood choice may depend on personal preference.
Houses and residents
Type
Omaha
Tulsa
Houses
212,802
194,402
Average household size (people)
2.5
2.3
Median year apartment built
1976
1975
Median year house/condo built
1970
1969
Length of stay in the house since moving in
13.3 years
12.9 years
Houses occupied
201,469 (94.7%)
173,943 (89.5%)
Houses occupied by owners
117,404 (58.3%)
89,307 (51.3%)
Houses occupied by renters
84,065 (41.7%)
84,636 (48.7%)
Median rent asked for vacant for-rent units
$892.09
$899.30
Median monthly housing costs
$1,119
$897
Median price asked for vacant for-sale houses and condos
$261,376
$163,212
Estimated median house or condo value
$211,900
$172,000
Median numbers of rooms
5.8
5.2
Median number of rooms in apartments
4
4.1
Median number of rooms in houses and condos
7.1
6.4
Median house price - detached houses
$249,098
$247,367
Median house price - in 2-unit structures
$191,723
$496,968
Median house price - in 3-to-4-unit structures
$100,661
$94,964
Median house price - in 5 or more unit structures
$319,464
$176,274
Median house price - mobile homes
$35,876
$73,235
Median house price - Townhouses or other attached units
$186,544
$184,309
Median house price - All housing units
$246,177
$241,263
Median house age
49
49
Renting percentage
41.7%
46.5%
Housing density (houses/condos per square mile)
1,839.2
1,064.4
House value disparities
33.1%
41.8%
Household income disparities
45.6%
48.1%
Median household income for houses/condes with a mortgage
$98,149
$84,820
Median household income for apartments without a mortgage
$71,454
$57,403
Housing units without a mortgage
2,417 (2.9%)
855 (1.7%)
Housing units with both a second mortgage and home equity loan
7,375 (8.9%)
2,464 (4.8%)
Housing units with a mortgage
80,503 (97.1%)
50,494 (98.3%)
Housing units with a home equity loan
335 (0.4%)
93 (0.2%)
Housing units with a second mortgage
9,200 (11.1%)
3,580 (7%)
House/condo owner moved in on average (years ago)
12
11
House/condo renter moved in on average (years ago)
1
1
Housing units lacking complete kitchen facilities
1.6%
2.9%
Housing units lacking complete plumbing facilities
0.7%
1.7%
Housing units in structures
Housing units in structures
Omaha
Tulsa
One, detached
63.2%
62.9%
One, attached
3.9%
2.8%
Two
1.5%
1.9%
3 or 4
2.2%
5.0%
5 to 9
6.8%
6.8%
10 to 19
8.3%
9.2%
20 to 49
5.3%
4.4%
50 or more
8.1%
5.8%
Mobile homes
0.6%
1.1%
Boats, RVs, vans, etc.
0.0%
0.2%
Median real estate property taxes paid for housing units
Self-employed workers in own not incorporated business
11,886
13,964
State government workers
7,835
5,897
Unpaid family workers
205
284
Industries and Occupations
Omaha has a well-rounded job market with strong healthcare, education, finance, and insurance sectors. Conversely, Tulsa specializes in sectors like oil, natural gas, aerospace, and manufacturing. For job seekers, the choice between these two cities might come down to industry-specific opportunities.
Health care is comprehensive in both cities, with Omaha being a regional health hub featuring facilities like the Nebraska Medical Center. Tulsa offers a network of hospitals and clinics, including Saint Francis Hospital. Most health metrics are similar between the two cities, but Omaha’s healthcare scene provides more specialties due to larger hospitals and medical schools.
Health (county statistics)
Type
Omaha
Tulsa
General health status score of residents in this county from 1 (poor) to 5 (excellent)
Omaha's infrastructural development complements its urban aesthetics, with well-maintained roads and a constantly improving public transit system. Tulsa's infrastructure, while aging in some areas, has seen significant improvements like the Gathering Place park along the Arkansas River. Both cities are investing in sustainable infrastructure, but Omaha may have a slight edge in overall quality.
Infrastructure
Type
Omaha
Tulsa
Hospitals
23
45
TV stations
19
20
Arenas or stadiums
2
2
Bank branches located here
183
160
Bank institutions located here
31
40
Main business address for public companies
30
27
Nuclear power plants nearby
1
0
Drinking water stations with no reported violations in the past
8
0
Drinking water stations with reported violations in the past
HMDA - Conventional home purchase loans - Applications denied
Year
Omaha
Tulsa
1999
1,177
2,135
2000
545
1,531
2001
390
1,216
2002
441
1,106
2003
747
1,243
2004
1,022
1,354
2005
1,055
1,709
2006
1,083
1,756
2007
646
1,014
2008
318
517
2009
220
327
Culture and Food
Both Omaha and Tulsa have rich cultural scenes. Omaha is home to a vibrant arts community with venues like The Joslyn Art Museum, and the food scene leans towards Midwestern fare with a modern twist. Tulsa's culture is steeped in the Southwestern tradition with a significant influence from Native American culture. It also features an impressive music scene and a variety of food options, from traditional barbecue to global cuisines.
Sports Teams
Omaha is a passionate sports town with a focus on college sports, especially the annual College World Series. Tulsa supports professional and college sports teams like the Tulsa Drillers baseball team or the University of Tulsa's NCAA Division I sports. So while Omaha has a larger sports culture, Tulsa offers a mix of collegiate and minor league sports.


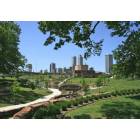
 Omaha, NE
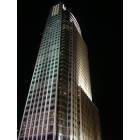
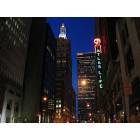
 Tulsa, OK