Philadelphia, Pennsylvania, and Bakersfield, California, are two distinct cities with their own unique offerings. From crime and safety to culture and food, the two cities provide contrasting experiences for both residents and visitors. Philadelphia, known for its rich history and vibrant city life, stands in stark contrast to the relaxed, agricultural-oriented life of Bakersfield. Let's dive deep into these factors across both cities to provide comprehensive insights into what distinguishes them.
Distance between
Philadelphia, PA and
Bakersfield, CA : 2,396.8 miles
Philadelphia's population is larger by 287%. Its population has grown by 58,701 people (3.9%) since 2000. The population of Bakersfield has grown by 160,558 people (65.0%) during that time.
Philadelphia has a higher crime rate than Bakersfield, with property and violent crimes being relatively higher. However, considering its vast size and high population density, the city continues to work on improving safety with various community programs. On the other hand, Bakersfield has a lower crime rate, with a higher safety index compared to big cities. In both cities, it's suggested to stay updated with local law enforcement advisories and adhere to safety guidelines for a secure experience.
City-data.com crime index counts serious crimes and violent crime more heavily. It adjusts for the number of visitors and daily workers commuting into cities. (higher means more crime, U.S. average = 301.1)
City-data.com crime index counts serious crimes and violent crime more heavily. It adjusts for the number of visitors and daily workers commuting into cities. (higher means more crime, U.S. average = 301.1)
Sex Offenders
According to our data, there are 2,754 registered sex offenders living in Philadelphia and 1,147 registered sex offenders living in . The ratio of residents to sex offenders in Philadelphia is 569 to 1; the ratio in Bakersfield is 328 to 1. The number of registered sex offenders compared to the number of residents is a smaller in Philadelphia than in Bakersfield.
Cost of Living
The cost of living in Philadelphia is generally higher, with housing, transportation, and groceries surpassing the national average. Bakersfield, on the other hand, is comparatively affordable with a cost of living nearly on par with the national average. However, the higher wages in Philadelphia somewhat balance the cost of living differences.
Income Tax
Pennsylvania imposes a flat statewide income tax rate of 3.07%. On the contrary, California has a progressive income tax, which can be significantly higher depending upon one's income.
Property Tax
Property taxes are higher in Philadelphia compared to Bakersfield. Pennsylvania's average effective property tax rate is around 1.50%, while in Bakersfield, it averages 0.72%.
Sales Tax
Both cities have a similar sales tax rate, with Philadelphia at 8% and Bakersfield at 7.25%. However, Pennsylvania has a lower state sales tax compared to California as a whole.
Income
Type
Philadelphia
Bakersfield
Estimated median household income
$52,899
$66,666
Estimated per capita income
$32,707
$29,363
Cost of living index (U.S. average is 100)
105.4
92.6
If you make $50,000 in Bakersfield, you will have to make $56,911 in Philadelphia to maintain the same standard of living.
Geographical Conditions
Philadelphia is situated in the Northeastern U.S. along the Delaware and Schuylkill rivers, offering a range of urban and natural landscapes. Bakersfield lies in the San Joaquin Valley of California, surrounded by significant mountain ranges and national parks.
For education, Philadelphia houses many prestigious institutions, including the University of Pennsylvania and Temple University. In comparison, Bakersfield offers educational opportunities at California State University, Bakersfield, and Bakersfield College. Both cities have a range of public, private, and charter schools for K-12 education.
Philadelphia's economy thrives on education, health care, and professional services, with a diverse mix of other sectors contributing as well. Bakersfield, conversely, is known for its agriculture, oil, and manufacturing industries. The job growth rate in Philadelphia is higher than in Bakersfield, but Bakersfield offers ample opportunities in its predominant industries.
Biggest Employers
In Philadelphia, some of the largest employers include the University of Pennsylvania, U.S. Government, and Children's Hospital of Philadelphia. In Bakersfield, the top employers are Kern County, The Giumarra Companies, and Grimmway Farms, reflecting the city's agricultural and manufacturing orientation.
There were 1,553 building permits issued in Philadelphia in 2012 (1108 more than in 2011) compared to 1,121 building permits issued in Bakersfield in 2012 (699 more than in 2011).
In Philadelphia (Philadelphia County), 85.2% voted for Democrats and 14.0% for Republicans in 2012 Presidential Election. In Bakersfield (Kern County), 40.3% voted for Democrats and 57.0% for Republicans.
Elections
Type
Democrats
Republicans
Other
Year
Philadelphia
Bakersfield
Philadelphia
Bakersfield
Philadelphia
Bakersfield
2020
81.2%
43.7%
17.9%
53.9%
0.9%
2.4%
2016
82.3%
40.4%
15.3%
53.1%
2.4%
6.5%
2012
85.2%
40.3%
14.0%
57.0%
0.8%
2.7%
2008
83.2%
40.1%
16.4%
57.9%
0.4%
1.9%
2004
80.6%
32.7%
19.4%
67.0%
0.0%
0.3%
2000
80.4%
36.3%
18.1%
60.8%
1.5%
2.9%
1996
77.4%
36.6%
16.0%
53.8%
6.6%
9.7%
Breakdown of population affiliated with a religious congregation
Type
Adherents
Congregations
Religion
Philadelphia
Bakersfield
Philadelphia
Bakersfield
CATHOLIC CHURCH
24.8%
29.3%
8.8%
4.9%
AMERICAN BAPTIST CHURCHES IN THE USA
3.8%
0.3%
6.7%
1.3%
MUSLIM ESTIMATE
2.6%
0.5%
3.1%
0.7%
SOUTHERN BAPTIST CONVENTION
2.2%
3.2%
9.9%
12.0%
EPISCOPAL CHURCH
0.8%
0.0%
3.8%
0.7%
EVANGELICAL LUTHERAN CHURCH IN AMERICA
0.6%
0.0%
3.1%
0.3%
PRESBYTERIAN CHURCH IN AMERICA
0.4%
0.0%
1.4%
0.2%
SEVENTH DAY ADVENTIST CHURCH
0.4%
0.6%
1.7%
2.9%
LUTHERAN CHURCH
0.0%
0.4%
0.5%
2.0%
Weather
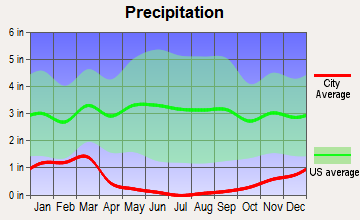
Philadelphia harbors a humid subtropical climate and experiences all four seasons. Winters can be cold and snowy, while summers can get humid and hot. On the contrary, Bakersfield enjoys a Mediterranean climate, with hot, dry summers and mild, slightly rainy winters. This contrast in weather can greatly influence individuals' preferences based on their climate adaptability and preferences.
Weather and climate
Type
Philadelphia
Bakersfield
Temperature - Average
54.8°F
64.9°F
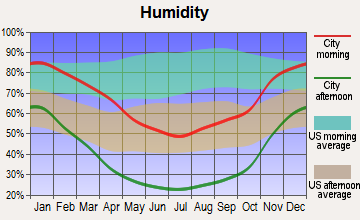
Humidity - Average morning or afternoon humidity
69.9%
53.5%
Humidity - Differences between morning and afternoon humidity
34%
59%
Humidity - Maximum monthly morning or afternoon humidity
82%
80%
Humidity - Minimum monthly morning or afternoon humidity
48%
21%
Precipitation - Yearly average
45.7 in
6.5 in
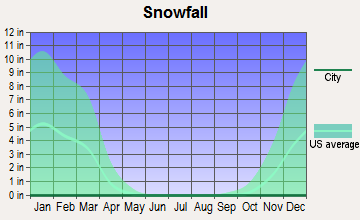
Snowfall - Yearly average
45.1 in
0 in
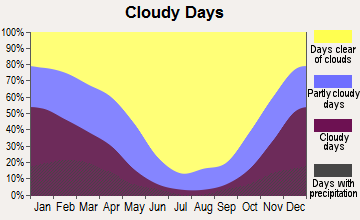
Clouds - Number of days clear of clouds
15.4%
31.8%
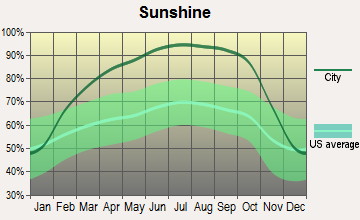
Sunshine amount - Average
59.8%
80.8%
Sunshine amount - Differences during a year
18%
31.1%
Sunshine amount - Maximum monthly
63%
89.5%
Sunshine amount - Minimum monthly
45%
58.4%
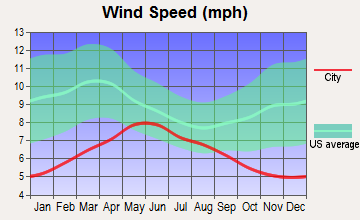
Wind speed - Average
10 mph
6.8 mph
Average climate in Philadelphia, Pennsylvania
Average climate in Bakersfield, California
Air pollution
Type
AQI
CO
NO2
OZONE
PB
PM10
PM25
SO2
Year
Philadelphia
Bakersfield
Philadelphia
Bakersfield
Philadelphia
Bakersfield
Philadelphia
Bakersfield
Philadelphia
Bakersfield
Philadelphia
Bakersfield
Philadelphia
Bakersfield
Philadelphia
2018
99
135
0.37
0.28
10.7
12.3
24.3
32.3
N/A
0.004
17.2
53.7
9.2
15.7
0.9
N/A
2017
105
141
0.32
0.29
11.0
12.7
25.3
32.9
0.004
0.004
22.3
68.2
8.9
15.8
1.0
N/A
2016
99
127
0.30
0.27
13.6
11.7
25.1
31.0
0.007
0.004
23.2
N/A
9.5
14.5
1.4
N/A
2015
110
144
0.34
0.29
15.8
11.8
22.6
32.2
0.007
0.003
23.9
N/A
10.5
16.2
1.8
N/A
2014
105
141
0.34
0.28
16.8
13.3
23.1
31.5
0.027
N/A
23.0
53.0
11.7
17.9
2.2
N/A
2013
105
134
0.27
0.30
16.7
14.3
22.5
31.0
0.029
0.003
31.0
N/A
10.5
21.7
1.5
N/A
2012
111
145
0.29
N/A
17.8
14.6
23.0
32.4
0.040
0.004
14.6
N/A
11.7
17.2
1.5
N/A
2011
113
126
0.28
N/A
19.9
15.0
24.3
29.3
0.039
0.004
16.9
43.9
9.8
17.8
1.9
N/A
2010
116
147
0.30
N/A
20.1
14.4
23.0
29.3
0.009
0.003
21.7
39.2
12.2
17.2
2.6
N/A
2009
95
170
0.32
0.37
18.9
16.6
19.7
28.0
0.011
0.005
18.0
41.5
11.9
20.8
2.9
N/A
2008
112
171
0.30
0.48
19.8
17.4
19.1
27.8
0.010
N/A
16.8
57.0
13.9
22.7
3.8
N/A
2007
128
167
0.42
0.55
21.6
18.5
23.3
26.2
0.019
0.007
17.5
43.0
12.3
23.0
4.2
N/A
2006
112
157
0.52
0.56
21.4
19.2
22.5
29.6
0.016
N/A
18.3
N/A
13.1
18.0
4.2
N/A
2005
108
165
0.58
0.53
24.4
19.3
20.8
28.2
0.018
N/A
19.7
N/A
N/A
21.5
5.0
N/A
2004
102
163
0.58
0.51
24.1
19.9
18.9
27.1
0.023
N/A
19.1
N/A
N/A
21.3
5.2
N/A
2003
103
170
0.62
0.56
23.8
21.2
19.7
29.1
0.034
N/A
19.6
N/A
N/A
24.4
5.4
N/A
2002
128
170
0.56
0.60
26.8
22.5
21.2
26.9
0.035
0.006
18.3
N/A
N/A
29.5
4.9
N/A
2001
119
150
0.63
0.73
27.9
18.2
20.0
29.6
0.014
0.006
20.6
39.6
N/A
N/A
5.6
N/A
2000
111
130
0.68
0.77
26.7
23.4
19.0
28.8
0.034
0.006
N/A
39.6
N/A
N/A
5.5
N/A
Natural disasters
Type
Philadelphia
Bakersfield
Tornado activity compared to U.S. average
96.6%
2.7%
Earthquake activity compared to U.S. average
34.4%
7,870.5%
Natural disasters compared to U.S. average
22%
29%
Transportation
In terms of public transit, Philadelphia has an edge with its extensive SEPTA system of buses, trolleys, and trains, and its walkability/bikeability score. Bakersfield's public transit is more limited but driving is common and traffic is less congested.
Transport
Type
Philadelphia
Bakersfield
Amtrak stations
2
1
Amtrak stations nearby
3
1
FAA registered aircraft
347
433
FAA registered aircraft manufacturers and dealers
2
12
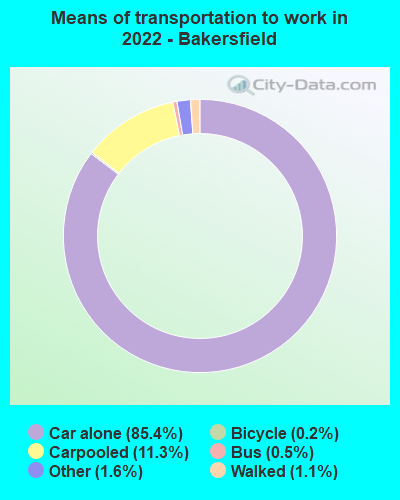
Means of transportation to work
Type
Philadelphia
Bakersfield
Bicycle
2%
0.2%
Bus
11.7%
0.3%
Carpooled
8.7%
8.7%
Car alone
60%
87.4%
Motorcycle
0.1%
0.3%
Railroad
0.7%
0%
Streetcar
4.2%
0%
Subway
2.8%
0%
Taxicab
0.2%
0.1%
Walked
7.8%
0.8%
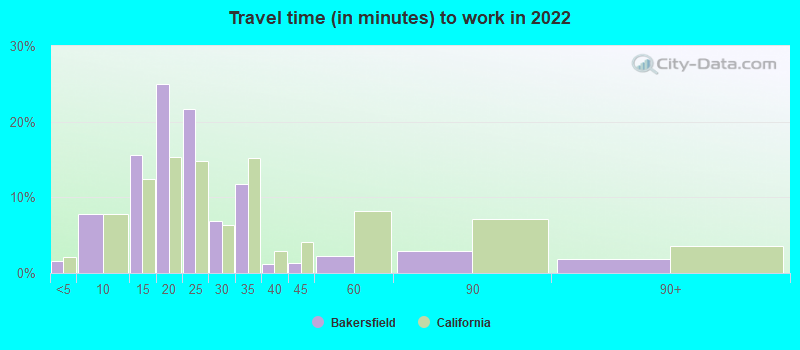
Average travel time to work
Type
Philadelphia
Bakersfield
Average
34.3 min
21.5 min
Other means
28.2 min
22.2 min
Public transportation
45.6 min
44.6 min
Private vehicle occupancy
Type
Philadelphia
Bakersfield
Average
1.2
1.2
Drove alone
86.4%
89.3%
In 2 person carpool
10.2%
6.2%
In 3 person carpool
2%
2.9%
In 4 person carpool
0.9%
1%
In 5-6 person carpool
0.3%
0.5%
In 7+ person carpool
0.2%
0.1%
How many people usually rode to work in the car, truck or van.
Real Estate
Real estate in Philadelphia is pricier, with the median home cost being higher than the national average. Bakersfield, in contrast, offers more affordable housing options, with home prices lower than the California and national averages.
Neighborhoods
Philadelphia showcases a diversity of neighborhoods, each with its own vibe, from the historic charm of Old City to the contemporary feel of Northern Liberties. Bakersfield enjoys a quieter lifestyle with neighborhoods like Seven Oaks and Rosedale offering suburban charm.
Houses and residents
Type
Philadelphia
Bakersfield
Houses
733,015
134,270
Average household size (people)
2.5
3.1
Median year apartment built
1953
1984
Median year house/condo built
1947
1994
Length of stay in the house since moving in
16 years
11.8 years
Houses occupied
660,921 (90.2%)
128,007 (95.3%)
Houses occupied by owners
348,935 (52.8%)
78,398 (61.2%)
Houses occupied by renters
311,986 (47.2%)
49,609 (38.8%)
Median rent asked for vacant for-rent units
$1,301
$1,220
Median monthly housing costs
$1,096
$1,384
Median price asked for vacant for-sale houses and condos
$260,453
$366,859
Estimated median house or condo value
$220,700
$318,600
Median numbers of rooms
5.5
5.2
Median number of rooms in apartments
4.2
4.1
Median number of rooms in houses and condos
6.2
5.9
Median house price - detached houses
$292,974
$371,576
Median house price - in 2-unit structures
$357,727
$254,175
Median house price - in 3-to-4-unit structures
$264,854
$299,855
Median house price - in 5 or more unit structures
$442,314
$221,915
Median house price - mobile homes
$163,609
$92,500
Median house price - Townhouses or other attached units
$239,791
$244,694
Median house price - All housing units
$256,324
$356,236
Median house age
73
32
Renting percentage
45.9%
40.3%
Housing density (houses/condos per square mile)
5,426.1
1,187.2
House value disparities
38.4%
29.3%
Household income disparities
49.5%
44.3%
Median household income for houses/condes with a mortgage
$86,108
$98,668
Median household income for apartments without a mortgage
$44,075
$60,298
Housing units without a mortgage
8,484 (4%)
376 (0.7%)
Housing units with both a second mortgage and home equity loan
18,029 (8.5%)
1,793 (3.1%)
Housing units with a mortgage
202,880 (96%)
56,648 (99.3%)
Housing units with a home equity loan
1,280 (0.6%)
0 (0%)
Housing units with a second mortgage
22,966 (10.9%)
2,474 (4.3%)
House/condo owner moved in on average (years ago)
15
9
House/condo renter moved in on average (years ago)
3
2
Housing units lacking complete kitchen facilities
3.7%
2.1%
Housing units lacking complete plumbing facilities
3.3%
0.2%
Housing units in structures
Housing units in structures
Philadelphia
Bakersfield
One, detached
9.9%
71.5%
One, attached
55.9%
3.9%
Two
7.4%
1.3%
3 or 4
6.7%
7.8%
5 to 9
2.8%
3.8%
10 to 19
2.5%
2.0%
20 to 49
3.1%
2.2%
50 or more
11.2%
5.1%
Mobile homes
0.3%
2.3%
Boats, RVs, vans, etc.
0.1%
0.0%
Median real estate property taxes paid for housing units
Self-employed workers in own not incorporated business
29,270
11,506
State government workers
16,901
10,997
Unpaid family workers
570
161
Industries and Occupations
Healthcare, education, and professional services are primary industries in Philadelphia, employing a large percentage of its population. Contrasted with Bakersfield, where oil and agriculture dominate, along with a significant presence of manufacturing industries.
Philadelphia is a global center for healthcare and medical research, with renowned hospitals like the Hospital of the University of Pennsylvania and Children's Hospital of Philadelphia. Alternatively, Bakersfield has several community hospitals, with notable ones being Bakersfield Memorial Hospital and Mercy Hospitals. But generally, Philadelphia offers more specialized medical services.
Philadelphia boasts an advanced infrastructure with impressive landmarks, historic sites, and skyscrapers that reflect its rich history. Bakersfield, on the other hand, showcases a blend of modern and classic Californian architecture, with infrastructure centered around agriculture and manufacturing.
Infrastructure
Type
Philadelphia
Bakersfield
Hospitals
91
18
TV stations
24
9
Arenas or stadiums
7
1
Bank branches located here
329
65
Bank institutions located here
46
19
Main business address for public companies
47
2
Drinking water stations with no reported violations in the past
1
7
Drinking water stations with reported violations in the past
HMDA - Conventional home purchase loans - Applications denied
Year
Philadelphia
Bakersfield
1999
3,294
392
2000
3,202
393
2001
2,480
297
2002
2,012
372
2003
3,268
1,104
2004
4,525
2,188
2005
6,637
3,038
2006
7,517
3,393
2007
5,750
2,036
2008
2,745
565
2009
1,390
289
Culture and Food
Philadelphia is renowned for its rich history, diverse culture, and iconic foods like Philly cheesesteak and soft pretzels. Moreover, it hosts a lively arts scene with numerous museums and theaters. In contrast, Bakersfield offers a unique blend of Mexican and American cuisine with a rich music history, specifically in country and rock music.
Sports Teams
Philadelphia hosts a range of pro sports teams including the Eagles (NFL), Phillies (MLB), Flyers (NHL), and 76ers (NBA). Bakersfield has minor league teams like the Condors (AHL) and a strong connection to Motorsports.


 Philadelphia, PA
 Bakersfield, CA