Philadelphia, PA, and Honolulu, HI, offer distinct lifestyles and amenities. With its historical roots, lively sports culture, and bustling urban life, Philadelphia presents a vibrant change of scenery. On the other hand, Honolulu offers tropical vibes, renowned beaches, and a laid-back island pace. Each city has unique attractions that cater to a wide range of tastes. This comparison delves into various factors such as crime and safety, weather, cost of living, and more.
Distance between
Philadelphia, PA and
Honolulu, HI : 4,909.9 miles
Philadelphia's population is larger by 321%. Its population has grown by 58,701 people (3.9%) since 2000. The population of Honolulu has grown by 3,044 people (0.8%) during that time.
Both cities have their safety concerns and high crime rates compared to national averages. Philadelphia's crime rate is higher than Honolulu's, largely in part due to its larger population. However, the six police districts in Philadelphia have been actively working on improving public safety. Meanwhile, Honolulu has lower violent and property crime rates than Philadelphia. Neighborhoods like Manoa and Kaimuki in Honolulu are considered very safe.
City-data.com crime index counts serious crimes and violent crime more heavily. It adjusts for the number of visitors and daily workers commuting into cities. (higher means more crime, U.S. average = 301.1)
City-data.com crime index counts serious crimes and violent crime more heavily. It adjusts for the number of visitors and daily workers commuting into cities. (higher means more crime, U.S. average = 301.1)
Sex Offenders
According to our data, there are 2,776 registered sex offenders living in Philadelphia and 680 registered sex offenders living in . The ratio of residents to sex offenders in Philadelphia is 565 to 1; the ratio in Honolulu is 551 to 1. The number of registered sex offenders compared to the number of residents in Philadelphia is near to than in Honolulu.
Cost of Living
Living in Honolulu is generally more expensive than Philadelphia. This is particularly noticeable in housing costs. Gas, groceries, and utilities also tend to be pricier in Honolulu due to the cost of importing goods. Philadelphia, being on the mainland, has lower living costs, and it is possible to find affordable housing in the city and its surrounding suburbs.
Income Tax
Pennsylvania has a flat state income tax rate of 3.07%, while the city of Philadelphia imposes an additional wage tax. In contrast, Hawaii has graduated state income tax rates ranging from 1.4% to 11%.
Property Tax
Property tax rates differ significantly between the two cities. Honolulu has one of the lowest property tax rates in the nation, while Philadelphia's property tax rates are considerably higher. However, real estate prices in Honolulu are also significantly higher.
Sales Tax
Sales tax in Philadelphia is higher, with a rate of 8% compared to Honolulu's 4.5%. However, Honolulu levies a General Excise Tax on businesses, indirectly impacting the cost of goods and services.
Income
Type
Philadelphia
Honolulu
Estimated median household income
$52,899
$78,820
Estimated per capita income
$32,707
$43,518
Cost of living index (U.S. average is 100)
105.4
158.6
If you make $50,000 in Philadelphia, you will have to make $75,237 in Honolulu to maintain the same standard of living.
Geographical Conditions
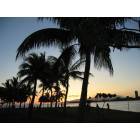
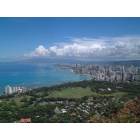
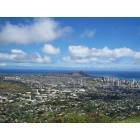
Philadelphia is a landlocked city with a blend of urban and suburban landscapes, while Honolulu is a scenic coastal city in the tropics with beautiful beaches, mountains, and palm trees. Philadelphia's Schuylkill River and Delaware River add to its landscape. Honolulu is surrounded by the Pacific Ocean, offering stunning vistas and opportunities for water sports.
Both cities offer diverse educational opportunities. Philadelphia is home to several renowned higher education institutions, such as the University of Pennsylvania and Temple University. Meanwhile, Honolulu houses the University of Hawaii system. For K-12 education, Philadelphia has a mix of public, charter, and private schools. Honolulu also offers both public and private schools, with improved literacy and graduation rates in recent years.
Philadelphia's economy is diverse, with thriving sectors like healthcare, education, and tourism. On the other hand, Honolulu's economy relies heavily on tourism. However, it also has growing sectors in healthcare, construction, and government. The median household income is higher in Honolulu than in Philadelphia.
Biggest Employers
Philadelphia's largest employers are in the healthcare and education sectors, with the University of Pennsylvania Health System and the University of Pennsylvania leading. Meanwhile, the top employers in Honolulu include the State of Hawaii, Hawaiian Airlines, and the University of Hawaii.
In Philadelphia (Philadelphia County), 85.2% voted for Democrats and 14.0% for Republicans in 2012 Presidential Election. In Honolulu (Honolulu County), 68.9% voted for Democrats and 29.8% for Republicans.
Elections
Type
Democrats
Republicans
Other
Year
Philadelphia
Honolulu
Philadelphia
Honolulu
Philadelphia
Honolulu
2020
81.2%
62.7%
17.9%
35.8%
0.9%
1.5%
2016
82.3%
61.5%
15.3%
31.6%
2.4%
6.9%
2012
85.2%
68.9%
14.0%
29.8%
0.8%
1.3%
2008
83.2%
70.1%
16.4%
28.8%
0.4%
1.1%
2004
80.6%
51.1%
19.4%
48.3%
0.0%
0.6%
2000
80.4%
54.6%
18.1%
39.6%
1.5%
5.7%
1996
77.4%
56.3%
16.0%
33.6%
6.6%
10.1%
Breakdown of population affiliated with a religious congregation
Type
Adherents
Congregations
Religion
Philadelphia
Honolulu
Philadelphia
Honolulu
CATHOLIC CHURCH
24.8%
18.2%
8.8%
5.2%
AMERICAN BAPTIST CHURCHES IN THE USA
3.8%
0.1%
6.7%
0.4%
MUSLIM ESTIMATE
2.6%
0.0%
3.1%
0.1%
SOUTHERN BAPTIST CONVENTION
2.2%
1.5%
9.9%
9.7%
EPISCOPAL CHURCH
0.8%
0.5%
3.8%
2.7%
EVANGELICAL LUTHERAN CHURCH IN AMERICA
0.6%
0.2%
3.1%
1.1%
PRESBYTERIAN CHURCH IN AMERICA
0.4%
0.0%
1.4%
0.4%
SEVENTH DAY ADVENTIST CHURCH
0.4%
0.5%
1.7%
2.6%
Weather
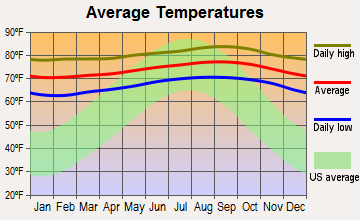
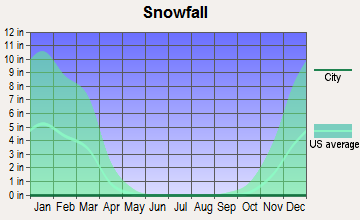
Philadelphia experiences the full range of four seasons, complete with hot summers, cold winters, and diverse fall and spring climates. Winters can be harsh with occasional snowfall. Conversely, Honolulu has a tropical climate, with warm temperatures all year round and two main seasons: the dry season (April to October) and the rainy season (November to March).
Weather and climate
Type
Philadelphia
Honolulu
Temperature - Average
54.8°F
73.9°F
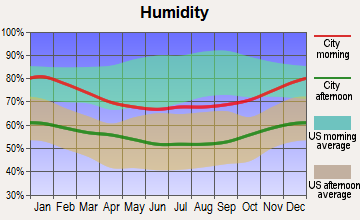
Humidity - Average morning or afternoon humidity
69.9%
70.5%
Humidity - Differences between morning and afternoon humidity
34%
27%
Humidity - Maximum monthly morning or afternoon humidity
82%
79%
Humidity - Minimum monthly morning or afternoon humidity
48%
52%
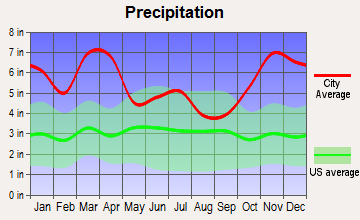
Precipitation - Yearly average
45.7 in
66.2 in
Snowfall - Yearly average
45.1 in
0 in
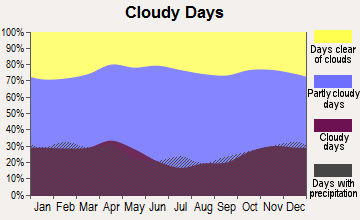
Clouds - Number of days clear of clouds
15.4%
14.9%
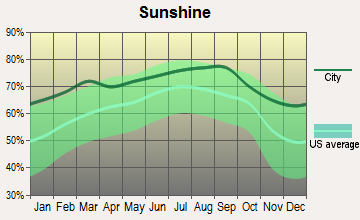
Sunshine amount - Average
59.8%
71%
Sunshine amount - Differences during a year
18%
19%
Sunshine amount - Maximum monthly
63%
75%
Sunshine amount - Minimum monthly
45%
56%
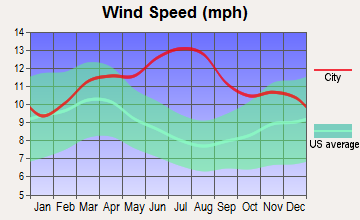
Wind speed - Average
10 mph
11.1 mph
Average climate in Philadelphia, Pennsylvania
Average climate in Honolulu, Hawaii
Air pollution
Type
AQI
CO
NO2
OZONE
PB
PM10
PM25
SO2
Year
Philadelphia
Honolulu
Philadelphia
Honolulu
Philadelphia
Honolulu
Philadelphia
Honolulu
Philadelphia
Honolulu
Philadelphia
Honolulu
Philadelphia
Honolulu
Philadelphia
Honolulu
2018
99
43
0.37
0.45
10.7
3.9
24.3
25.8
N/A
N/A
17.2
12.7
9.2
3.8
0.9
0.1
2017
105
46
0.32
0.50
11.0
4.4
25.3
24.8
0.004
N/A
22.3
11.7
8.9
3.4
1.0
0.4
2016
99
46
0.30
0.59
13.6
3.9
25.1
24.8
0.007
N/A
23.2
13.5
9.5
3.5
1.4
0.3
2015
110
53
0.34
0.54
15.8
3.5
22.6
24.0
0.007
N/A
23.9
11.4
10.5
4.8
1.8
0.4
2014
105
45
0.34
0.41
16.8
3.4
23.1
21.6
0.027
N/A
23.0
13.1
11.7
4.6
2.2
1.2
2013
105
53
0.27
0.41
16.7
3.0
22.5
26.4
0.029
N/A
31.0
11.8
10.5
5.8
1.5
1.1
2012
111
58
0.29
0.31
17.8
2.9
23.0
24.7
0.040
N/A
14.6
12.2
11.7
5.7
1.5
0.6
2011
113
57
0.28
0.39
19.9
2.9
24.3
28.4
0.039
N/A
16.9
12.7
9.8
7.0
1.9
0.6
2010
116
68
0.30
0.38
20.1
3.4
23.0
N/A
0.009
0.002
21.7
N/A
12.2
7.0
2.6
1.1
2009
95
58
0.32
0.42
18.9
4.3
19.7
N/A
0.011
0.003
18.0
N/A
11.9
6.2
2.9
0.7
2008
112
19
0.30
0.45
19.8
4.2
19.1
N/A
0.010
0.002
16.8
N/A
13.9
N/A
3.8
0.6
2007
128
23
0.42
0.52
21.6
4.7
23.3
N/A
0.019
0.001
17.5
N/A
12.3
N/A
4.2
0.5
2006
112
21
0.52
0.24
21.4
4.9
22.5
N/A
0.016
0.003
18.3
N/A
13.1
N/A
4.2
1.0
2005
108
19
0.58
0.42
24.4
5.0
20.8
N/A
0.018
0.001
19.7
N/A
N/A
N/A
5.0
0.7
2004
102
18
0.58
0.60
24.1
4.8
18.9
N/A
0.023
0.001
19.1
N/A
N/A
N/A
5.2
0.5
2003
103
21
0.62
0.62
23.8
4.7
19.7
N/A
0.034
0.002
19.6
N/A
N/A
N/A
5.4
0.5
2002
128
19
0.56
0.64
26.8
4.9
21.2
N/A
0.035
N/A
18.3
N/A
N/A
N/A
4.9
0.9
2001
119
21
0.63
0.62
27.9
4.5
20.0
N/A
0.014
N/A
20.6
N/A
N/A
N/A
5.6
0.6
2000
111
21
0.68
0.68
26.7
4.9
19.0
N/A
0.034
N/A
N/A
N/A
N/A
N/A
5.5
0.4
Natural disasters
Type
Philadelphia
Honolulu
Tornado activity compared to U.S. average
96.6%
3.7%
Earthquake activity compared to U.S. average
34.4%
1,260.2%
Natural disasters compared to U.S. average
22%
16%
Transportation
Both cities have comprehensive public transportation systems. Philadelphia's SEPTA system provides bus, subway, and trolley services, while TheBus in Honolulu handles much of the public transit. Traffic congestion can be an issue in both cities, but Philadelphia ranks better for commute times.
Transport
Type
Philadelphia
Honolulu
Amtrak stations
2
0
Amtrak stations nearby
3
0
FAA registered aircraft
347
343
FAA registered aircraft manufacturers and dealers
2
7
Means of transportation to work
Type
Philadelphia
Honolulu
Bicycle
2%
1.2%
Bus
11.7%
11.3%
Carpooled
8.7%
18.1%
Car alone
60%
57.7%
Motorcycle
0.1%
0.9%
Railroad
0.7%
0%
Streetcar
4.2%
0%
Subway
2.8%
0%
Taxicab
0.2%
0.3%
Walked
7.8%
6.6%
Average travel time to work
Type
Philadelphia
Honolulu
Average
34.3 min
24 min
Real Estate
The real estate market in Honolulu is more expensive than in Philadelphia. Median home prices in Honolulu are much higher than in Philadelphia. For renters, apartments in Honolulu are considerably more expensive. However, Philadelphia's real estate market is dynamic, with prices varying according to neighborhood.
Neighborhoods
Philadelphia is known for its diverse neighborhoods, from the historic Old City to the vibrant Fishtown. Each neighborhood has its unique charm and characteristics. Honolulu, on the other hand, offers neighborhoods with a tropical ambiance such as Waikiki, famous for its beach, or Manoa, known for its historic homes.
Houses and residents
Type
Philadelphia
Honolulu
Houses
733,015
158,659
Average household size (people)
2.5
2.6
Houses occupied
660,921 (90.2%)
140,328 (88.4%)
Houses occupied by owners
348,935 (52.8%)
65,860 (46.9%)
Houses occupied by renters
311,986 (47.2%)
74,468 (53.1%)
Median rent asked for vacant for-rent units
$1,301
$1,820
Median price asked for vacant for-sale houses and condos
$260,453
$674,769
Estimated median house or condo value
$220,700
$903,138
Median number of rooms in apartments
4.2
2.7
Median number of rooms in houses and condos
6.2
4.4
Housing density (houses/condos per square mile)
5,426.1
1,851.3
Household income disparities
49.5%
44.4%
Housing units without a mortgage
8,484 (4%)
16,363 (40.7%)
Housing units with both a second mortgage and home equity loan
18,029 (8.5%)
182 (0.5%)
Housing units with a mortgage
202,880 (96%)
23,799 (59.3%)
Housing units with a home equity loan
1,280 (0.6%)
4,350 (10.8%)
Housing units with a second mortgage
22,966 (10.9%)
2,936 (7.3%)
Housing units lacking complete kitchen facilities
3.7%
1.9%
Housing units lacking complete plumbing facilities
Self-employed workers in own not incorporated business
29,270
12,632
State government workers
16,901
19,181
Unpaid family workers
570
657
Industries and Occupations
Philadelphia has a diverse range of industries including healthcare, finance, and education. In contrast, Honolulu's economy greatly relies on the hospitality and tourism industry, aside from government services and construction. As for occupations, healthcare workers, educators, and professionals in business and finance are prevalent in Philadelphia. In Honolulu, jobs are tourism-related such as hotel receptionists, tour guides, and restaurant workers.
Philadelphia is a leading healthcare hub with numerous first-class hospitals like the Hospital of the University of Pennsylvania and Jefferson Hospital. Honolulu also offers quality healthcare with notable establishments like the Queen's Medical Center. Both cities present solid healthcare options, albeit with different strengths and specializations.
Health (county statistics)
Type
Philadelphia
Honolulu
General health status score of residents in this county from 1 (poor) to 5 (excellent)
Philadelphia enjoys solid infrastructure, with various city services and public facilities. However, it struggles with aging utilities and roads. Honolulu, being an island city, has more unique challenges including being on a volcanic land, limited land space, and susceptibility to natural hazards. It does, however, boast of good water and sewer systems, and has ongoing projects to improve road conditions and connectivity.
Infrastructure
Type
Philadelphia
Honolulu
Hospitals
91
11
TV stations
24
13
Arenas or stadiums
7
4
Bank branches located here
329
111
Bank institutions located here
46
11
Main business address for public companies
47
9
Drinking water stations with no reported violations in the past
1
12
Drinking water stations with reported violations in the past
HMDA - Conventional home purchase loans - Applications denied
Year
Philadelphia
Honolulu
1999
3,294
374
2000
3,202
310
2001
2,480
233
2002
2,012
350
2003
3,268
482
2004
4,525
776
2005
6,637
1,165
2006
7,517
1,176
2007
5,750
686
2008
2,745
469
2009
1,390
258
Culture and Food
Philadelphia is rich in American history and culture, evident in attractions like the Liberty Bell and Independence Hall. The city is renowned for its food scene, especially the Philadelphia cheesesteak. Honolulu, on the other hand, offers a blend of cultures. Its food scene manifests this mix, with dishes like poke bowls and loco moco. Both cities boast rich cultural diversity and culinary experiences.
Sports Teams
Philadelphia is a sports-loving city, supporting teams like the Eagles (NFL), the 76ers (NBA), and the Phillies (MLB). Philadelphia sports fans are highly enthusiastic. Conversely, Honolulu doesn't have any major league teams. However, locals passionately support the University of Hawaii's sports teams, particularly football.


 Philadelphia, PA
 Honolulu, HI