For those considering a move or a visit to either Philadelphia, PA, or the North Coast, CA, this guide provides vital information about various aspects of these locales. Each city offers a unique mix of culture, economy, and lifestyle that shapes the living and visitor experience. Key factors under review include crime/safety, weather, cost of living, education, work and economy, infrastructure, industries and occupations, biggest employers, real estate, neighborhoods, transportation, tax rates, culture/food, sports teams, geographical conditions, and health care.
While both cities take significant strides to ensure residents' and visitors' safety, crime rates in Philadelphia are somewhat higher than California's North Coast. Philadelphia is working on decreasing both violent and property crime rates, and it is generally safe in most neighborhoods, especially during the day. On the other hand, the North Coast boasts lower crime rates, making this area safer in general.
Cost of Living
The cost of living in Philadelphia is generally lower compared to the North Coast. Despite being one of the largest cities in the U.S., housing, food, and transportation are more inexpensive in Philadelphia. In contrast, living on California's North Coast tends to be costlier, especially concerning housing.
Income Tax
Pennsylvania has a relatively low flat personal income tax rate of 3.07%. In contrast, California has a progressive state income tax system that ranges from 1% to 13.3%.
Property Tax
Philadelphia has one of the highest property tax rates in Pennsylvania, but Californian homeowners often face high property taxes due to high home values along the North Coast. California uses a system that restricts annual increases of assessed value of real property to an inflation factor, not to exceed 2% per year.
Sales Tax
Pennsylvania's sales tax is 6% statewide, with an additional 2% in Philadelphia. Meanwhile, California has a base state sales tax of 7.25%, plus local district taxes that can bring the total sales tax rate up to 10.25%.
Income
Type
Philadelphia
North Coast
Estimated median household income
$52,899
$102,807
Estimated per capita income
$32,707
$50,809
Cost of living index (U.S. average is 100)
105.4
96.1
If you make $50,000 in North Coast, you will have to make $54,839 in Philadelphia to maintain the same standard of living.
Geographical Conditions
Philadelphia, a city built on flat coastal plains, presents urban architecture with historical landmarks. The North Coast however, highlights a blend of stunning cliffs, beautiful beaches, expansive vineyards, and Redwood forests, offering breathtaking natural beauty.
Geographical information
Type
Philadelphia
North Coast
Land area
135.1 sq. miles
59.4 sq. miles
Population density
11,668 people per sq. mile
6,335.5 people per sq. mile
Relative area comparison
Philadelphia, PA North Coast, CA
Education
Philadelphia is home to prestigious universities like the University of Pennsylvania and Temple University, providing robust higher education opportunities. Meanwhile, the North Coast of California, while not having many high-ranking universities, does offer great community colleges and vocational programs that keep educational opportunities diverse and affordable.
Philadelphia's economy is characterized by dominant sectors such as education, health care, and financial services. Conversely, the North Coast's economy is largely driven by sectors such as agriculture, particularly wine production, tourism, and increasingly technology and sustainability ventures, offering a unique array of job opportunities.
Biggest Employers
In Philadelphia, the largest employers are the Federal and City Government, University of Pennsylvania, and Comcast. Meanwhile, on the North Coast, top employers include county governments, hospitals, wineries, and tech companies.
In Philadelphia (Philadelphia County), 85.2% voted for Democrats and 14.0% for Republicans in 2012 Presidential Election. In North Coast (Orange County), 45.8% voted for Democrats and 52.0% for Republicans.
Elections
Type
Democrats
Republicans
Other
Year
Philadelphia
North Coast
Philadelphia
North Coast
Philadelphia
North Coast
2020
81.2%
53.6%
17.9%
44.6%
0.9%
1.8%
2016
82.3%
50.9%
15.3%
42.4%
2.4%
6.7%
2012
85.2%
45.8%
14.0%
52.0%
0.8%
2.3%
2008
83.2%
47.8%
16.4%
50.3%
0.4%
1.9%
2004
80.6%
39.3%
19.4%
60.2%
0.0%
0.5%
2000
80.4%
40.4%
18.1%
55.9%
1.5%
3.7%
1996
77.4%
37.9%
16.0%
51.7%
6.6%
10.5%
Breakdown of population affiliated with a religious congregation
Type
Adherents
Congregations
Religion
Philadelphia
North Coast
Philadelphia
North Coast
CATHOLIC CHURCH
24.8%
26.5%
8.8%
4.4%
AMERICAN BAPTIST CHURCHES IN THE USA
3.8%
0.2%
6.7%
1.7%
MUSLIM ESTIMATE
2.6%
0.8%
3.1%
1.3%
SOUTHERN BAPTIST CONVENTION
2.2%
2.3%
9.9%
8.8%
EPISCOPAL CHURCH
0.8%
0.4%
3.8%
1.4%
EVANGELICAL LUTHERAN CHURCH IN AMERICA
0.6%
0.4%
3.1%
2.3%
PRESBYTERIAN CHURCH IN AMERICA
0.4%
0.1%
1.4%
0.9%
SEVENTH DAY ADVENTIST CHURCH
0.4%
0.4%
1.7%
1.3%
LUTHERAN CHURCH
0.0%
0.6%
0.5%
2.0%
REFORMED CHURCH IN AMERICA
0.0%
0.3%
0.0%
0.2%
Weather
Weather-wise, Philadelphia has a more diverse climate, experiencing four distinct seasons, including cold winters and hot, humid summers. It's great for those who appreciate seasonal changes. Meanwhile, the North Coast of California offers a Mediterranean climate with cool, wet winters and warm, dry summers. This kind of weather is perfect for those who enjoy mild temperate conditions year-round.
Weather and climate
Type
Philadelphia
North Coast
Temperature - Average
54.8°F
64.4°F
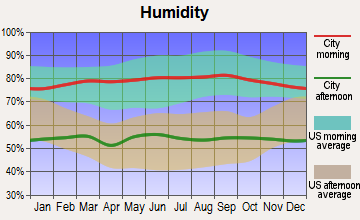
Humidity - Average morning or afternoon humidity
69.9%
70.2%
Humidity - Differences between morning and afternoon humidity
34%
26.7%
Humidity - Maximum monthly morning or afternoon humidity
82%
78.7%
Humidity - Minimum monthly morning or afternoon humidity
48%
52%
Precipitation - Yearly average
45.7 in
13 in
Snowfall - Yearly average
45.1 in
0 in
Clouds - Number of days clear of clouds
15.4%
26.5%
Sunshine amount - Average
59.8%
78.4%
Sunshine amount - Differences during a year
18%
21.9%
Sunshine amount - Maximum monthly
63%
84.9%
Sunshine amount - Minimum monthly
45%
62.9%
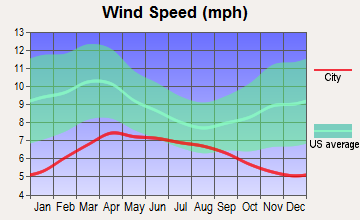
Wind speed - Average
10 mph
6 mph
Average climate in Philadelphia, Pennsylvania
Average climate in North Coast, California
Air pollution
Type
AQI
CO
NO2
OZONE
PB
PM10
PM25
SO2
Year
Philadelphia
North Coast
Philadelphia
North Coast
Philadelphia
North Coast
Philadelphia
North Coast
Philadelphia
North Coast
Philadelphia
North Coast
Philadelphia
North Coast
Philadelphia
North Coast
2018
99
119
0.37
0.35
10.7
14.4
24.3
26.1
N/A
N/A
17.2
27.5
9.2
12.6
0.9
0.7
2017
105
116
0.32
0.34
11.0
13.8
25.3
28.8
0.004
N/A
22.3
26.7
8.9
13.8
1.0
0.5
2016
99
102
0.30
0.33
13.6
12.2
25.1
29.3
0.007
N/A
23.2
24.1
9.5
12.5
1.4
0.2
2015
110
106
0.34
0.32
15.8
13.2
22.6
29.8
0.007
N/A
23.9
25.0
10.5
14.5
1.8
0.2
2014
105
110
0.34
0.29
16.8
12.9
23.1
28.6
0.027
N/A
23.0
26.7
11.7
15.5
2.2
0.4
2013
105
107
0.27
0.34
16.7
13.9
22.5
27.8
0.029
0.003
31.0
29.5
10.5
14.2
1.5
0.3
2012
111
103
0.29
0.30
17.8
12.7
23.0
26.8
0.040
0.004
14.6
28.2
11.7
14.3
1.5
0.1
2011
113
109
0.28
0.31
19.9
14.7
24.3
27.0
0.039
0.006
16.9
27.7
9.8
15.9
1.9
0.7
2010
116
102
0.30
0.33
20.1
14.3
23.0
26.2
0.009
0.011
21.7
23.6
12.2
14.0
2.6
0.6
2009
95
118
0.32
0.35
18.9
15.5
19.7
27.6
0.011
0.009
18.0
24.3
11.9
14.5
2.9
1.1
2008
112
124
0.30
0.39
19.8
16.5
19.1
28.2
0.010
0.010
16.8
29.5
13.9
21.6
3.8
1.1
2007
128
100
0.42
0.36
21.6
16.3
23.3
27.0
0.019
0.012
17.5
N/A
12.3
N/A
4.2
0.8
2006
112
114
0.52
0.40
21.4
17.2
22.5
26.4
0.016
0.007
18.3
N/A
13.1
N/A
4.2
1.3
2005
108
95
0.58
0.39
24.4
17.7
20.8
27.9
0.018
0.012
19.7
N/A
N/A
N/A
5.0
1.3
2004
102
119
0.58
0.50
24.1
19.2
18.9
30.5
0.023
0.014
19.1
N/A
N/A
N/A
5.2
1.6
2003
103
122
0.62
0.64
23.8
21.9
19.7
28.9
0.034
0.030
19.6
N/A
N/A
N/A
5.4
1.1
2002
128
106
0.56
0.65
26.8
22.0
21.2
25.5
0.035
0.018
18.3
N/A
N/A
N/A
4.9
1.8
2001
119
116
0.63
0.73
27.9
22.0
20.0
25.4
0.014
0.033
20.6
N/A
N/A
N/A
5.6
1.5
2000
111
125
0.68
0.80
26.7
24.4
19.0
24.0
0.034
0.027
N/A
N/A
N/A
N/A
5.5
1.9
Natural disasters
Type
Philadelphia
North Coast
Tornado activity compared to U.S. average
96.6%
18.6%
Earthquake activity compared to U.S. average
34.4%
6,843.6%
Natural disasters compared to U.S. average
22%
32%
Transportation
Philadelphia has a well-developed public transit system, including buses, subways, and trolleys, which makes commuting easier. On the North Coast, transportation options are more limited, and residents often rely on cars for commuting. It is also more common for locals to bike or walk, depending on the area.
Transport
Type
Philadelphia
North Coast
Amtrak stations
2
0
Amtrak stations nearby
3
3
FAA registered aircraft
347
0
FAA registered aircraft manufacturers and dealers
2
0
Means of transportation to work
Type
Philadelphia
North Coast
Bicycle
2%
0.7%
Bus
11.7%
1.2%
Carpooled
8.7%
10.7%
Car alone
60%
81.4%
Motorcycle
0.1%
0.2%
Railroad
0.7%
0%
Streetcar
4.2%
0%
Subway
2.8%
0%
Taxicab
0.2%
0%
Walked
7.8%
1.4%
Average travel time to work
Type
Philadelphia
North Coast
Average
34.3 min
28.8 min
Real Estate
The real estate market in Philadelphia provides more affordability with a variety of housing options. The North Coast, on the other hand, is known for its high-end real estate market, particularly near the Pacific Coastline.
Neighborhoods
For both residents and visitors, Philadelphia offers diverse neighborhoods, from artsy Fishtown and Northern Liberties to historic Old City and Center City. The North Coast of California features smaller communities with scenic views like Bodega Bay, Fort Bragg, and many wine-country towns.
Houses and residents
Type
Philadelphia
North Coast
Houses
733,015
137,450
Average household size (people)
2.5
2.7
Houses occupied
660,921 (90.2%)
133,254 (96.9%)
Houses occupied by owners
348,935 (52.8%)
84,546 (63.4%)
Houses occupied by renters
311,986 (47.2%)
48,708 (36.6%)
Median rent asked for vacant for-rent units
$1,301
$2,340
Median price asked for vacant for-sale houses and condos
$260,453
$1,099,558
Estimated median house or condo value
$220,700
$883,291
Median number of rooms in apartments
4.2
3.9
Median number of rooms in houses and condos
6.2
6.1
Renting percentage
45.9%
37.7%
Housing density (houses/condos per square mile)
5,426.1
2,312.7
Household income disparities
49.5%
41.2%
Housing units without a mortgage
8,484 (4%)
13,396 (19.5%)
Housing units with both a second mortgage and home equity loan
18,029 (8.5%)
282 (0.4%)
Housing units with a mortgage
202,880 (96%)
55,188 (80.5%)
Housing units with a home equity loan
1,280 (0.6%)
6,297 (9.2%)
Housing units with a second mortgage
22,966 (10.9%)
7,643 (11.1%)
Housing units lacking complete kitchen facilities
3.7%
1%
Housing units lacking complete plumbing facilities
Self-employed workers in own not incorporated business
29,270
15,532
State government workers
16,901
5,751
Unpaid family workers
570
744
Industries and Occupations
In Philadelphia, some of the predominant industries are health, education, and finance with a wide range of professional opportunities in these fields. On the North Coast, the primary industries are agriculture, wine production, tourism, technology, and sustainability initiatives, offering more opportunities for a career tethered to the environment and local resources.
Philadelphia offers world-class healthcare services with renowned hospitals like University of Pennsylvania Hospital and Children's Hospital of Philadelphia. On the other hand, while the North Coast does have good healthcare facilities, they may not be as extensive as in bigger cities due to the less concentrated population.
Health (county statistics)
Type
Philadelphia
North Coast
General health status score of residents in this county from 1 (poor) to 5 (excellent)
Philadelphia boasts a robust infrastructure with a mature public transit system and numerous parks. On the other hand, the North Coast's infrastructure is more back-to-nature, with emphasis on natural landmarks and coastline. The latter, however, lacks extensive public transportation services.
Infrastructure
Type
Philadelphia
North Coast
TV stations
24
2
Culture and Food
Philadelphia is known for its rich history, diverse arts scene, and authentic cuisine, including the famous cheesesteak. In contrast, the North Coast is known for its vineyards and high-end culinary experiences, as well as majestic Redwood forests and a vibrant arts community.
Sports Teams
Sports enthusiasts will find a variety in Philadelphia, which boasts teams in all major sports leagues - the Eagles (NFL), Phillies (MLB), Flyers (NHL), 76ers (NBA), and the Union (MLS). While North Coast isn't home to any major sports teams, residents are typically fans of teams from nearby cities, such as the San Francisco 49ers and the Giants.
 Philadelphia, PA
 North Coast, CA