As two populous cities on opposite coasts, Philadelphia, Pennsylvania and Riverside, California, present unique living experiences. Their respective urban designs, economies, climates, and cultures reflect distinct regional characteristics. Whether one prefers the historical charm of Philadelphia with its robust sports culture or the warm, sunny climate of Riverside with ample open spaces, understanding their differences would offer valuable insights to both potential residents and tourists.
Distance between
Philadelphia, PA and
Riverside, CA : 2,347.0 miles
Philadelphia's population is larger by 397%. Its population has grown by 58,701 people (3.9%) since 2000. The population of Riverside has grown by 62,095 people (24.3%) during that time.
Crime rates require serious consideration for those relocating or visiting. Philadelphia struggles with higher violent crime rates compared to the national average, but its densely populated neighborhoods and 24/7 lively city life are generally safer. In contrast, Riverside has a lower crime rate than the national average, making it relatively safer. Both cities have well-established law enforcement systems.
City-data.com crime index counts serious crimes and violent crime more heavily. It adjusts for the number of visitors and daily workers commuting into cities. (higher means more crime, U.S. average = 301.1)
City-data.com crime index counts serious crimes and violent crime more heavily. It adjusts for the number of visitors and daily workers commuting into cities. (higher means more crime, U.S. average = 301.1)
Sex Offenders
According to our data, there are 2,776 registered sex offenders living in Philadelphia and 616 registered sex offenders living in . The ratio of residents to sex offenders in Philadelphia is 565 to 1; the ratio in Riverside is 527 to 1. The number of registered sex offenders compared to the number of residents in Philadelphia is near to than in Riverside.
Cost of Living
Living costs differ too. Philadelphia, although one of the more affordable large cities on the East Coast, still has a higher cost of living compared to Riverside, largely driven by housing prices. Riverside, despite being in California, tends to be cheaper than many of the state’s coastal cities.
Income Tax
Unlike Riverside, Philadelphia imposes a city wage tax on residents and nonresidents who work within city limits. Pennsylvania's state income tax is quite flat, at 3.07%, whereas California's progressive income tax goes up to 13.3%.
Property Tax
Philadelphia’s property tax rates are higher compared to Riverside’s. However, the overall tax bills often can be lower due to less expensive home prices in Philadelphia.
Sales Tax
Philadelphia’s city/state sales tax is 6%, while Riverside's state sales tax is much higher, at 7.75% – reflecting California's overall high taxation levels.
Income
Type
Philadelphia
Riverside
Estimated median household income
$52,899
$76,558
Estimated per capita income
$32,707
$29,013
Cost of living index (U.S. average is 100)
105.4
83
If you make $50,000 in Riverside, you will have to make $63,494 in Philadelphia to maintain the same standard of living.
Geographical Conditions
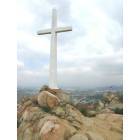
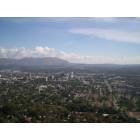
Philadelphia is on the East Coast, offering access to the Atlantic Ocean and close proximity to major cities. Riverside is located inland Southern California but within reach of coastal attractions, mountain ranges like San Bernardino, and deserts.
Both cities possess strong education systems. Philadelphia has top-ranked universities like the University of Pennsylvania and Temple University, and it offers a wide public-school network. Riverside is home to prestigious institutions like the University of California, Riverside, contributing to a well-educated workforce.
Philadelphia's economy is diversified, focusing on sectors such as healthcare, higher education, and food processing, while Riverside’s economy is heavily interconnected with larger Los Angeles and features sectors like manufacturing, education, and healthcare. Both cities offer numerous job opportunities, but the median household income in Philadelphia is notably higher.
Biggest Employers
Philadelphia's largest employers are University of Pennsylvania and its health system, providing numerous education and healthcare jobs. In Riverside, the county government and UC Riverside are the top employers,
There were 1,553 building permits issued in Philadelphia in 2012 (1108 more than in 2011) compared to 293 building permits issued in Riverside in 2012 (250 more than in 2011).
In Philadelphia (Philadelphia County), 85.2% voted for Democrats and 14.0% for Republicans in 2012 Presidential Election. In Riverside (Riverside County), 49.6% voted for Democrats and 48.0% for Republicans.
Elections
Type
Democrats
Republicans
Other
Year
Philadelphia
Riverside
Philadelphia
Riverside
Philadelphia
Riverside
2020
81.2%
53.0%
17.9%
45.0%
0.9%
2.0%
2016
82.3%
49.7%
15.3%
44.4%
2.4%
5.9%
2012
85.2%
49.6%
14.0%
48.0%
0.8%
2.4%
2008
83.2%
50.4%
16.4%
48.1%
0.4%
1.5%
2004
80.6%
41.3%
19.4%
58.2%
0.0%
0.6%
2000
80.4%
45.0%
18.1%
51.6%
1.5%
3.4%
1996
77.4%
43.0%
16.0%
45.6%
6.6%
11.3%
Breakdown of population affiliated with a religious congregation
Type
Adherents
Congregations
Religion
Philadelphia
Riverside
Philadelphia
Riverside
CATHOLIC CHURCH
24.8%
27.5%
8.8%
4.5%
AMERICAN BAPTIST CHURCHES IN THE USA
3.8%
0.0%
6.7%
0.7%
MUSLIM ESTIMATE
2.6%
0.5%
3.1%
0.7%
SOUTHERN BAPTIST CONVENTION
2.2%
1.2%
9.9%
11.2%
EPISCOPAL CHURCH
0.8%
0.2%
3.8%
1.4%
EVANGELICAL LUTHERAN CHURCH IN AMERICA
0.6%
0.3%
3.1%
1.5%
PRESBYTERIAN CHURCH IN AMERICA
0.4%
0.0%
1.4%
0.2%
SEVENTH DAY ADVENTIST CHURCH
0.4%
0.9%
1.7%
3.4%
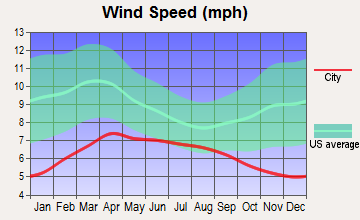
Weather
Weather differences between Philadelphia and Riverside are marked. Philadelphia experiences four seasons with hot, humid summers and cold, snowy winters, ideal for those enjoy seasonal changes. Conversely, Riverside, located in Southern California, offers a warm-summer Mediterranean climate, with hot, dry summers and mild, wet winters.
Weather and climate
Type
Philadelphia
Riverside
Temperature - Average
54.8°F
66°F
Humidity - Average morning or afternoon humidity
69.9%
66.7%
Humidity - Differences between morning and afternoon humidity
34%
21.4%
Humidity - Maximum monthly morning or afternoon humidity
82%
73.5%
Humidity - Minimum monthly morning or afternoon humidity
48%
52.1%
Precipitation - Yearly average
45.7 in
10.3 in
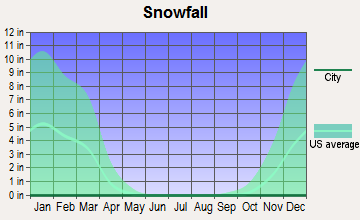
Snowfall - Yearly average
45.1 in
0 in
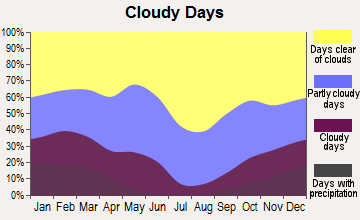
Clouds - Number of days clear of clouds
15.4%
27.3%
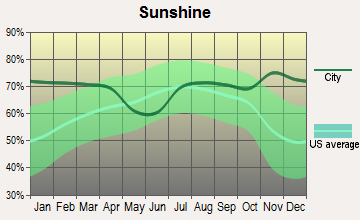
Sunshine amount - Average
59.8%
78.2%
Sunshine amount - Differences during a year
18%
21.5%
Sunshine amount - Maximum monthly
63%
84.2%
Sunshine amount - Minimum monthly
45%
62.6%
Wind speed - Average
10 mph
4.5 mph
Average climate in Philadelphia, Pennsylvania
Average climate in Riverside, California
Air pollution
Type
AQI
CO
NO2
OZONE
PB
PM10
PM25
SO2
Year
Philadelphia
Riverside
Philadelphia
Riverside
Philadelphia
Riverside
Philadelphia
Riverside
Philadelphia
Riverside
Philadelphia
Riverside
Philadelphia
Riverside
Philadelphia
Riverside
2018
99
153
0.37
0.35
10.7
14.4
24.3
29.8
N/A
0.006
17.2
44.6
9.2
13.6
0.9
0.4
2017
105
151
0.32
0.34
11.0
14.7
25.3
31.5
0.004
0.004
22.3
48.4
8.9
14.8
1.0
0.3
2016
99
140
0.30
0.33
13.6
14.8
25.1
30.9
0.007
0.006
23.2
44.4
9.5
14.5
1.4
0.2
2015
110
147
0.34
0.33
15.8
14.5
22.6
30.8
0.007
0.004
23.9
43.6
10.5
15.4
1.8
0.3
2014
105
147
0.34
0.37
16.8
15.9
23.1
30.7
0.027
0.006
23.0
34.1
11.7
16.5
2.2
0.3
2013
105
147
0.27
0.38
16.7
16.4
22.5
29.2
0.029
0.006
31.0
33.2
10.5
16.4
1.5
0.2
2012
111
148
0.29
0.35
17.8
16.4
23.0
30.2
0.040
0.007
14.6
32.3
11.7
16.0
1.5
0.3
2011
113
150
0.28
0.37
19.9
16.3
24.3
32.0
0.039
0.006
16.9
33.1
9.8
15.2
1.9
0.3
2010
116
144
0.30
0.42
20.1
17.8
23.0
30.9
0.009
0.008
21.7
31.9
12.2
15.5
2.6
1.3
2009
95
151
0.32
0.37
18.9
20.0
19.7
29.0
0.011
0.009
18.0
38.0
11.9
19.6
2.9
1.5
2008
112
157
0.30
0.41
19.8
20.5
19.1
30.0
0.010
0.010
16.8
43.6
13.9
16.3
3.8
0.9
2007
128
135
0.42
0.65
21.6
20.8
23.3
28.3
0.019
0.011
17.5
N/A
12.3
N/A
4.2
1.6
2006
112
129
0.52
0.58
21.4
21.0
22.5
28.0
0.016
0.005
18.3
N/A
13.1
N/A
4.2
1.4
2005
108
134
0.58
0.53
24.4
22.8
20.8
27.3
0.018
0.012
19.7
N/A
N/A
N/A
5.0
3.3
2004
102
142
0.58
0.72
24.1
18.5
18.9
29.5
0.023
0.013
19.1
N/A
N/A
N/A
5.2
3.1
2003
103
144
0.62
0.75
23.8
22.7
19.7
28.5
0.034
0.013
19.6
N/A
N/A
N/A
5.4
2.0
2002
128
142
0.56
0.82
26.8
24.9
21.2
28.5
0.035
0.015
18.3
N/A
N/A
N/A
4.9
0.2
2001
119
145
0.63
0.79
27.9
25.7
20.0
26.1
0.014
0.025
20.6
N/A
N/A
N/A
5.6
0.9
2000
111
157
0.68
0.82
26.7
24.2
19.0
25.0
0.034
0.031
N/A
N/A
N/A
N/A
5.5
1.2
Natural disasters
Type
Philadelphia
Riverside
Tornado activity compared to U.S. average
96.6%
17.4%
Earthquake activity compared to U.S. average
34.4%
7,322.6%
Natural disasters compared to U.S. average
22%
46%
Transportation
Philadelphia excels in public transport with an extensive network like SEPTA, while Riverside is more car-centric and spread out. Commute times in Philadelphia generally are shorter due to better accessibility.
Transport
Type
Philadelphia
Riverside
Amtrak stations
2
1
Amtrak stations nearby
3
3
FAA registered aircraft
347
307
FAA registered aircraft manufacturers and dealers
2
15
Means of transportation to work
Type
Philadelphia
Riverside
Bicycle
2%
0.5%
Bus
11.7%
0.9%
Carpooled
8.7%
9%
Car alone
60%
85.7%
Motorcycle
0.1%
0.3%
Railroad
0.7%
0.4%
Streetcar
4.2%
0%
Subway
2.8%
0.1%
Taxicab
0.2%
0%
Walked
7.8%
2.3%
Average travel time to work
Type
Philadelphia
Riverside
Average
34.3 min
31.3 min
Other means
28.2 min
28.7 min
Public transportation
45.6 min
45.3 min
Private vehicle occupancy
Type
Philadelphia
Riverside
Average
1.2
1.1
Drove alone
86.4%
89.1%
In 2 person carpool
10.2%
8.4%
In 3 person carpool
2%
2%
In 4 person carpool
0.9%
0.2%
In 5-6 person carpool
0.3%
0.2%
In 7+ person carpool
0.2%
0.1%
How many people usually rode to work in the car, truck or van.
Real Estate
Real-estate markets in both cities are dynamic but with different drivers. In Philadelphia, high demand and limited supply drive the market, with rental and property prices somewhat higher than in Riverside, where real estate is more affordable but expected to rise due to increased popularity.
Neighborhoods
Philadelphia is known for its diverse neighborhoods like Fishtown and Queen Village, each with a distinct character. Riverside’s neighborhoods have a suburban feel, spread out with more open spaces like Orangecrest and La Sierra.
Houses and residents
Type
Philadelphia
Riverside
Houses
733,015
94,246
Average household size (people)
2.5
3.2
Median year apartment built
1953
1982
Median year house/condo built
1947
1974
Length of stay in the house since moving in
16 years
14.2 years
Houses occupied
660,921 (90.2%)
91,110 (96.7%)
Houses occupied by owners
348,935 (52.8%)
51,211 (56.2%)
Houses occupied by renters
311,986 (47.2%)
39,899 (43.8%)
Median rent asked for vacant for-rent units
$1,301
$1,277
Median monthly housing costs
$1,096
$1,680
Median price asked for vacant for-sale houses and condos
$260,453
$414,585
Estimated median house or condo value
$220,700
$483,300
Median numbers of rooms
5.5
5.2
Median number of rooms in apartments
4.2
3.9
Median number of rooms in houses and condos
6.2
6.1
Median house price - detached houses
$292,974
$548,362
Median house price - in 2-unit structures
$357,727
$525,372
Median house price - in 3-to-4-unit structures
$264,854
$450,463
Median house price - in 5 or more unit structures
$442,314
$408,213
Median house price - mobile homes
$163,609
$81,780
Median house price - Townhouses or other attached units
$239,791
$442,670
Median house price - All housing units
$256,324
$529,360
Median house age
73
44
Renting percentage
45.9%
44.3%
Housing density (houses/condos per square mile)
5,426.1
1,206.8
House value disparities
38.4%
21%
Household income disparities
49.5%
40.5%
Median household income for houses/condes with a mortgage
$86,108
$104,161
Median household income for apartments without a mortgage
$44,075
$71,925
Housing units without a mortgage
8,484 (4%)
393 (1%)
Housing units with both a second mortgage and home equity loan
18,029 (8.5%)
1,312 (3.3%)
Housing units with a mortgage
202,880 (96%)
39,744 (99%)
Housing units with a home equity loan
1,280 (0.6%)
123 (0.3%)
Housing units with a second mortgage
22,966 (10.9%)
2,112 (5.3%)
House/condo owner moved in on average (years ago)
15
13
House/condo renter moved in on average (years ago)
3
3
Housing units lacking complete kitchen facilities
3.7%
2.5%
Housing units lacking complete plumbing facilities
3.3%
0.4%
Housing units in structures
Housing units in structures
Philadelphia
Riverside
One, detached
9.9%
63.1%
One, attached
55.9%
5.6%
Two
7.4%
1.1%
3 or 4
6.7%
3.7%
5 to 9
2.8%
6.8%
10 to 19
2.5%
7.0%
20 to 49
3.1%
4.6%
50 or more
11.2%
6.4%
Mobile homes
0.3%
1.8%
Boats, RVs, vans, etc.
0.1%
0.0%
Median real estate property taxes paid for housing units
Self-employed workers in own not incorporated business
29,270
8,164
State government workers
16,901
8,293
Unpaid family workers
570
199
Industries and Occupations
Philadelphia's key industries include healthcare and education. Many Philadelphians work in these sectors, along with food processing. Riverside, on the other hand, has a significant manufacturing sector, supplemented by education and healthcare.
Healthcare in Philadelphia is top-notch, with hospitals recognized nationally, like the University of Pennsylvania Health System. Riverside has quality healthcare too and is home to medical facilities like Riverside Community Hospital.
Health (county statistics)
Type
Philadelphia
Riverside
General health status score of residents in this county from 1 (poor) to 5 (excellent)
Philadelphia’s infrastructure is well-developed, featuring a grid system layouts that facilitates commuting. Riverside also has good infrastructure but is more reliant on cars due to sprawling suburban neighborhoods.
Infrastructure
Type
Philadelphia
Riverside
Hospitals
91
20
TV stations
24
5
Bank branches located here
329
61
Bank institutions located here
46
18
Main business address for public companies
47
2
Drinking water stations with no reported violations in the past
1
2
Drinking water stations with reported violations in the past
HMDA - Conventional home purchase loans - Applications denied
Year
Philadelphia
Riverside
1999
3,294
794
2000
3,202
375
2001
2,480
310
2002
2,012
405
2003
3,268
1,399
2004
4,525
1,892
2005
6,637
2,728
2006
7,517
3,235
2007
5,750
1,568
2008
2,745
544
2009
1,390
285
Culture and Food
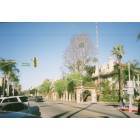
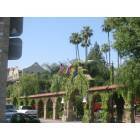
Philadelphia boasts a rich historical and cultural heritage, with iconic landmarks like the Liberty Bell and Independence Hall. Its culinary scene is known for cheesesteaks. Riverside highlights a blend of Hispanic and American cultures, with Mexican food a local favorite. The Mission Inn Museum and the Riverside Art Museum are popular spots.
Sports Teams
Sports enthusiasm sears high in Philadelphia hosting major teams like the Eagles (NFL), Phillies (MLB), and 76ers (NBA). Riverside, in closeness to Los Angeles, enjoys proximity to LA sports culture with teams like the Lakers (NBA) and Dodgers (MLB).


 Philadelphia, PA
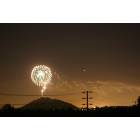
 Riverside, CA