Phoenix, Arizona and Aurora, Colorado are both thriving cities that offer a variety of opportunities for both residents and tourists. They showcase distinctive characteristics in terms of crime and safety, weather, cost of living, education, work and economy, and many more. This comparative article will highlight both cities' unique aspects and provide detailed insights for potential relocators or visitors.
Distance between
Phoenix, AZ and
Aurora, CO : 586.1 miles
Phoenix's population is larger by 317%. Its population has grown by 303,524 people (23.0%) since 2000. The population of Aurora has grown by 112,954 people (40.9%) during that time.
In terms of safety, both Phoenix and Aurora have their challenges. Crime rates in Phoenix are above the national average for both property and violent crimes. On the other hand, Aurora has a lower overall crime rate than Phoenix but somewhat higher than the national average. For tourists and residents alike, it's always best to stay informed and be vigilant about one's safety.
City-data.com crime index counts serious crimes and violent crime more heavily. It adjusts for the number of visitors and daily workers commuting into cities. (higher means more crime, U.S. average = 301.1)
City-data.com crime index counts serious crimes and violent crime more heavily. It adjusts for the number of visitors and daily workers commuting into cities. (higher means more crime, U.S. average = 301.1)
Sex Offenders
According to our data, there are 3,583 registered sex offenders living in Phoenix and 1,043 registered sex offenders living in . The ratio of residents to sex offenders in Phoenix is 451 to 1; the ratio in Aurora is 347 to 1. The number of registered sex offenders compared to the number of residents is a smaller in Phoenix than in Aurora.
Cost of Living
Cost of living in Phoenix is lower than Aurora. This includes factors such as housing, food, and transportation. While Phoenix offers a more affordable lifestyle, Aurora's cost is on par with the national average. However, the higher cost in Aurora is balanced by higher median income levels compared to Phoenix.
Income Tax
Arizona income tax rates range from 2.59% to 4.50% while Colorado imposes a flat income tax rate of 4.63%. Thus, Phoenix's income tax is potentially lower depending on income levels.
Property Tax
Property tax is significantly lower in Phoenix than in Aurora. Phoenix has an effective property tax rate of 0.802%, while Aurora's is around 0.569%. This difference may have a substantial impact on home ownership cost.
Sales Tax
Phoenix has higher sales tax than Aurora. Phoenix's combined city and state sales tax totals 8.6%, whereas Aurora's combined rate is 8.0%. However, Aurora mandates additional taxes on certain goods which might increase the overall burden.
Income
Type
Phoenix
Aurora
Estimated median household income
$68,435
$71,647
Estimated per capita income
$35,073
$35,054
Cost of living index (U.S. average is 100)
101.2
109.4
If you make $50,000 in Phoenix, you will have to make $54,051 in Aurora to maintain the same standard of living.
Geographical Conditions
Phoenix is positioned within a subtropical desert, characterized by cacti and rugged hills. Aurora, on the other hand, is relatively flat and located at a high elevation, offering splendid mountain views.
In terms of education, both cities offer numerous public and private schools, however, Aurora's schools are ranked higher on average. Aurora is part of the Cherry Creek School District, one of the highest-rated districts in Colorado. Phoenix, while having some outstanding schools, overall ranks lower in comparison.
Phoenix has a more diverse economy with job growth in sectors such as healthcare, finance, and manufacturing. Aurora's economy relies heavily on sectors like healthcare, retail, and education. Both cities are seeing steady economic growth, providing varied job opportunities for residents.
Biggest Employers
In Phoenix, the top employers are Banner Health System, Walmart, and Wells Fargo. Aurora’s biggest employers include The Children's Hospital, Anschutz Medical Campus, and the Air Force Base. This showcases the healthcare prominence in both cities.
In Phoenix (Maricopa County), 43.6% voted for Democrats and 54.3% for Republicans in 2012 Presidential Election. In Aurora (Adams County), 57.3% voted for Democrats and 40.4% for Republicans.
Elections
Type
Democrats
Republicans
Other
Year
Phoenix
Aurora
Phoenix
Aurora
Phoenix
Aurora
2020
50.2%
57.1%
48.0%
40.7%
1.8%
2.2%
2016
44.9%
50.1%
47.7%
41.6%
7.5%
8.3%
2012
43.6%
57.3%
54.3%
40.4%
2.1%
2.3%
2008
44.0%
58.5%
54.5%
40.1%
1.5%
1.4%
2004
42.4%
50.7%
57.0%
48.4%
0.6%
0.9%
2000
43.0%
50.3%
53.4%
44.2%
3.6%
5.5%
1996
44.5%
51.3%
47.2%
38.9%
8.2%
9.8%
Breakdown of population affiliated with a religious congregation
Type
Adherents
Congregations
Religion
Phoenix
Aurora
Phoenix
Aurora
CATHOLIC CHURCH
13.6%
16.0%
4.3%
4.5%
SOUTHERN BAPTIST CONVENTION
1.9%
0.7%
6.5%
7.8%
EVANGELICAL LUTHERAN CHURCH IN AMERICA
0.8%
0.4%
2.0%
2.5%
LUTHERAN CHURCH
0.5%
0.7%
1.5%
3.3%
SEVENTH DAY ADVENTIST CHURCH
0.4%
0.4%
2.0%
3.3%
EPISCOPAL CHURCH
0.3%
0.1%
1.3%
1.2%
VINEYARD USA
0.3%
0.0%
0.6%
0.4%
Weather
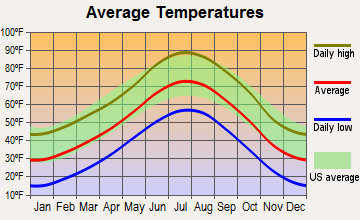
Weather conditions are significantly different in Phoenix and Aurora. Phoenix is known for its hot desert climate with extremely high temperatures during summer and mild winters. Conversely, Aurora provides a cooler climate with four distinct seasons including heavy snowfall in winter. This difference is a key aspect to consider when choosing between both cities.
Weather and climate
Type
Phoenix
Aurora
Temperature - Average
71.5°F
49.9°F
Humidity - Average morning or afternoon humidity
37.5%
50.6%
Humidity - Differences between morning and afternoon humidity
48%
20%
Humidity - Maximum monthly morning or afternoon humidity
60%
55%
Humidity - Minimum monthly morning or afternoon humidity
12%
35%
Precipitation - Yearly average
8.7 in
16.9 in
Snowfall - Yearly average
0 in
114 in
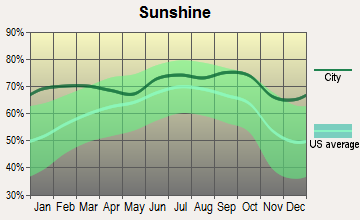
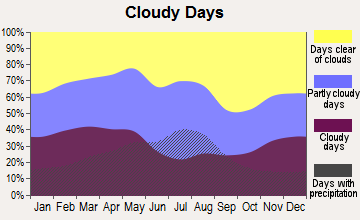
Clouds - Number of days clear of clouds
35.3%
19.2%
Sunshine amount - Average
92.8%
75.6%
Sunshine amount - Differences during a year
16%
10%
Sunshine amount - Maximum monthly
95%
74%
Sunshine amount - Minimum monthly
79%
64%
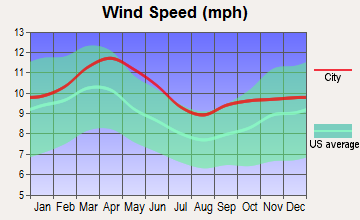
Wind speed - Average
6.6 mph
8.6 mph
Average climate in Phoenix, Arizona
Average climate in Aurora, Colorado
Air pollution
Type
AQI
CO
NO2
OZONE
PB
PM10
PM25
SO2
Year
Phoenix
Aurora
Phoenix
Aurora
Phoenix
Aurora
Phoenix
Aurora
Aurora
Phoenix
Aurora
Phoenix
Aurora
Phoenix
Aurora
2018
156
99
0.38
0.37
15.2
21.5
28.5
31.3
N/A
N/A
34.8
29.2
8.6
8.5
0.6
0.7
2017
120
95
0.41
0.37
15.9
21.9
28.6
31.1
N/A
N/A
34.9
22.0
7.6
8.5
1.4
0.9
2016
114
90
0.44
0.42
15.8
24.0
27.3
30.7
N/A
N/A
30.6
22.6
7.7
8.1
0.4
1.0
2015
102
101
0.46
0.44
17.6
22.8
27.1
29.5
N/A
N/A
26.2
20.6
7.9
9.5
0.9
1.1
2014
117
94
0.46
0.42
19.6
21.8
27.6
29.6
N/A
N/A
37.0
22.5
8.5
10.1
1.1
1.3
2013
130
84
0.43
0.39
19.9
19.6
27.9
29.9
N/A
N/A
35.3
21.9
8.4
N/A
0.9
1.4
2012
157
90
0.44
0.35
21.2
18.9
28.1
30.8
N/A
N/A
41.9
24.2
8.8
N/A
1.3
1.2
2011
203
91
0.47
0.34
20.0
18.1
28.3
30.9
N/A
N/A
41.3
23.8
9.6
N/A
0.9
1.5
2010
100
81
0.48
0.41
19.9
16.3
26.9
28.8
N/A
N/A
31.2
26.6
8.3
N/A
0.9
1.0
2009
108
79
0.52
0.37
20.1
14.1
25.6
27.1
0.005
N/A
38.2
22.6
N/A
N/A
1.8
1.3
2008
106
85
0.48
0.41
21.4
17.3
26.6
28.8
0.008
N/A
39.6
25.5
N/A
N/A
2.4
1.6
2007
129
96
0.54
0.42
23.5
20.6
25.2
25.4
0.007
N/A
47.6
28.8
N/A
N/A
2.4
1.2
2006
131
89
0.66
0.50
25.3
19.0
24.4
25.0
0.027
N/A
50.8
28.0
N/A
N/A
2.3
1.4
2005
109
86
0.74
0.57
25.9
21.3
22.2
22.5
0.109
N/A
44.6
29.6
N/A
N/A
2.5
1.5
2004
98
82
0.77
0.61
25.5
21.2
23.4
21.4
0.037
N/A
32.8
28.6
N/A
N/A
1.4
1.8
2003
101
106
0.90
0.62
26.8
21.2
23.7
23.1
0.040
N/A
42.6
32.6
N/A
N/A
1.4
1.9
2002
111
86
0.98
0.64
28.7
19.2
23.6
22.8
0.028
N/A
41.8
35.7
N/A
N/A
1.6
2.5
2001
106
95
1.00
0.79
28.6
24.0
22.3
20.4
0.030
N/A
37.8
32.6
N/A
N/A
1.5
2.6
2000
117
93
1.14
0.77
29.9
13.8
24.6
21.4
0.033
N/A
45.6
12.2
N/A
N/A
1.7
2.1
Natural disasters
Type
Phoenix
Aurora
Tornado activity compared to U.S. average
18.3%
138.7%
Earthquake activity compared to U.S. average
2,597.6%
796.4%
Natural disasters compared to U.S. average
16%
11%
Transportation
Phoenix supports extensive freeway system and light rail transit, while Aurora lacks in heavy rail system but compensates with effective bus lines and proximity to Denver's light rail. Both cities have international airports catering to commuters and tourists.
Transport
Type
Phoenix
Aurora
Amtrak stations
3
0
Amtrak stations nearby
3
2
FAA registered aircraft
1
138
FAA registered aircraft manufacturers and dealers
15
19
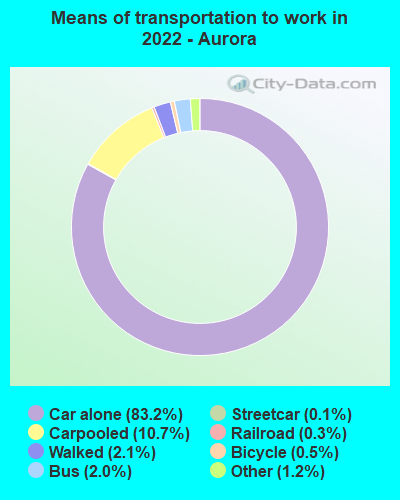
Means of transportation to work
Type
Phoenix
Aurora
Bicycle
0.4%
0.6%
Bus
1.8%
1.7%
Carpooled
12.2%
9.3%
Car alone
81.8%
84.4%
Motorcycle
0.4%
0.1%
Railroad
0.2%
0.1%
Subway
0%
0.1%
Taxicab
0.1%
0%
Walked
1.4%
2.5%
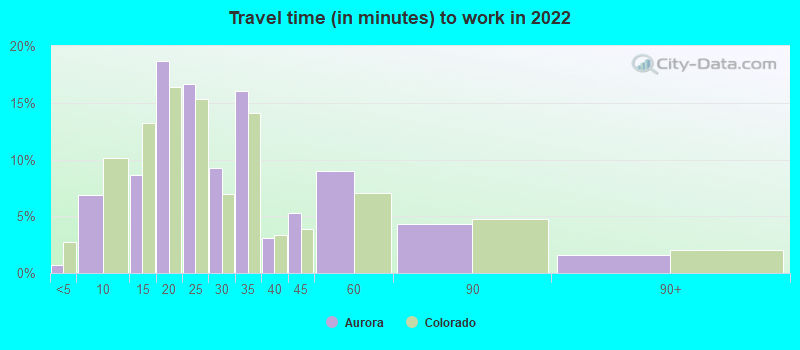
Average travel time to work
Type
Phoenix
Aurora
Average
28.6 min
28.3 min
Other means
26.4 min
26.9 min
Public transportation
45.1 min
50.5 min
Private vehicle occupancy
Type
Phoenix
Aurora
Average
1.2
1.2
Drove alone
86.4%
85.1%
In 2 person carpool
9.6%
10%
In 3 person carpool
2%
2.8%
In 4 person carpool
1.5%
1.5%
In 5-6 person carpool
0.3%
0.3%
In 7+ person carpool
0.3%
0.2%
How many people usually rode to work in the car, truck or van.
Real Estate
The real-estate market in Phoenix and Aurora are promising. Phoenix has a more stable, slow-growing market suitable for investors seeking long-term gains, while Aurora's real estate market is thriving with higher average home prices and quick turnovers.
Neighborhoods
Phoenix boasts lively neighborhoods like Downtown Phoenix and Arcadia, popular for their bustling lifestyle. Aurora offers family-friendly neighborhoods such as Cherry Creek and Seven Hills known for their peace and safety.
Houses and residents
Type
Phoenix
Aurora
Houses
644,625
149,636
Average household size (people)
2.8
2.7
Median year apartment built
1987
1986
Median year house/condo built
1983
1984
Length of stay in the house since moving in
11.1 years
10.4 years
Houses occupied
602,039 (93.4%)
140,003 (93.6%)
Houses occupied by owners
354,237 (58.8%)
89,615 (64%)
Houses occupied by renters
247,802 (41.2%)
50,388 (36%)
Median rent asked for vacant for-rent units
$1,605
$2,036
Median monthly housing costs
$1,284
$1,526
Median price asked for vacant for-sale houses and condos
$375,817
$725,445
Estimated median house or condo value
$352,600
$411,400
Median numbers of rooms
5.2
5.5
Median number of rooms in apartments
4
3.9
Median number of rooms in houses and condos
6.1
6.5
Median house price - detached houses
$452,968
$500,029
Median house price - in 2-unit structures
Over $1,000,000
$384,060
Median house price - in 3-to-4-unit structures
$229,335
$254,381
Median house price - in 5 or more unit structures
$299,875
$231,026
Median house price - mobile homes
$159,046
$130,226
Median house price - occupied boats, rvs, vans etc.
Over $1,000,000
$160,380
Median house price - Townhouses or other attached units
$300,398
$471,483
Median house price - All housing units
$429,075
$476,379
Median house age
36
36
Renting percentage
42.4%
40.1%
Housing density (houses/condos per square mile)
1,357.5
1,050.1
House value disparities
30.8%
23.6%
Household income disparities
43.9%
41.5%
Median household income for houses/condes with a mortgage
$96,609
$99,433
Median household income for apartments without a mortgage
$63,626
$63,316
Housing units without a mortgage
3,634 (1.5%)
424 (0.6%)
Housing units with both a second mortgage and home equity loan
12,949 (5.2%)
5,246 (7.8%)
Housing units with a mortgage
246,434 (98.5%)
66,791 (99.4%)
Housing units with a home equity loan
624 (0.2%)
176 (0.3%)
Housing units with a second mortgage
16,890 (6.8%)
6,860 (10.2%)
House/condo owner moved in on average (years ago)
8
7
House/condo renter moved in on average (years ago)
1
1
Housing units lacking complete kitchen facilities
1.2%
1%
Housing units lacking complete plumbing facilities
0.7%
0.6%
Housing units in structures
Housing units in structures
Phoenix
Aurora
One, detached
60.3%
52.6%
One, attached
4.9%
11.9%
Two
1.4%
0.2%
3 or 4
4.4%
4.2%
5 to 9
5.0%
7.1%
10 to 19
5.3%
11.0%
20 to 49
4.1%
5.5%
50 or more
11.3%
5.7%
Mobile homes
3.1%
1.7%
Boats, RVs, vans, etc.
0.2%
0.0%
Median real estate property taxes paid for housing units
Self-employed workers in own not incorporated business
48,122
13,677
State government workers
30,385
5,134
Unpaid family workers
1,048
0
Industries and Occupations
Phoenix being larger, encompasses diverse industries including healthcare, education, finance and insurance, and manufacturing. Aurora's dominating industries are healthcare, retail trade, and educational services. These diversities provide a wide range of job opportunities for residents and relocators alike in both cities.
Both Phoenix and Aurora provide exceptional healthcare facilities. Phoenix has world-class healthcare institutions such as Mayo Clinic and Banner Health. Aurora's healthcare system is centered around the Anschutz Medical Campus which is one of the largest medical facilities in the region.
Health (county statistics)
Type
Phoenix
Aurora
General health status score of residents in this county from 1 (poor) to 5 (excellent)
Phoenix is larger in size encouraging more car usage, whereas Aurora's infrastructure is more planned and compact, favoring walking and short commutes. Both cities ensure robust power, water, and telecommunications supply.
Infrastructure
Type
Phoenix
Aurora
Hospitals
48
4
TV stations
22
15
Bank branches located here
263
77
Bank institutions located here
41
19
Main business address for public companies
41
1
Drinking water stations with no reported violations in the past
2
1
Drinking water stations with reported violations in the past
HMDA - Conventional home purchase loans - Applications denied
Year
Phoenix
Aurora
1999
5,846
1,737
2000
4,847
1,460
2001
3,823
1,056
2002
3,472
635
2003
5,750
1,276
2004
9,848
2,052
2005
15,879
3,087
2006
18,392
2,880
2007
9,797
1,693
2008
3,130
782
2009
1,614
302
Culture and Food
Phoenix boasts rich cultural diversity and is famous for its Southwestern and Mexican cuisine. Aurora's cultural scene is vibrant and diverse, offering tastes of various global cuisines, thanks to a large immigrant population.
Sports Teams
Phoenix homes multiple professional sports teams including the Arizona Diamondbacks (MLB), the Phoenix Suns (NBA), and the Arizona Cardinals (NFL). Aurora doesn't host any major sports teams but Denver's teams, such as the Denver Broncos (NFL) and the Colorado Rockies (MLB), are just a short drive away.


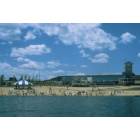

 Phoenix, AZ
 Aurora, CO