Phoenix, AZ and Southwest San Gabriel Valley, CA are both significant American locations with unique characteristics. Phoenix, AZ is the fifth most populous city in the USA, known for its warm climate and diverse economy. On the other hand, Southwest San Gabriel Valley is located in California and is a collection of intimate communities. They both offer distinct experiences for both residents and visitors alike.
When comparing Phoenix, AZ and Southwest San Gabriel Valley, CA, both areas are affected by crime, albeit at different levels. According to the FBI crime data, Phoenix has a higher crime rate compared to national average. It has successfully been improving over the years and efforts are continuously being made to improve safety. Conversely, the Southwest San Gabriel Valley enjoys a lower crime rate than the national average, largely due to its small, tightly knit communities.
Cost of Living
The cost of living in Phoenix, AZ is generally lower than in Southwest San Gabriel Valley, CA. Housing tends to be more affordable in Phoenix, while Southwest San Gabriel Valley experiences higher housing costs due to its proximity to major California cities like Los Angeles.
Income Tax
Arizona has a progressive income tax that can reach as high as 4.50%. However, Arizona's taxes are still more favorable compared to California’s progressive system where rates can reach as high as 13.3%.
Property Tax
Property tax rates in Phoenix are typically lower compared to the national average. Southwest San Gabriel Valley, like much of California, imposes relatively high property taxes, but the state does offer homeowner exemptions.
Sales Tax
Phoenix residents pay a total sales tax of 8.6%, which is higher than the national average. Southwest San Gabriel Valley residents, however, bear a significantly higher sales tax rate, with CA having the highest statewide sales tax of 7.25%.
Income
Type
Phoenix
Southwest San Gabriel Valley
Estimated median household income
$68,435
$73,720
Estimated per capita income
$35,073
$29,945
Cost of living index (U.S. average is 100)
101.2
161.2
If you make $50,000 in Phoenix, you will have to make $79,644 in Southwest San Gabriel Valley to maintain the same standard of living.
Geographical Conditions
Phoenix is located in the Sonoran Desert and its topography includes flatlands, desert landscapes and mountain ranges. Conversely, Southwest San Gabriel Valley is located in a hilly region and enjoys a close proximity to the Pacific Ocean.
Geographical information
Type
Phoenix
Southwest San Gabriel Valley
Land area
474.9 sq. miles
35.3 sq. miles
Population density
3,421.1 people per sq. mile
9,252.7 people per sq. mile
Relative area comparison
Phoenix, AZ Southwest San Gabriel Valley, CA
Education
Both regions have access to quality education. Phoenix has a larger and more diverse array of schools and universities. Conversely, Southwest San Gabriel Valley offers access to numerous esteemed schools and colleges due to its close proximity to LA and being part of the California education system.
Phoenix has a diverse economy with sectors like health care, finance, and tech playing significant roles. In contrast, the economy of Southwest San Gabriel Valley is primarily driven by sectors like health care, retail trade, and manufacturing.
Biggest Employers
In Phoenix, the largest employers are Banner Health and Walmart. In Southwest San Gabriel Valley, major employers include organizations like Kaiser Permanente and the El Monte City School District.
In Phoenix (Maricopa County), 43.6% voted for Democrats and 54.3% for Republicans in 2012 Presidential Election. In Southwest San Gabriel Valley (Los Angeles County), 69.7% voted for Democrats and 27.8% for Republicans.
Elections
Type
Democrats
Republicans
Other
Year
Phoenix
Southwest San Gabriel Valley
Phoenix
Southwest San Gabriel Valley
Phoenix
Southwest San Gabriel Valley
2020
50.2%
71.0%
48.0%
26.9%
1.8%
2.1%
2016
44.9%
72.0%
47.7%
22.5%
7.5%
5.5%
2012
43.6%
69.7%
54.3%
27.8%
2.1%
2.4%
2008
44.0%
69.2%
54.5%
28.8%
1.5%
1.9%
2004
42.4%
63.3%
57.0%
35.7%
0.6%
1.0%
2000
43.0%
63.6%
53.4%
32.4%
3.6%
4.0%
1996
44.5%
59.3%
47.2%
31.0%
8.2%
9.7%
Breakdown of population affiliated with a religious congregation
Type
Adherents
Congregations
Religion
Phoenix
Southwest San Gabriel Valley
Phoenix
Southwest San Gabriel Valley
CATHOLIC CHURCH
13.6%
36.1%
4.3%
4.7%
SOUTHERN BAPTIST CONVENTION
1.9%
1.0%
6.5%
9.0%
EVANGELICAL LUTHERAN CHURCH IN AMERICA
0.8%
0.2%
2.0%
1.9%
LUTHERAN CHURCH
0.5%
0.2%
1.5%
1.6%
SEVENTH DAY ADVENTIST CHURCH
0.4%
0.5%
2.0%
2.4%
EPISCOPAL CHURCH
0.3%
0.4%
1.3%
1.4%
VINEYARD USA
0.3%
0.1%
0.6%
0.3%
AMERICAN BAPTIST CHURCHES IN THE USA
0.2%
0.5%
0.6%
3.1%
MUSLIM ESTIMATE
0.2%
0.7%
1.0%
1.0%
Weather
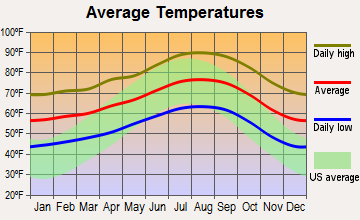
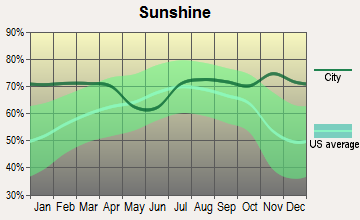
Phoenix is known for its desert climate with some of the hottest temperatures in the nation during the summer months. It enjoys over 300 sunny days annually. On the flip side, Southwest San Gabriel Valley boasts a Mediterranean climate with mild, wet winters and dry summers, offering a more temperate year-round climate.
Weather and climate
Type
Phoenix
Southwest San Gabriel Valley
Temperature - Average
71.5°F
66.3°F
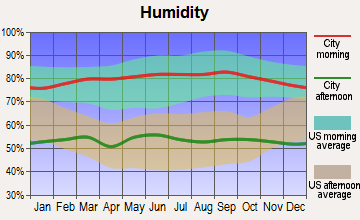
Humidity - Average morning or afternoon humidity
37.5%
61.4%
Humidity - Differences between morning and afternoon humidity
48%
16.5%
Humidity - Maximum monthly morning or afternoon humidity
60%
65.8%
Humidity - Minimum monthly morning or afternoon humidity
12%
49.3%
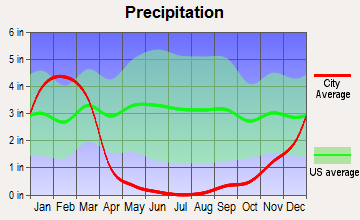
Precipitation - Yearly average
8.7 in
17.6 in
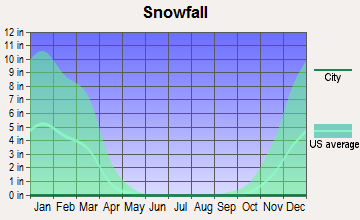
Snowfall - Yearly average
0 in
0 in
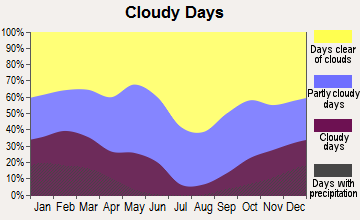
Clouds - Number of days clear of clouds
35.3%
30.1%
Sunshine amount - Average
92.8%
78.4%
Sunshine amount - Differences during a year
16%
22%
Sunshine amount - Maximum monthly
95%
85%
Sunshine amount - Minimum monthly
79%
63%
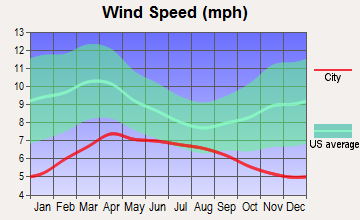
Wind speed - Average
6.6 mph
2.3 mph
Average climate in Phoenix, Arizona
Average climate in Southwest San Gabriel Valley, California
Air pollution
Type
AQI
CO
NO2
OZONE
PB
PM10
PM25
SO2
Year
Phoenix
Southwest San Gabriel Valley
Phoenix
Southwest San Gabriel Valley
Phoenix
Southwest San Gabriel Valley
Phoenix
Southwest San Gabriel Valley
Southwest San Gabriel Valley
Phoenix
Southwest San Gabriel Valley
Phoenix
Southwest San Gabriel Valley
Phoenix
Southwest San Gabriel Valley
2018
156
140
0.38
0.39
15.2
14.2
28.5
26.6
0.008
N/A
34.8
27.5
8.6
15.1
0.6
0.4
2017
120
142
0.41
0.38
15.9
15.1
28.6
27.8
0.007
N/A
34.9
30.2
7.6
15.3
1.4
0.5
2016
114
128
0.44
0.36
15.8
15.2
27.3
26.5
0.007
N/A
30.6
27.8
7.7
14.3
0.4
0.4
2015
102
137
0.46
0.36
17.6
15.3
27.1
26.7
0.006
N/A
26.2
27.6
7.9
16.4
0.9
0.3
2014
117
138
0.46
0.39
19.6
16.3
27.6
26.8
0.007
N/A
37.0
29.9
8.5
18.0
1.1
0.4
2013
130
140
0.43
0.44
19.9
17.5
27.9
25.2
0.007
N/A
35.3
28.3
8.4
17.0
0.9
0.4
2012
157
144
0.44
0.47
21.2
17.7
28.1
25.0
0.007
N/A
41.9
27.6
8.8
18.1
1.3
0.5
2011
203
142
0.47
0.50
20.0
19.3
28.3
23.6
0.008
N/A
41.3
29.8
9.6
17.6
0.9
0.4
2010
100
128
0.48
0.52
19.9
19.4
26.9
22.9
0.020
N/A
31.2
30.0
8.3
16.3
0.9
0.5
2009
108
150
0.52
0.43
20.1
21.5
25.6
23.5
0.011
N/A
38.2
40.0
N/A
18.0
1.8
0.5
2008
106
152
0.48
0.53
21.4
23.5
26.6
22.8
0.014
N/A
39.6
39.1
N/A
18.3
2.4
0.6
2007
129
128
0.54
0.58
23.5
24.2
25.2
21.8
0.017
N/A
47.6
N/A
N/A
N/A
2.4
1.1
2006
131
125
0.66
0.63
25.3
24.6
24.4
22.1
0.009
N/A
50.8
N/A
N/A
N/A
2.3
1.7
2005
109
123
0.74
0.66
25.9
25.6
22.2
20.5
0.015
N/A
44.6
N/A
N/A
N/A
2.5
2.1
2004
98
132
0.77
0.77
25.5
27.7
23.4
22.9
0.019
N/A
32.8
N/A
N/A
N/A
1.4
2.4
2003
101
143
0.90
0.98
26.8
31.8
23.7
22.0
0.027
N/A
42.6
N/A
N/A
N/A
1.4
1.8
2002
111
137
0.98
1.00
28.7
33.0
23.6
21.1
0.025
N/A
41.8
N/A
N/A
N/A
1.6
2.4
2001
106
143
1.00
1.11
28.6
34.2
22.3
18.9
0.039
N/A
37.8
N/A
N/A
N/A
1.5
2.4
2000
117
147
1.14
1.12
29.9
33.4
24.6
18.9
0.033
N/A
45.6
N/A
N/A
N/A
1.7
1.4
Natural disasters
Type
Phoenix
Southwest San Gabriel Valley
Tornado activity compared to U.S. average
18.3%
18%
Earthquake activity compared to U.S. average
2,597.6%
7,182.3%
Natural disasters compared to U.S. average
16%
57%
Transportation
Phoenix has extensive public transportation options, including light rail and bus services. Southwest San Gabriel Valley, though smaller, benefits from LA’s robust transit system and the region's accessibility to major highways.
Transport
Type
Phoenix
Southwest San Gabriel Valley
Amtrak stations
3
0
Amtrak stations nearby
3
3
FAA registered aircraft
1
0
FAA registered aircraft manufacturers and dealers
15
0
Means of transportation to work
Type
Phoenix
Southwest San Gabriel Valley
Bicycle
0.4%
0.5%
Bus
1.8%
4.7%
Carpooled
12.2%
16.1%
Car alone
81.8%
73%
Motorcycle
0.4%
0.1%
Railroad
0.2%
0%
Taxicab
0.1%
0%
Walked
1.4%
2.5%
Average travel time to work
Type
Phoenix
Southwest San Gabriel Valley
Average
28.6 min
29.1 min
Real Estate
Real estate prices in Phoenix are generally lower than in Southwest San Gabriel Valley. Though both locations have seen a recent surge in property prices, Southwest San Gabriel Valley’s market remains considerably higher due to its location.
Neighborhoods
Phoenix boasts a variety of neighborhoods each with its character. Notable ones include Encanto Village known for historic homes and Downtown Phoenix for its thriving arts scene. In contrast, Southwest San Gabriel Valley is comprised of several tightly-knit communities each offering quiet residential settings.
Houses and residents
Type
Phoenix
Southwest San Gabriel Valley
Houses
644,625
102,656
Average household size (people)
2.8
3.1
Houses occupied
602,039 (93.4%)
99,543 (97%)
Houses occupied by owners
354,237 (58.8%)
47,333 (47.6%)
Houses occupied by renters
247,802 (41.2%)
52,210 (52.5%)
Median rent asked for vacant for-rent units
$1,605
$1,828
Median price asked for vacant for-sale houses and condos
$375,817
$1,138,428
Estimated median house or condo value
$352,600
$723,161
Median number of rooms in apartments
4
3.7
Median number of rooms in houses and condos
6.1
5.9
Renting percentage
42.4%
51.7%
Housing density (houses/condos per square mile)
1,357.5
2,909.6
Household income disparities
43.9%
44%
Housing units without a mortgage
3,634 (1.5%)
13,166 (31.1%)
Housing units with both a second mortgage and home equity loan
12,949 (5.2%)
88 (0.2%)
Housing units with a mortgage
246,434 (98.5%)
29,118 (68.9%)
Housing units with a home equity loan
624 (0.2%)
2,557 (6%)
Housing units with a second mortgage
16,890 (6.8%)
2,975 (7%)
Housing units lacking complete kitchen facilities
1.2%
1.5%
Housing units lacking complete plumbing facilities
Self-employed workers in own not incorporated business
48,122
8,660
State government workers
30,385
4,158
Unpaid family workers
1,048
639
Industries and Occupations
Healthcare and social assistance are the biggest industries in both Phoenix and Southwest San Gabriel Valley. However, Phoenix also has a strong presence in finance and insurance, whereas Southwest San Gabriel Valley has noticeable sectors in retail trade and manufacturing.
Both Phoenix and Southwest San Gabriel Valley have robust healthcare systems. Phoenix is home to Mayo Clinic and Banner Health, two of the top healthcare providers in the country. Southwest San Gabriel Valley, meanwhile, benefits from many medical centers and hospitals in and around LA.
Health (county statistics)
Type
Phoenix
Southwest San Gabriel Valley
General health status score of residents in this county from 1 (poor) to 5 (excellent)
Phoenix, as a major city, boasts extensive infrastructure and amenities. It hosts an international airport and a comprehensive road network. Southwest San Gabriel Valley doesn’t have quite as extensive an infrastructure, but its close proximity to LA provides easy access to major amenities.
Infrastructure
Type
Phoenix
Southwest San Gabriel Valley
TV stations
22
26
Culture and Food
Phoenix is known for its vibrant arts scene and its southwestern cuisine. It hosts various cultural festivals annually. Southwest San Gabriel Valley, due to its multicultural population, offers a diverse food scene with numerous authentic Mexican, Chinese, and Italian restaurants.
Sports Teams
Phoenix boasts several major league sports teams including the Arizona Cardinals (NFL), Arizona Diamondbacks (MLB), and Phoenix Suns (NBA). Southwest San Gabriel Valley does not have local major sports teams but is close to LA, home to multiple major league teams.
 Phoenix, AZ
 Southwest San Gabriel Valley, CA