Choosing between Phoenix, Arizona and Virginia Beach, Virginia for relocation or a visit depends on one's preferences. Both cities offer diverse culture and scenery, vibrant economic opportunities, and potential leisure and recreational activities, but they differ notably in aspects like weather, cost of living, education, and more. This comparison aims to provide a detailed perspective on life in these cities, from crime rates to the culinary scene, for both residents and travelers.
Distance between
Phoenix, AZ and
Virginia Beach, VA : 2,033.1 miles
Phoenix's population is larger by 255%. Its population has grown by 303,524 people (23.0%) since 2000. The population of Virginia Beach has grown by 32,415 people (7.6%) during that time.
Phoenix has a higher overall crime rate compared to Virginia Beach. Violent crimes in Phoenix are notably higher than the national average as compared to the considerably safer Virginia Beach. However, it's critical to understand that the crime rate can vary significantly from one neighborhood to another in both cities. Tourists should stay mindful of their surroundings.
City-data.com crime index counts serious crimes and violent crime more heavily. It adjusts for the number of visitors and daily workers commuting into cities. (higher means more crime, U.S. average = 301.1)
City-data.com crime index counts serious crimes and violent crime more heavily. It adjusts for the number of visitors and daily workers commuting into cities. (higher means more crime, U.S. average = 301.1)
Sex Offenders
According to our data, there are 3,583 registered sex offenders living in Phoenix and 706 registered sex offenders living in . The ratio of residents to sex offenders in Phoenix is 451 to 1; the ratio in Virginia Beach is 641 to 1. The number of registered sex offenders compared to the number of residents is larger in Phoenix than in Virginia Beach.
Cost of Living
Based on the cost of living index, Virginia Beach stands slightly more expensive than Phoenix. Housing, a major component of cost of living, is notably more expensive in Virginia Beach. However, health care and transportation costs are slightly lower in Virginia Beach compared to Phoenix.
Income Tax
Arizona, where Phoenix is located, has varying income tax rates from 2.59% to 4.5%, while Virginia income tax ranges from 2% to 5.75%. The rates apply similarly in both the cities of Phoenix and Virginia Beach.
Property Tax
Property taxes tend to be higher in Virginia Beach than in Phoenix. Owning property can therefore be more expensive in the long run in Virginia Beach.
Sales Tax
Phoenix has a higher combined city and state sales tax rate at 8.6%, compared to Virginia Beach's 6%. This difference can significantly impact the cost of goods and services in these regions.
Income
Type
Phoenix
Virginia Beach
Estimated median household income
$68,435
$81,634
Estimated per capita income
$35,073
$42,498
Cost of living index (U.S. average is 100)
101.2
97
If you make $50,000 in Virginia Beach, you will have to make $52,165 in Phoenix to maintain the same standard of living.
Geographical Conditions
Phoenix is set in the Southwestern desert with flat plains, surrounded in parts by mountains offering a unique desert landscape. Virginia Beach, characterized by its coastal setting, offers beaches, waterways, and marshes, as well as some forested areas.
Both Phoenix and Virginia Beach offer robust public school systems. However, the student-teacher ratio and investment per student is slightly higher in Virginia Beach, potentially providing a better learning environment. Phoenix, being a larger city, hosts more higher education institutions, including Arizona State University and University of Phoenix.
Phoenix's economy is driven by various sectors including real estate, finance, insurance, health care, and retail, contributing towards a stable job market. Virginia Beach's economy is heavily influenced by its coastal location, where industries such as tourism, defense, agriculture and fishing play a big role.
Biggest Employers
The largest employers in Phoenix include Banner Health System, Walmart, and Wells Fargo. In Virginia Beach, the prominent employers include the Naval Air Station Oceana, Virginia Beach City Public Schools, and the Sentara Healthcare system.
There were 4,922 building permits issued in Phoenix in 2012 (3970 more than in 2011) compared to 335 building permits issued in Virginia Beach in 2012 (200 less than in 2011).
In Phoenix (Maricopa County), 43.6% voted for Democrats and 54.3% for Republicans in 2012 Presidential Election. In Virginia Beach (Virginia Beach city), 48.1% voted for Democrats and 50.7% for Republicans.
Elections
Type
Democrats
Republicans
Other
Year
Phoenix
Virginia Beach
Phoenix
Virginia Beach
Phoenix
Virginia Beach
2020
50.2%
51.6%
48.0%
46.2%
1.8%
2.2%
2016
44.9%
44.8%
47.7%
48.4%
7.5%
6.8%
2012
43.6%
48.1%
54.3%
50.7%
2.1%
1.2%
2008
44.0%
49.3%
54.5%
50.1%
1.5%
0.6%
2004
42.4%
40.4%
57.0%
59.3%
0.6%
0.4%
2000
43.0%
41.8%
53.4%
56.1%
3.6%
2.1%
1996
44.5%
41.4%
47.2%
50.6%
8.2%
8.0%
Breakdown of population affiliated with a religious congregation
Type
Adherents
Congregations
Religion
Phoenix
Virginia Beach
Phoenix
Virginia Beach
CATHOLIC CHURCH
13.6%
10.7%
4.3%
4.2%
SOUTHERN BAPTIST CONVENTION
1.9%
4.9%
6.5%
13.6%
EVANGELICAL LUTHERAN CHURCH IN AMERICA
0.8%
0.4%
2.0%
1.5%
LUTHERAN CHURCH
0.5%
0.2%
1.5%
0.8%
SEVENTH DAY ADVENTIST CHURCH
0.4%
0.1%
2.0%
1.1%
EPISCOPAL CHURCH
0.3%
1.4%
1.3%
4.2%
VINEYARD USA
0.3%
0.4%
0.6%
1.1%
AMERICAN BAPTIST CHURCHES IN THE USA
0.2%
0.4%
0.6%
0.4%
MUSLIM ESTIMATE
0.2%
0.8%
1.0%
0.4%
EVANGELICAL PRESBYTERIAN CHURCH
0.0%
0.3%
0.1%
0.4%
Weather
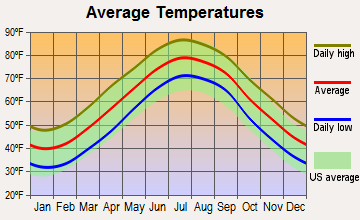
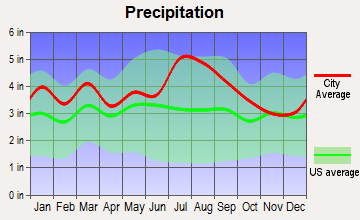
Phoenix's weather is broadly classified as hot desert climate with extremely hot summers and mild winters, while Virginia Beach experiences a humid subtropical climate with hot, humid summers and cool, mild winters. Phoenix scores considerably high in terms of heat index, while the hurricane risk is more prominent in Virginia Beach, particularly from June to November.
Weather and climate
Type
Phoenix
Virginia Beach
Temperature - Average
71.5°F
59.7°F
Humidity - Average morning or afternoon humidity
37.5%
73%
Humidity - Differences between morning and afternoon humidity
48%
32%
Humidity - Maximum monthly morning or afternoon humidity
60%
83%
Humidity - Minimum monthly morning or afternoon humidity
12%
51%
Precipitation - Yearly average
8.7 in
45.9 in
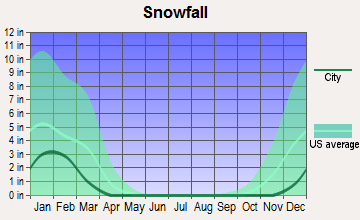
Snowfall - Yearly average
0 in
15.4 in
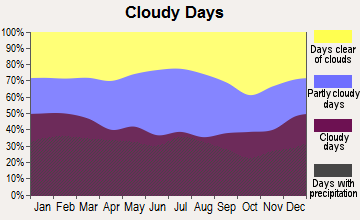
Clouds - Number of days clear of clouds
35.3%
17.6%
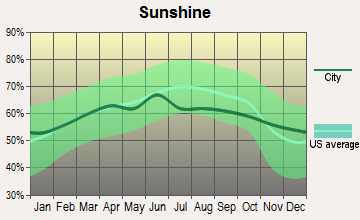
Sunshine amount - Average
92.8%
66.8%
Sunshine amount - Differences during a year
16%
14%
Sunshine amount - Maximum monthly
95%
67%
Sunshine amount - Minimum monthly
79%
53%
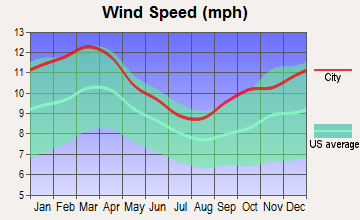
Wind speed - Average
6.6 mph
10.4 mph
Average climate in Phoenix, Arizona
Average climate in Virginia Beach, Virginia
Air pollution
Type
AQI
CO
NO2
OZONE
PB
PM10
PM25
SO2
Year
Phoenix
Virginia Beach
Phoenix
Virginia Beach
Phoenix
Virginia Beach
Phoenix
Virginia Beach
Virginia Beach
Phoenix
Phoenix
Virginia Beach
Phoenix
Virginia Beach
2018
156
57
0.38
0.27
15.2
6.3
28.5
31.3
0.002
N/A
34.8
N/A
8.6
6.1
0.6
0.4
2017
120
60
0.41
0.22
15.9
6.8
28.6
33.2
0.002
N/A
34.9
N/A
7.6
6.9
1.4
0.3
2016
114
66
0.44
0.21
15.8
6.5
27.3
31.7
0.002
N/A
30.6
N/A
7.7
6.1
0.4
0.4
2015
102
57
0.46
0.27
17.6
7.3
27.1
33.8
0.002
N/A
26.2
N/A
7.9
6.4
0.9
0.5
2014
117
59
0.46
0.27
19.6
7.5
27.6
33.8
0.002
N/A
37.0
N/A
8.5
6.8
1.1
1.1
2013
130
66
0.43
0.28
19.9
7.1
27.9
31.2
0.002
N/A
35.3
N/A
8.4
6.8
0.9
1.1
2012
157
76
0.44
0.29
21.2
7.8
28.1
34.6
0.002
N/A
41.9
N/A
8.8
8.1
1.3
1.1
2011
203
66
0.47
0.27
20.0
9.2
28.3
35.1
0.003
N/A
41.3
N/A
9.6
8.8
0.9
1.7
2010
100
71
0.48
0.25
19.9
4.8
26.9
38.4
0.004
N/A
31.2
N/A
8.3
N/A
0.9
2.2
2009
108
51
0.52
0.25
20.1
9.7
25.6
31.5
0.012
N/A
38.2
N/A
N/A
N/A
1.8
2.6
2008
106
77
0.48
0.23
21.4
10.3
26.6
36.2
0.004
N/A
39.6
N/A
N/A
N/A
2.4
3.3
2007
129
81
0.54
0.18
23.5
12.2
25.2
36.3
0.004
N/A
47.6
N/A
N/A
N/A
2.4
4.3
2006
131
62
0.66
0.32
25.3
N/A
24.4
36.2
0.004
N/A
50.8
N/A
N/A
N/A
2.3
3.4
2005
109
67
0.74
0.28
25.9
N/A
22.2
35.4
N/A
N/A
44.6
N/A
N/A
N/A
2.5
3.4
2004
98
80
0.77
0.30
25.5
15.9
23.4
33.3
N/A
N/A
32.8
N/A
N/A
N/A
1.4
4.3
2003
101
84
0.90
0.34
26.8
16.2
23.7
34.3
N/A
N/A
42.6
N/A
N/A
N/A
1.4
3.9
2002
111
99
0.98
0.40
28.7
17.8
23.6
38.0
N/A
N/A
41.8
N/A
N/A
N/A
1.6
5.9
2001
106
92
1.00
0.42
28.6
18.2
22.3
36.3
N/A
N/A
37.8
N/A
N/A
N/A
1.5
6.0
2000
117
85
1.14
0.44
29.9
15.7
24.6
36.5
N/A
N/A
45.6
N/A
N/A
N/A
1.7
6.5
Natural disasters
Type
Phoenix
Virginia Beach
Tornado activity compared to U.S. average
18.3%
61.5%
Earthquake activity compared to U.S. average
2,597.6%
35.2%
Natural disasters compared to U.S. average
16%
0%
Transportation
Phoenix provides light rail, buses, and plenty of freeways, leading to longer average commute times than Virginia Beach. Virginia Beach lacks a major public transit system, but has less traffic, and is more walkable, especially in the oceanfront area.
Transport
Type
Phoenix
Virginia Beach
Amtrak stations
3
1
Amtrak stations nearby
3
2
FAA registered aircraft
1
374
FAA registered aircraft manufacturers and dealers
15
4
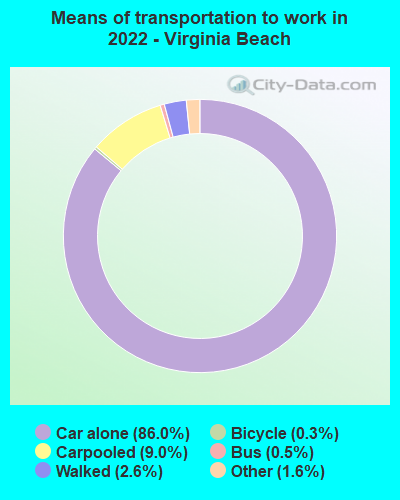
Means of transportation to work
Type
Phoenix
Virginia Beach
Bicycle
0.4%
0.2%
Bus
1.8%
1%
Carpooled
12.2%
9.5%
Car alone
81.8%
84.2%
Motorcycle
0.4%
0.1%
Railroad
0.2%
0%
Taxicab
0.1%
0%
Walked
1.4%
3.2%
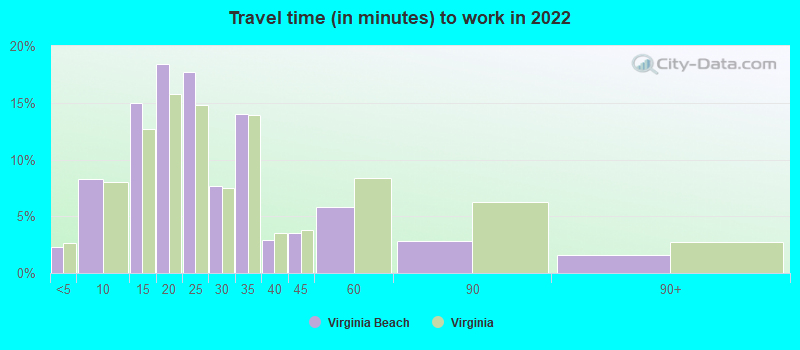
Average travel time to work
Type
Phoenix
Virginia Beach
Average
28.6 min
24.8 min
Other means
26.4 min
23.7 min
Public transportation
45.1 min
41.9 min
Private vehicle occupancy
Type
Phoenix
Virginia Beach
Average
1.2
1.1
Drove alone
86.4%
90.3%
In 2 person carpool
9.6%
8%
In 3 person carpool
2%
1.3%
In 4 person carpool
1.5%
0.2%
In 5-6 person carpool
0.3%
0.1%
In 7+ person carpool
0.3%
0%
How many people usually rode to work in the car, truck or van.
Real Estate
Real estate in Phoenix is generally more affordable than in Virginia Beach. Virginia Beach, however, offers a larger variety of waterfront properties. The appreciation rate on property is also comparatively higher in Virginia Beach.
Neighborhoods
Phoenix features diverse neighborhoods from the upscale Biltmore Area to the artsy Roosevelt Row. Virginia Beach offers a mix of suburban, urban, and seaside living environments, with affluent neighborhoods like Alanton and Bay Colony.
Houses and residents
Type
Phoenix
Virginia Beach
Houses
644,625
190,981
Average household size (people)
2.8
2.6
Median year apartment built
1987
1988
Median year house/condo built
1983
1983
Length of stay in the house since moving in
11.1 years
13.5 years
Houses occupied
602,039 (93.4%)
182,775 (95.7%)
Houses occupied by owners
354,237 (58.8%)
119,144 (65.2%)
Houses occupied by renters
247,802 (41.2%)
63,631 (34.8%)
Median rent asked for vacant for-rent units
$1,605
$1,833
Median monthly housing costs
$1,284
$1,490
Median price asked for vacant for-sale houses and condos
$375,817
$508,833
Estimated median house or condo value
$352,600
$328,500
Median numbers of rooms
5.2
6
Median number of rooms in apartments
4
4.6
Median number of rooms in houses and condos
6.1
7
Median house price - detached houses
$452,968
$459,164
Median house price - in 2-unit structures
Over $1,000,000
$200,674
Median house price - in 3-to-4-unit structures
$229,335
$279,464
Median house price - in 5 or more unit structures
$299,875
$229,647
Median house price - mobile homes
$159,046
$143,239
Median house price - occupied boats, rvs, vans etc.
Over $1,000,000
$85,917
Median house price - Townhouses or other attached units
$300,398
$261,878
Median house price - All housing units
$429,075
$401,957
Median house age
36
36
Renting percentage
42.4%
34.7%
Housing density (houses/condos per square mile)
1,357.5
769.2
House value disparities
30.8%
29%
Household income disparities
43.9%
40.6%
Median household income for houses/condes with a mortgage
$96,609
$104,941
Median household income for apartments without a mortgage
$63,626
$82,507
Housing units without a mortgage
3,634 (1.5%)
2,373 (2.6%)
Housing units with both a second mortgage and home equity loan
12,949 (5.2%)
9,070 (10%)
Housing units with a mortgage
246,434 (98.5%)
88,748 (97.4%)
Housing units with a home equity loan
624 (0.2%)
287 (0.3%)
Housing units with a second mortgage
16,890 (6.8%)
10,952 (12%)
House/condo owner moved in on average (years ago)
8
10
House/condo renter moved in on average (years ago)
1
1
Housing units lacking complete kitchen facilities
1.2%
1%
Housing units lacking complete plumbing facilities
0.7%
0.4%
Housing units in structures
Housing units in structures
Phoenix
Virginia Beach
One, detached
60.3%
53.2%
One, attached
4.9%
18.3%
Two
1.4%
1.7%
3 or 4
4.4%
4.6%
5 to 9
5.0%
9.0%
10 to 19
5.3%
4.5%
20 to 49
4.1%
2.1%
50 or more
11.3%
5.4%
Mobile homes
3.1%
1.1%
Boats, RVs, vans, etc.
0.2%
0.0%
Median real estate property taxes paid for housing units
Self-employed workers in own not incorporated business
48,122
9,992
State government workers
30,385
6,577
Unpaid family workers
1,048
251
Industries and Occupations
In Phoenix, high-tech industries, including information technology, are growing rapidly, while tourism and health care continue to offer numerous job opportunities. Virginia Beach's economy is greatly influenced by defense and military, tourism, education, and health care sectors.
Both Phoenix and Virginia Beach have a wide selection of health-care facilities. Phoenix's Mayo Clinic and Virginia Beach's Sentara Princess Anne Hospital rank among the top hospitals in their respective states.
Health (county statistics)
Type
Phoenix
Virginia Beach
General health status score of residents in this county from 1 (poor) to 5 (excellent)
Phoenix boasts a sprawling layout, with more space and less traffic congestion than Virginia Beach. Virginia Beach, on the other hand, offers a blend of urban and coastal infrastructure, with easy access to beaches.
Infrastructure
Type
Phoenix
Virginia Beach
Hospitals
48
7
TV stations
22
24
Bank branches located here
263
96
Bank institutions located here
41
16
Main business address for public companies
41
2
Drinking water stations with no reported violations in the past
2
6
Drinking water stations with reported violations in the past
HMDA - Conventional home purchase loans - Applications denied
Year
Phoenix
Virginia Beach
1999
5,846
0
2000
4,847
0
2001
3,823
0
2002
3,472
0
2003
5,750
941
2004
9,848
1,388
2005
15,879
1,545
2006
18,392
1,502
2007
9,797
1,073
2008
3,130
340
2009
1,614
167
Culture and Food
Phoenix exhibits a fusion of cultures, featuring a blend of southern and western influences in their cuisine like the Southwest style pizza. Virginia Beach, renowned for its seafood, offers a unique coastal culture and culinary experience.
Sports Teams
Phoenix, being larger and more populous, is home to multiple major league sports teams including the Arizona Cardinals (NFL), Phoenix Suns (NBA), and Arizona Diamondbacks (MLB). Virginia Beach has minor league and semi-pro teams but is close to other cities with major league teams.


 Phoenix, AZ
 Virginia Beach, VA