Portland, Oregon and East Seattle, Washington are two vibrant cities on the West Coast. Each offers a unique living experience with distinct culture, economy, and public services. The following comparison might be useful for those considering a move to either of these cities, as well as potential tourists. The comparison will include essential aspects such as crime and safety, weather, cost of living, education, work economy, infrastructure, and other relevant pillars.
Portland, OR has seen a rise in certain types of crimes recently, particularly property crime and instances of public disorder. However, the city is generally safe and has a strong community engagement. East Seattle, in contrast, has relatively lower crime rates, especially in suburban neighborhoods. However, like any city, some neighborhoods might be less safe than others.
Cost of Living
The cost of living is generally high in both cities, largely driven by housing costs. However, East Seattle can be more expensive than Portland in terms of housing prices, health costs, groceries, and utility expenses. Nonetheless, Portland has seen a rapid increase in living costs in recent years.
Income Tax
Oregon has a state income tax that applies to Portland residents. However, Washington state, including East Seattle, does not have a state income tax, which can be more appealing to high-income individuals.
Property Tax
Both cities have significant property taxes, with Portland slightly higher than East Seattle. However, this can vary depending on the specific neighborhood and property value.
Sales Tax
Washington State has a sales tax, which applies to East Seattle, but there is no local sales tax. Meanwhile, Oregon, including Portland, does not have a sales tax, which makes shopping a bit less expensive.
Income
Type
Portland
East Seattle
Estimated median household income
$79,057
$135,835
Estimated per capita income
$49,003
$77,151
Cost of living index (U.S. average is 100)
106.5
128.6
If you make $50,000 in Portland, you will have to make $60,376 in East Seattle to maintain the same standard of living.
Geographical Conditions
Both cities are surrounded by natural beauty. Portland is known for its parks, bike paths, and proximity to both mountains and the coast. East Seattle offers great views of Lake Washington and the Cascade Mountains.
Geographical information
Type
Portland
East Seattle
Land area
134.3 sq. miles
217.1 sq. miles
Population density
4,773.4 people per sq. mile
2,361.6 people per sq. mile
Relative area comparison
Portland, OR East Seattle, WA
Education
Both cities have strong educational systems. Public schools in East Seattle are rated highly, and the city is home to the University of Washington, one of the top universities in the country. Portland also offers top-tier education with public, private, and charter schools, along with prestigious higher education institutions like Reed College and Portland State University.
Portland and East Seattle have strong economies anchored by diverse sectors. In Portland, the economy is driven by the tech industry, manufacturing, and healthcare. East Seattle is a global tech hub with Microsoft and Amazon headquarters, providing a massive boost to the local economy.
Biggest Employers
In Portland, the biggest employers include Intel, Providence Health & Services, and Oregon Health & Science University. In East Seattle, Microsoft, Amazon, and the University of Washington stand as the largest employers.
In Portland (Multnomah County), 75.4% voted for Democrats and 20.6% for Republicans in 2012 Presidential Election. In East Seattle (King County), 69.0% voted for Democrats and 28.5% for Republicans.
Elections
Type
Democrats
Republicans
Other
Year
Portland
East Seattle
Portland
East Seattle
Portland
East Seattle
2020
79.2%
75.1%
17.9%
22.3%
2.9%
2.6%
2016
73.3%
70.0%
17.0%
21.1%
9.7%
8.9%
2012
75.4%
69.0%
20.6%
28.5%
4.0%
2.5%
2008
76.7%
70.2%
20.6%
28.1%
2.7%
1.7%
2004
71.6%
65.1%
27.1%
33.8%
1.3%
1.1%
2000
63.8%
60.3%
28.3%
34.5%
7.9%
5.2%
1996
59.2%
56.4%
26.3%
31.4%
14.4%
12.2%
Breakdown of population affiliated with a religious congregation
Type
Adherents
Congregations
Religion
Portland
East Seattle
Portland
East Seattle
CATHOLIC CHURCH
15.2%
14.4%
6.7%
4.9%
EVANGELICAL LUTHERAN CHURCH IN AMERICA
0.9%
1.3%
4.0%
4.7%
SEVENTH DAY ADVENTIST CHURCH
0.9%
0.6%
3.4%
2.3%
AMERICAN BAPTIST CHURCHES IN THE USA
0.8%
0.6%
2.7%
2.9%
EPISCOPAL CHURCH
0.7%
0.8%
2.2%
2.4%
SOUTHERN BAPTIST CONVENTION
0.5%
0.3%
3.8%
3.8%
LUTHERAN CHURCH
0.4%
0.5%
2.2%
2.0%
MUSLIM ESTIMATE
0.3%
0.6%
1.0%
1.4%
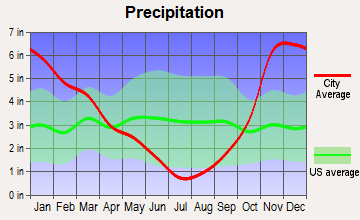
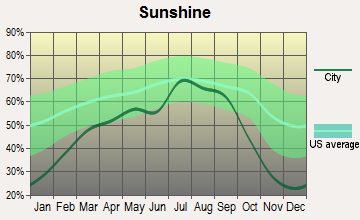
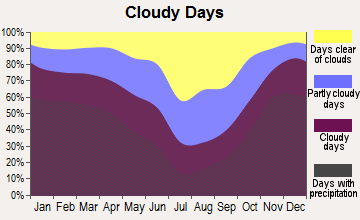
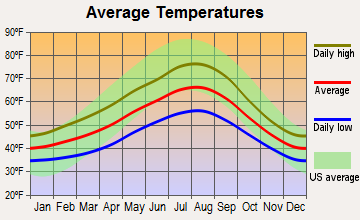
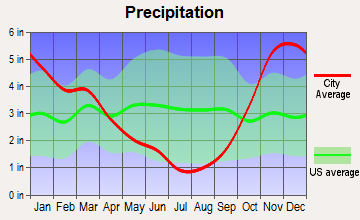
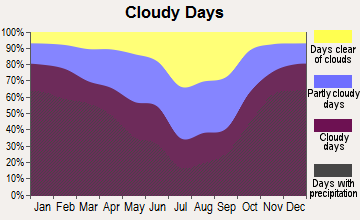
Weather
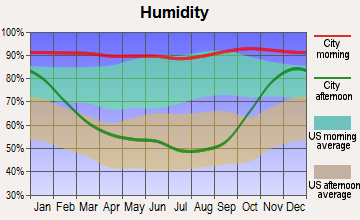
Both cities are in the Pacific Northwest and therefore share a similar climate–mild, wet winters and warm, dry summers. However, Seattle experiences slightly colder temperatures due to its northern location. Both cities can be quite cloudy and rainy, but Portland has slightly more sunny days per year.
Weather and climate
Type
Portland
East Seattle
Temperature - Average
53.9°F
52.5°F
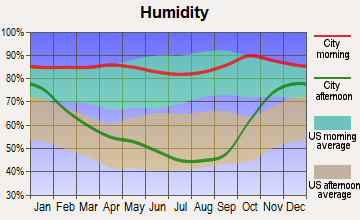
Humidity - Average morning or afternoon humidity
76.5%
78.5%
Humidity - Differences between morning and afternoon humidity
42%
38%
Humidity - Maximum monthly morning or afternoon humidity
86%
86%
Humidity - Minimum monthly morning or afternoon humidity
44%
48%
Precipitation - Yearly average
41.6 in
36.8 in
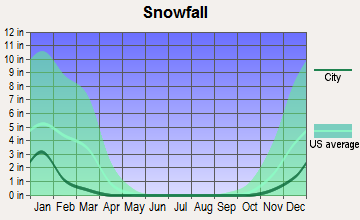
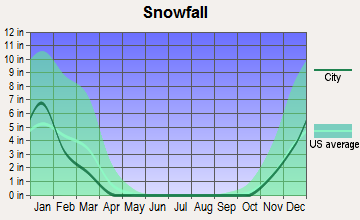
Snowfall - Yearly average
12.8 in
21.4 in
Clouds - Number of days clear of clouds
11.3%
11.7%
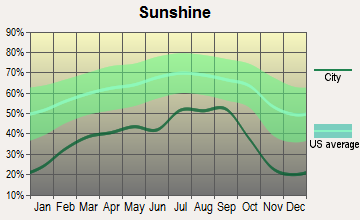
Sunshine amount - Average
54.7%
49.4%
Sunshine amount - Differences during a year
52%
44%
Sunshine amount - Maximum monthly
72%
64%
Sunshine amount - Minimum monthly
20%
20%
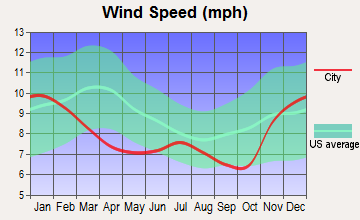
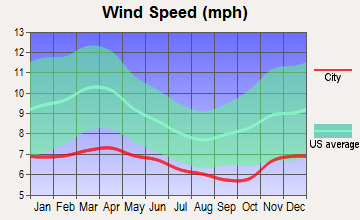
Wind speed - Average
8.1 mph
8.6 mph
Average climate in Portland, Oregon
Average climate in East Seattle, Washington
Air pollution
Type
AQI
CO
NO2
OZONE
PB
PM10
PM25
SO2
Year
Portland
East Seattle
Portland
East Seattle
Portland
East Seattle
Portland
East Seattle
Portland
East Seattle
East Seattle
Portland
East Seattle
Portland
East Seattle
2018
79
85
0.26
0.21
8.8
10.6
21.4
21.0
N/A
N/A
N/A
N/A
7.2
5.1
0.4
0.7
2017
93
100
0.26
0.23
8.7
11.1
22.6
21.2
N/A
N/A
N/A
N/A
7.1
4.6
0.4
0.3
2016
72
67
0.25
0.22
8.7
11.9
20.8
20.2
N/A
N/A
N/A
N/A
5.2
3.8
0.2
0.6
2015
91
88
0.28
0.23
9.2
10.8
20.1
19.4
N/A
N/A
N/A
N/A
7.4
5.6
0.5
0.8
2014
91
75
0.24
0.24
8.5
11.5
21.0
19.5
N/A
N/A
N/A
N/A
6.3
5.7
0.8
N/A
2013
85
81
0.29
0.24
9.6
N/A
17.9
17.2
N/A
N/A
N/A
N/A
8.6
5.9
1.1
0.8
2012
78
83
0.30
0.23
9.1
N/A
21.0
19.3
N/A
N/A
N/A
N/A
7.4
5.2
0.6
1.0
2011
89
73
0.34
0.24
9.4
N/A
18.5
18.6
N/A
N/A
N/A
N/A
8.1
5.2
0.8
1.1
2010
80
73
0.33
0.24
9.1
N/A
19.4
18.0
N/A
N/A
N/A
N/A
6.4
4.4
1.4
1.1
2009
95
94
0.32
0.27
10.2
N/A
20.0
18.3
N/A
N/A
N/A
N/A
8.4
6.0
1.6
1.4
2008
101
80
0.34
0.30
10.9
N/A
19.2
17.8
N/A
N/A
N/A
N/A
8.8
5.4
1.0
1.3
2007
101
85
0.35
0.30
11.4
N/A
18.1
17.7
N/A
N/A
19.0
N/A
8.8
6.4
1.3
1.5
2006
106
102
N/A
N/A
N/A
N/A
N/A
18.4
N/A
N/A
21.1
N/A
7.8
7.2
1.5
N/A
2005
96
104
N/A
0.80
N/A
18.3
N/A
N/A
N/A
N/A
22.9
N/A
8.9
7.6
1.7
3.5
2004
92
110
N/A
0.81
N/A
17.9
N/A
N/A
N/A
N/A
N/A
N/A
9.8
8.3
N/A
3.0
2003
77
100
N/A
0.85
N/A
18.5
N/A
N/A
0.008
N/A
N/A
N/A
8.6
8.3
N/A
2.4
2002
68
90
N/A
1.07
N/A
19.3
N/A
N/A
0.010
N/A
N/A
N/A
8.4
10.7
N/A
2.7
2001
73
91
N/A
1.08
N/A
20.5
N/A
N/A
0.008
0.004
N/A
N/A
8.9
11.1
N/A
3.7
2000
52
99
N/A
1.21
N/A
20.9
N/A
N/A
N/A
N/A
N/A
N/A
N/A
12.1
N/A
3.2
Natural disasters
Type
Portland
East Seattle
Tornado activity compared to U.S. average
8.4%
5.5%
Earthquake activity compared to U.S. average
1,575.5%
1,403%
Natural disasters compared to U.S. average
9%
30%
Transportation
Public transportation is robust in both locations. Portland offers MAX light rail, streetcars, and extensive bus services. East Seattle's transport options include buses, light rail, and a ferry service. Portland is noted as a bike-friendly city, while East Seattle is more car-dependent.
Transport
Type
Portland
East Seattle
Amtrak stations
1
0
Amtrak stations nearby
3
3
FAA registered aircraft
804
0
FAA registered aircraft manufacturers and dealers
6
0
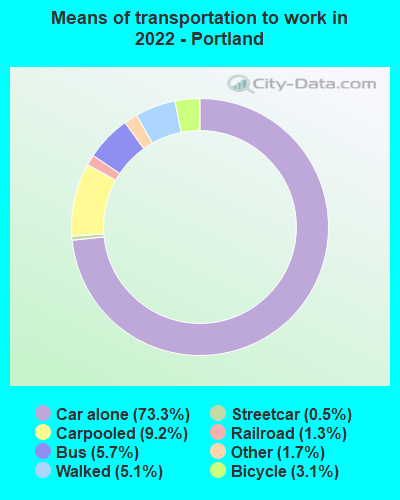
Means of transportation to work
Type
Portland
East Seattle
Bicycle
3.1%
0.3%
Bus
4.6%
5%
Carpooled
9.4%
11%
Car alone
76.2%
76.3%
Motorcycle
0.2%
0.1%
Railroad
0.9%
0%
Streetcar
0.3%
0%
Walked
3.8%
1.7%
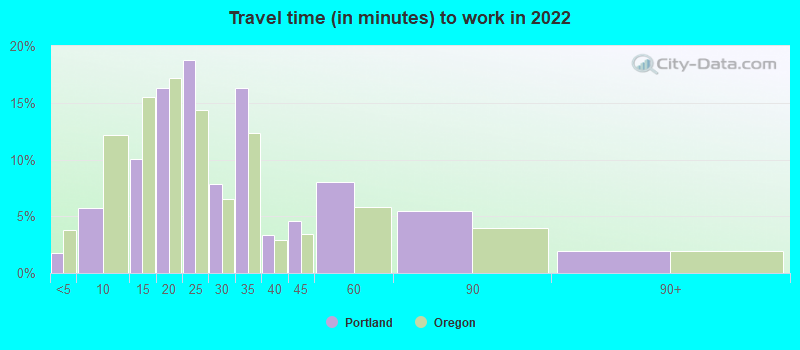
Average travel time to work
Type
Portland
East Seattle
Average
28.8 min
25 min
Real Estate
Real estate prices are generally higher in East Seattle compared to Portland due to the presence of major tech companies. Higher demand has led to a significant increase in prices over the years. Portland has lower median property prices, but an influx of new residents has led to a tight housing market, pushing prices up.
Neighborhoods
Both cities have diverse neighborhoods tailored to different lifestyles. In Portland, the vibrant Pearl District and artsy Alberta are notable. East Seattle offers upscale neighborhoods like Bellevue and Redmond, known for their high quality of life.
Houses and residents
Type
Portland
East Seattle
Houses
303,483
199,933
Average household size (people)
2.3
2.5
Houses occupied
286,734 (94.5%)
191,630 (95.8%)
Houses occupied by owners
153,121 (53.4%)
128,209 (66.9%)
Houses occupied by renters
133,613 (46.6%)
63,421 (33.1%)
Median rent asked for vacant for-rent units
$1,917
$2,281
Median price asked for vacant for-sale houses and condos
$248,225
$820,468
Estimated median house or condo value
$520,200
$877,325
Median number of rooms in apartments
3.4
3.5
Median number of rooms in houses and condos
6.2
7.8
Housing density (houses/condos per square mile)
2,259.4
920.9
Household income disparities
44.7%
34.9%
Housing units without a mortgage
2,404 (2.2%)
22,582 (20.8%)
Housing units with both a second mortgage and home equity loan
11,239 (10.1%)
352 (0.3%)
Housing units with a mortgage
108,864 (97.8%)
85,751 (79.2%)
Housing units with a home equity loan
396 (0.4%)
11,674 (10.8%)
Housing units with a second mortgage
12,832 (11.5%)
9,796 (9%)
Housing units lacking complete kitchen facilities
1.2%
0.8%
Housing units lacking complete plumbing facilities
Self-employed workers in own not incorporated business
25,437
16,907
State government workers
15,615
10,270
Unpaid family workers
688
584
Industries and Occupations
Portland is home to major industry players like Nike and Intel, offering job opportunities in different fields. The tech industry dominates East Seattle, with significant employment opportunities at giants like Microsoft and Amazon. Other critical sectors include healthcare, education, and professional services.
Top-quality healthcare is accessible in both Portland and East Seattle. Portland's health services are renowned, particularly the Oregon Health & Science University. East Seattle residents have access to some of the nation's best healthcare providers, including the University of Washington Medical Center.
Health (county statistics)
Type
Portland
East Seattle
General health status score of residents in this county from 1 (poor) to 5 (excellent)
Both cities have advanced infrastructure standards. East Seattle, as part of the greater Seattle area, has more expansive infrastructure due to its size, including King County Metro and Sound Transit services, along with a more extensive road network. Portland's infrastructure highlights include a well-planned transit system and bike lanes that promote a cycling culture.
Infrastructure
Type
Portland
East Seattle
TV stations
18
16
Schools
School facilities
Type
Portland
East Seattle
Private elementary/middle schools
45
1
Private high schools
27
1
Public elementary/middle schools
126
2
Public high schools
21
2
Colleges/Universities
37
0
Culture and Food
Both cities are known for their vibrant culture and food scenes. Portland is famous for its food carts, microbreweries, and coffee culture. East Seattle boasts an array of global cuisines, great seafood, and a thriving wine industry.
Sports Teams
Portland's main professional sports team is the Trail Blazers (NBA), while Seattle offers a wider array with the Seahawks (NFL), Mariners (MLB), Sounders (MLS), and the Kraken (NHL).
 Portland, OR
 East Seattle, WA