Comparing Queens, New York, and Columbus, Ohio encapsulates contrasting American experiences. Queens presents a bustling urban landscape known for its diversity and culture, while Columbus offers a mix of midwestern charm and city living. Each city has its unique advantages in safety, education, economy, and cultural richness, providing a distinct lifestyle for residents and visitors alike. This comparison will take a closer look at these characteristics to help you understand which city may suit your needs and expectations better, whether you're considering relocating or just visiting.
Queens, as part of New York City, has seen a declining crime rate over the years, though it varies by neighborhood. It's critical to research specific areas to understand the safety situation better. Conversely, Columbus does struggle with higher crime rates than the national average, mainly in specific neighborhoods, so similar caution is advised. However, both cities have robust police forces and resources dedicated to ensuring resident and visitor safety.
Cost of Living
The cost of living in Queens is significantly higher than the national average, with housing being the major contributor. Conversely, Columbus has a lower cost of living, making it more affordable for many individuals and families. Groceries, health care, and other essentials are also less expensive in Columbus compared to Queens.
Income Tax
New York imposes both a state and a city income tax, which can increase the total tax burden for Queens residents. Ohio has a lower state income tax rate, and Columbus also imposes a municipal income tax.
Property Tax
Property taxes in Queens are relatively lower as compared to Columbus. Although New York's overall taxes are higher, property tax is an exception due to New York's complex assessment system.
Sales Tax
Sales tax in Queens is higher at 8.875% compared to Columbus's 7.5%. This is mainly due to higher taxes in New York State and New York City.
Income
Type
Queens
Columbus
Estimated median household income
$73,262
$58,202
Estimated per capita income
$34,969
$32,392
Cost of living index (U.S. average is 100)
173.2
96.1
If you make $50,000 in Columbus, you will have to make $90,114 in Queens to maintain the same standard of living.
Geographical Conditions
Queens, located on Long Island, is surrounded by water and has several beautiful parks. Columbus, known as the flattest city in the U.S., also boasts an impressive set of parks and rivers.
Geographical information
Type
Queens
Columbus
Land area
109.2 sq. miles
210.3 sq. miles
Population density
20,847 people per sq. mile
4,311.3 people per sq. mile
Relative area comparison
Queens, NY Columbus, OH
Education
Queens boasts a robust education system with some of the best public and private schools in NYC. It’s home to St. John's University and Queens College. Columbus similarly offers quality education, highlighted by The Ohio State University, one of the largest campuses in the U.S. Both cities also have a range of vocational and specialty schools.
Both locations offer robust job markets. Queens falls within the dynamic NYC economy, featuring sectors like finance, media, and technology. Columbus, however, has a diverse local economy with strengths in education, government, and healthcare, thanks to the presence of The Ohio State University and several large hospitals.
Biggest Employers
In Queens, some of the biggest employers include JetBlue Airways, Mount Sinai Queens, and the NYC Department of Education. In Columbus, top employers are The Ohio State University, Nationwide Insurance, and OhioHealth.
In Queens (Queens County), 79.2% voted for Democrats and 20.0% for Republicans in 2012 Presidential Election. In Columbus (Franklin County), 60.8% voted for Democrats and 37.9% for Republicans.
Elections
Type
Democrats
Republicans
Other
Year
Queens
Columbus
Queens
Columbus
Queens
Columbus
2020
72.3%
64.7%
27.0%
33.4%
0.7%
1.9%
2016
75.4%
59.8%
21.8%
33.9%
2.8%
6.2%
2012
79.2%
60.8%
20.0%
37.9%
0.8%
1.3%
2008
75.4%
59.8%
24.3%
39.0%
0.3%
1.2%
2004
71.8%
54.5%
27.5%
45.2%
0.8%
0.3%
2000
75.2%
48.9%
22.0%
47.9%
2.8%
3.2%
1996
72.9%
48.1%
21.1%
44.5%
6.0%
7.3%
Breakdown of population affiliated with a religious congregation
Type
Adherents
Congregations
Religion
Queens
Columbus
Queens
Columbus
CATHOLIC CHURCH
30.4%
13.2%
7.7%
5.6%
MUSLIM ESTIMATE
3.7%
1.3%
4.4%
1.9%
SEVENTH DAY ADVENTIST CHURCH
0.6%
0.4%
3.4%
2.0%
AMERICAN BAPTIST CHURCHES IN THE USA
0.5%
1.0%
2.5%
3.3%
EPISCOPAL CHURCH
0.4%
0.4%
2.1%
1.3%
EVANGELICAL LUTHERAN CHURCH IN AMERICA
0.3%
1.6%
2.6%
3.7%
SOUTHERN BAPTIST CONVENTION
0.2%
1.6%
3.8%
6.8%
VINEYARD USA
0.0%
1.3%
0.1%
1.2%
Weather
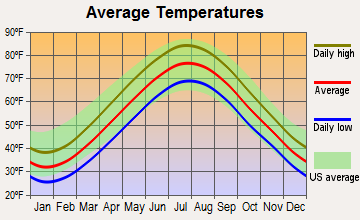
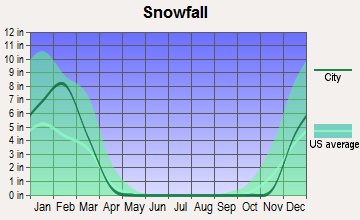
Weather in Queens offers four distinct seasons, with chilly winters and warm, sometimes hot, summers. Winter snowfall can be significant, requiring good preparation. On the other hand, Columbus experiences a more moderate climate. Winters are generally milder, and summers are warm without the extreme heat sometimes seen in Queens.
Weather and climate
Type
Queens
Columbus
Temperature - Average
54.6°F
52.8°F
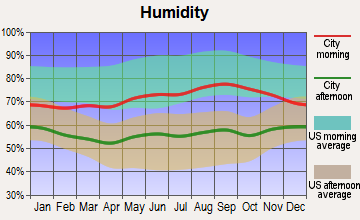
Humidity - Average morning or afternoon humidity
68.5%
74.8%
Humidity - Differences between morning and afternoon humidity
25.1%
34%
Humidity - Maximum monthly morning or afternoon humidity
76.3%
86%
Humidity - Minimum monthly morning or afternoon humidity
51.1%
52%
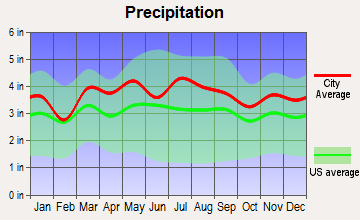
Precipitation - Yearly average
44.5 in
39.3 in
Snowfall - Yearly average
52.7 in
56.6 in
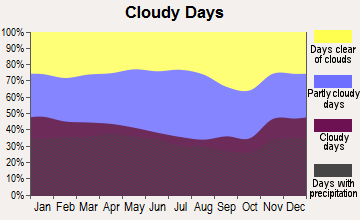
Clouds - Number of days clear of clouds
16.3%
12%
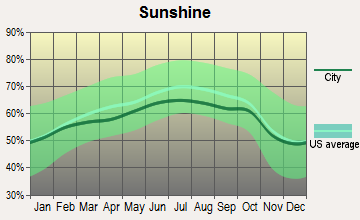
Sunshine amount - Average
60.2%
49.7%
Sunshine amount - Differences during a year
20%
27%
Sunshine amount - Maximum monthly
64%
55%
Sunshine amount - Minimum monthly
44%
28%
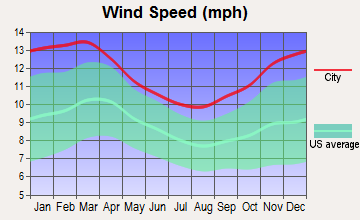
Wind speed - Average
11.6 mph
8.2 mph
Average climate in Queens, New York
Average climate in Columbus, Ohio
Air pollution
Type
AQI
CO
NO2
OZONE
PB
PM10
PM25
SO2
Year
Queens
Columbus
Queens
Columbus
Queens
Columbus
Queens
Columbus
Queens
Queens
Columbus
Queens
Columbus
Queens
Columbus
2018
97
69
0.26
0.11
14.7
10.0
25.4
33.8
N/A
N/A
N/A
N/A
6.4
6.0
0.4
0.0
2017
98
68
0.23
0.16
15.4
9.6
25.8
28.7
N/A
N/A
N/A
N/A
6.4
5.5
0.5
0.1
2016
97
76
0.24
0.17
16.0
10.6
25.5
28.5
N/A
N/A
N/A
N/A
6.7
5.6
0.6
0.1
2015
104
74
0.26
0.16
17.4
11.3
24.1
27.0
N/A
N/A
N/A
N/A
7.9
6.1
0.8
0.1
2014
99
82
0.25
0.20
17.0
11.0
24.3
28.5
N/A
N/A
N/A
N/A
7.8
7.4
1.1
0.5
2013
101
78
0.23
N/A
17.7
8.9
25.8
29.6
N/A
N/A
N/A
N/A
8.7
7.8
1.2
0.6
2012
105
87
0.26
N/A
17.6
N/A
25.8
32.9
N/A
N/A
N/A
N/A
9.1
8.9
1.8
N/A
2011
112
89
0.27
N/A
20.4
N/A
24.2
28.1
N/A
N/A
N/A
N/A
10.6
8.9
2.7
N/A
2010
112
90
0.35
N/A
19.4
N/A
23.6
30.5
N/A
N/A
N/A
N/A
10.3
9.1
2.9
N/A
2009
107
61
0.24
N/A
21.0
N/A
21.0
28.7
N/A
N/A
N/A
N/A
9.7
N/A
3.4
N/A
2008
113
65
0.44
N/A
22.6
N/A
22.0
31.2
0.013
N/A
N/A
N/A
11.0
N/A
4.1
1.8
2007
121
80
0.46
N/A
22.9
N/A
20.2
30.8
0.016
N/A
N/A
N/A
11.6
N/A
4.9
2.8
2006
120
75
0.46
N/A
23.5
N/A
20.3
30.0
0.018
N/A
N/A
23.7
12.7
N/A
5.3
3.3
2005
110
87
0.54
N/A
25.5
N/A
19.7
29.6
N/A
N/A
N/A
27.5
N/A
N/A
6.7
4.1
2004
107
77
0.55
N/A
25.1
N/A
18.2
27.8
0.030
N/A
N/A
24.6
N/A
N/A
5.8
4.4
2003
110
91
0.63
N/A
26.9
N/A
18.9
26.4
0.022
N/A
26.9
23.9
N/A
N/A
7.0
4.1
2002
124
93
0.58
N/A
27.9
N/A
19.2
31.3
0.008
N/A
25.7
25.7
N/A
N/A
6.5
4.1
2001
124
84
0.60
N/A
28.8
N/A
19.3
29.2
0.020
N/A
24.5
25.9
N/A
N/A
7.8
3.5
2000
115
57
0.67
N/A
28.4
N/A
17.6
N/A
0.022
N/A
22.2
23.5
N/A
N/A
7.3
3.7
Natural disasters
Type
Queens
Columbus
Tornado activity compared to U.S. average
54%
119.1%
Earthquake activity compared to U.S. average
30.6%
96.1%
Natural disasters compared to U.S. average
19%
16%
Transportation
Public transportation in Queens is comprehensive, with easy access to subways and buses. Columbus's public transportation options are growing, with its COTA bus system and bike sharing.
Transport
Type
Queens
Columbus
Amtrak stations
2
1
Amtrak stations nearby
3
1
FAA registered aircraft
4
415
FAA registered aircraft manufacturers and dealers
0
4
Means of transportation to work
Type
Queens
Columbus
Bicycle
0.3%
0.6%
Bus
10%
1.6%
Carpooled
10.2%
7.4%
Car alone
34.3%
86.7%
Railroad
2.2%
0%
Streetcar
0.2%
0%
Subway
34.3%
0%
Taxicab
0.7%
0.1%
Walked
5.7%
2.2%
Average travel time to work
Type
Queens
Columbus
Average
44 min
26.1 min
Real Estate
The real estate market in Queens is extremely competitive with high prices typical for NYC. On the flip side, Columbus offers affordable homes and a more relaxed pace of life, making it a faster-growing housing market.
Neighborhoods
Queens is famous for its diversity, with neighborhoods like Astoria noted for its Greek community, and Jackson Heights for its Indian community. Columbus offers a variety of neighborhoods as well, from the lively Short North Arts District to the family-friendly suburb of Bexley.
Houses and residents
Type
Queens
Columbus
Houses
817,250
422,120
Average household size (people)
2.8
2.3
Houses occupied
782,664 (95.8%)
390,605 (92.5%)
Houses occupied by owners
334,894 (42.8%)
175,427 (44.9%)
Houses occupied by renters
447,770 (57.2%)
215,178 (55.1%)
Median rent asked for vacant for-rent units
$1,666
$1,371
Median price asked for vacant for-sale houses and condos
$615,765
$195,022
Estimated median house or condo value
$642,000
$219,200
Median number of rooms in apartments
3.7
4.2
Median number of rooms in houses and condos
5.4
6.3
Renting percentage
57%
53%
Housing density (houses/condos per square mile)
7,481.6
2,007.5
Household income disparities
44.9%
42.4%
Housing units without a mortgage
64,617 (34.6%)
4,290 (3.3%)
Housing units with both a second mortgage and home equity loan
311 (0.2%)
10,651 (8.2%)
Housing units with a mortgage
122,366 (65.4%)
125,487 (96.7%)
Housing units with a home equity loan
9,927 (5.3%)
775 (0.6%)
Housing units with a second mortgage
10,707 (5.7%)
13,558 (10.4%)
Housing units lacking complete kitchen facilities
1%
1.6%
Housing units lacking complete plumbing facilities
Self-employed workers in own not incorporated business
48,383
20,915
State government workers
21,536
31,881
Unpaid family workers
2,382
724
Industries and Occupations
In Queens, the occupations are diverse due to its location in NYC. You'll find careers in finance, technology, healthcare, education, and more. Columbus's job scene is quite varied as well, with many residents working in healthcare, education, and government roles.
Both cities offer excellent healthcare facilities. Queens is part of the extensive New York healthcare system, while Columbus is home to renowned healthcare institutions like Wexner Medical Center.
Health (county statistics)
Type
Queens
Columbus
General health status score of residents in this county from 1 (poor) to 5 (excellent)
Queens benefits from being part of the NYC infrastructure, with world-class utilities and public amenities. It has an aging but efficient public transportation system. Columbus has been investing heavily in its infrastructure, including improved public transport and highway system, expanding to accommodate the city's rapid growth.
Infrastructure
Type
Queens
Columbus
Hospitals
1
47
TV stations
30
14
Schools
School facilities
Type
Queens
Columbus
Private elementary/middle schools
8
34
Private high schools
1
12
Public elementary/middle schools
6
162
Public high schools
2
64
Colleges/Universities
1
37
Culture and Food
Queens is famed for its cultural and foodie scene, thanks to its diversity. You'll find everything from Michelin-star restaurants to renowned food trucks. Columbus is a burgeoning food city, with a great farm-to-table scene and breweries.
Sports Teams
Queens is home to the Mets (MLB), while Columbus hosts the Blue Jackets (NHL), and the Crew (MLS). Both cities have passionate sports cultures.


 Queens, NY
 Columbus, OH