Queens, NY and Dallas, TX have unique attributes as they cater to different types of lifestyles. Queens, being one of the five boroughs of New York City, offers a diverse, multicultural urban living experience along with higher costs of living. Dallas, on the other hand, radiates a mix of modern city living and and Southern charm, while being more affordable. A comparison of safety, weather, living and education costs, economics, infrastructure, industries, top employers, real-estate, neighborhood qualities, transportation, taxes, food culture, sports, geographic conditions and healthcare can offer a clearer perspective for those considering a move or just a visit.
Safety varies across different parts of both Queens and Dallas. In general, NY has a lower crime rate compared to Texas and Queens is often considered safer than other boroughs. Dallas, although improving, does have higher crime rates compared to many other major cities, but this also varies widely by neighborhood.
Cost of Living
The cost of living in Queens is significantly higher than Dallas. Housing, in particular, is much more expensive in Queens along with other necessities such as groceries, transportation, and health care.
Income Tax
New York City residents pay a city income tax in addition to state and federal income taxes. Texas does not have a state income tax and Dallas does not have a city income tax.
Property Tax
NYC Property tax rates are relatively low compared to the national average, but because property values are high in Queens, overall property taxes can be substantial. Dallas has higher property tax rates, but because property values are lower, the overall burden may be less.
Sales Tax
New York State has a sales tax rate of 4% and an additional city sales tax of 4.5% in Queens. In Dallas, the combined state and city sales tax rate is 8.25%.
Income
Type
Queens
Dallas
Estimated median household income
$73,262
$57,995
Estimated per capita income
$34,969
$38,479
Cost of living index (U.S. average is 100)
173.2
96.1
If you make $50,000 in Dallas, you will have to make $90,114 in Queens to maintain the same standard of living.
Geographical Conditions
Queens is largely flat and urban, lying on the western portion of Long Island. Dallas is relatively flat with a mix of grasslands, prairie, and man-made lakes.
Geographical information
Type
Queens
Dallas
Land area
109.2 sq. miles
342.5 sq. miles
Population density
20,847 people per sq. mile
3,761.4 people per sq. mile
Relative area comparison
Queens, NY Dallas, TX
Education
Queens provides access to a wide array of top-notch public and private schools, colleges, and universities, including those in the rest of NYC. In Dallas, the school system is also well-rated but the college scene is not as vibrant as NYC.
Both Queens and Dallas have strong economies. Queens benefits from its proximity to Manhattan, being part of NYC which is a significant global financial hub. Dallas has a diversified economy with strengths in defense, financial services, IT services, telecommunications, and transportation.
Biggest Employers
The largest employers in Queens are City of New York, the U.S. Government and JP Morgan Chase. In Dallas, AMR Corporation (American Airlines), Bank of America and Texas Health Resources top the list.
In Queens (Queens County), 79.2% voted for Democrats and 20.0% for Republicans in 2012 Presidential Election. In Dallas (Dallas County), 57.3% voted for Democrats and 41.8% for Republicans.
Elections
Type
Democrats
Republicans
Other
Year
Queens
Dallas
Queens
Dallas
Queens
Dallas
2020
72.3%
65.1%
27.0%
33.4%
0.7%
1.4%
2016
75.4%
60.8%
21.8%
34.7%
2.8%
4.5%
2012
79.2%
57.3%
20.0%
41.8%
0.8%
1.0%
2008
75.4%
57.4%
24.3%
42.0%
0.3%
0.6%
2004
71.8%
49.0%
27.5%
50.4%
0.8%
0.5%
2000
75.2%
45.0%
22.0%
52.7%
2.8%
2.4%
1996
72.9%
46.0%
21.1%
46.8%
6.0%
7.2%
Breakdown of population affiliated with a religious congregation
Type
Adherents
Congregations
Religion
Queens
Dallas
Queens
Dallas
CATHOLIC CHURCH
30.4%
18.9%
7.7%
2.4%
MUSLIM ESTIMATE
3.7%
3.6%
4.4%
1.1%
SEVENTH DAY ADVENTIST CHURCH
0.6%
0.5%
3.4%
1.7%
AMERICAN BAPTIST CHURCHES IN THE USA
0.5%
0.1%
2.5%
0.2%
EPISCOPAL CHURCH
0.4%
1.0%
2.1%
1.5%
EVANGELICAL LUTHERAN CHURCH IN AMERICA
0.3%
0.3%
2.6%
0.9%
SOUTHERN BAPTIST CONVENTION
0.2%
11.0%
3.8%
31.1%
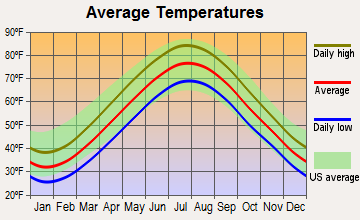
Weather
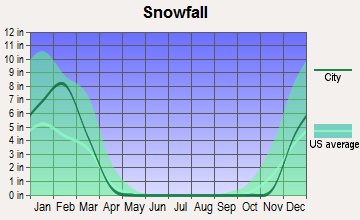
Queens experiences a humid subtropical climate with four distinct seasons, including hot, humid summers and cold winters. Dallas, on the other hand, has a humid subtropical climate as well, but it's much hotter with mild winters. Dallas is also prone to extreme weather such as tornadoes.
Weather and climate
Type
Queens
Dallas
Temperature - Average
54.6°F
66.6°F
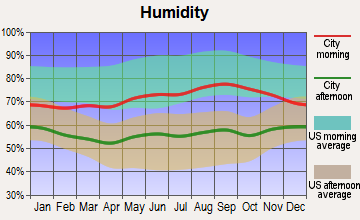
Humidity - Average morning or afternoon humidity
68.5%
71.3%
Humidity - Differences between morning and afternoon humidity
25.1%
34%
Humidity - Maximum monthly morning or afternoon humidity
76.3%
82%
Humidity - Minimum monthly morning or afternoon humidity
51.1%
48%
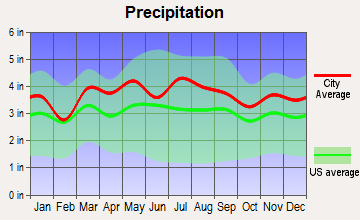
Precipitation - Yearly average
44.5 in
37.3 in
Snowfall - Yearly average
52.7 in
4.2 in
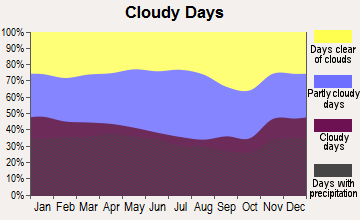
Clouds - Number of days clear of clouds
16.3%
22.8%
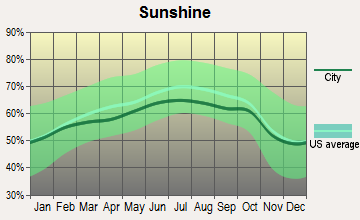
Sunshine amount - Average
60.2%
66.6%
Sunshine amount - Differences during a year
20%
20%
Sunshine amount - Maximum monthly
64%
74%
Sunshine amount - Minimum monthly
44%
54%
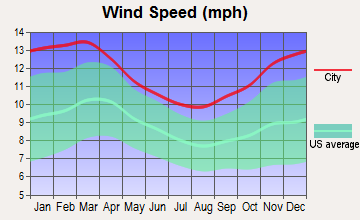
Wind speed - Average
11.6 mph
10.3 mph
Average climate in Queens, New York
Average climate in Dallas, Texas
Air pollution
Type
AQI
CO
NO2
OZONE
PB
PM10
PM25
SO2
Year
Queens
Dallas
Queens
Queens
Dallas
Queens
Dallas
Queens
Dallas
Queens
Queens
Dallas
Queens
Dallas
2018
97
86
0.26
N/A
14.7
5.7
25.4
28.7
N/A
N/A
N/A
N/A
6.4
9.7
0.4
0.4
2017
98
84
0.23
N/A
15.4
5.5
25.8
28.6
N/A
N/A
N/A
N/A
6.4
9.1
0.5
0.3
2016
97
81
0.24
N/A
16.0
6.1
25.5
27.2
N/A
N/A
N/A
N/A
6.7
8.4
0.6
0.2
2015
104
85
0.26
N/A
17.4
6.5
24.1
26.7
N/A
N/A
N/A
N/A
7.9
8.9
0.8
0.3
2014
99
83
0.25
N/A
17.0
6.3
24.3
27.6
N/A
N/A
N/A
N/A
7.8
9.9
1.1
0.3
2013
101
97
0.23
N/A
17.7
7.3
25.8
28.8
N/A
N/A
N/A
N/A
8.7
13.0
1.2
0.2
2012
105
116
0.26
N/A
17.6
8.6
25.8
31.0
N/A
N/A
N/A
N/A
9.1
12.0
1.8
0.3
2011
112
98
0.27
N/A
20.4
9.4
24.2
30.9
N/A
N/A
N/A
N/A
10.6
11.9
2.7
0.6
2010
112
79
0.35
N/A
19.4
9.4
23.6
28.3
N/A
N/A
N/A
N/A
10.3
N/A
2.9
0.7
2009
107
88
0.24
N/A
21.0
9.2
21.0
28.8
N/A
N/A
N/A
N/A
9.7
N/A
3.4
0.5
2008
113
88
0.44
N/A
22.6
9.8
22.0
29.2
0.013
0.121
N/A
N/A
11.0
N/A
4.1
0.5
2007
121
94
0.46
N/A
22.9
11.0
20.2
25.7
0.016
0.070
N/A
N/A
11.6
N/A
4.9
0.3
2006
120
107
0.46
N/A
23.5
10.8
20.3
30.6
0.018
0.106
N/A
N/A
12.7
N/A
5.3
0.7
2005
110
108
0.54
N/A
25.5
13.0
19.7
29.7
N/A
0.142
N/A
N/A
N/A
11.0
6.7
0.9
2004
107
96
0.55
N/A
25.1
12.3
18.2
26.0
0.030
0.099
N/A
N/A
N/A
N/A
5.8
0.8
2003
110
102
0.63
N/A
26.9
13.6
18.9
27.1
0.022
0.121
26.9
N/A
N/A
N/A
7.0
1.0
2002
124
100
0.58
N/A
27.9
14.0
19.2
25.2
0.008
0.080
25.7
N/A
N/A
N/A
6.5
0.4
2001
124
100
0.60
N/A
28.8
14.3
19.3
26.0
0.020
0.069
24.5
N/A
N/A
N/A
7.8
1.0
2000
115
109
0.67
N/A
28.4
14.5
17.6
27.0
0.022
0.092
22.2
N/A
N/A
N/A
7.3
1.1
Natural disasters
Type
Queens
Dallas
Tornado activity compared to U.S. average
54%
254.7%
Earthquake activity compared to U.S. average
30.6%
567%
Natural disasters compared to U.S. average
19%
21%
Transportation
Public transit is excellent in Queens, with extensive bus and subway systems. Dallas has a decent public transport system with buses and light rail, but many choose to drive as it's a car-centric city.
Transport
Type
Queens
Dallas
Amtrak stations
2
1
Amtrak stations nearby
3
1
FAA registered aircraft
4
2
FAA registered aircraft manufacturers and dealers
0
56
Means of transportation to work
Type
Queens
Dallas
Bicycle
0.3%
0.3%
Bus
10%
1.4%
Carpooled
10.2%
10.9%
Car alone
34.3%
83.9%
Railroad
2.2%
0.2%
Streetcar
0.2%
0.1%
Subway
34.3%
0.2%
Taxicab
0.7%
0.1%
Walked
5.7%
1.6%
Average travel time to work
Type
Queens
Dallas
Average
44 min
31.5 min
Real Estate
Real-estate in Queens is on the pricier side, with a mix of row houses, apartments, and condos. Dallas features a range of property types from high-rise apartments to single family homes, generally at a lower cost than Queens.
Neighborhoods
Queens is known for its multicultural neighborhoods, each offering different experiences. Dallas neighborhoods are also diverse, from the high-energy of Uptown to family-friendly suburbs.
Houses and residents
Type
Queens
Dallas
Houses
817,250
591,773
Average household size (people)
2.8
2.6
Houses occupied
782,664 (95.8%)
536,008 (90.6%)
Houses occupied by owners
334,894 (42.8%)
229,518 (42.8%)
Houses occupied by renters
447,770 (57.2%)
306,490 (57.2%)
Median rent asked for vacant for-rent units
$1,666
$1,403
Median price asked for vacant for-sale houses and condos
$615,765
$574,934
Estimated median house or condo value
$642,000
$267,600
Median number of rooms in apartments
3.7
3.7
Median number of rooms in houses and condos
5.4
6.1
Renting percentage
57%
55.9%
Housing density (houses/condos per square mile)
7,481.6
1,727.6
Household income disparities
44.9%
48.2%
Housing units without a mortgage
64,617 (34.6%)
1,309 (1%)
Housing units with both a second mortgage and home equity loan
311 (0.2%)
3,320 (2.6%)
Housing units with a mortgage
122,366 (65.4%)
124,846 (99%)
Housing units with a home equity loan
9,927 (5.3%)
204 (0.2%)
Housing units with a second mortgage
10,707 (5.7%)
5,351 (4.2%)
Housing units lacking complete kitchen facilities
1%
1.2%
Housing units lacking complete plumbing facilities
Self-employed workers in own not incorporated business
48,383
43,703
State government workers
21,536
17,325
Unpaid family workers
2,382
754
Industries and Occupations
In Queens, the healthcare, retail trade, and manufacturing industries are dominant. Dallas is known for its tech, defense, financial services and oil industry-leading to wide variety of occupations available in both cities.
Queens residents have access to premier healthcare facilities located throughout NYC. Dallas has top-rated hospitals including UTSW Medical Center, Baylor University Medical Center, and Texas Health Presbyterian Hospital.
Health (county statistics)
Type
Queens
Dallas
General health status score of residents in this county from 1 (poor) to 5 (excellent)
Queens has well-established infrastructure with notable landmarks and is part of the larger NYC metropolitan infrastructure. Dallas also has robust infrastructure with a high concentration of corporate headquarters, shopping centers, and stadiums.
Infrastructure
Type
Queens
Dallas
Hospitals
1
74
TV stations
30
25
Schools
School facilities
Type
Queens
Dallas
Private elementary/middle schools
8
50
Private high schools
1
26
Public elementary/middle schools
6
271
Public high schools
2
81
Colleges/Universities
1
44
Culture and Food
Queens is a melting pot of cultures, bringing diverse food experiences, from Greek and Chinese to Indian and Italian. Dallas is renowned for its BBQ, Tex-Mex cuisine, and Steakhouse experiences.
Sports Teams
Queens is home to the New York Mets (MLB). Dallas has major league sports teams like the Dallas Cowboys (NFL), Dallas Mavericks (NBA), and the Texas Rangers (MLB).


 Queens, NY
 Dallas, TX