Relocating from one city to another or choosing a city for a vacation requires careful thought, considering a range of factors from crime and safety to infrastructure and cultural offerings. Queens, New York, and Denver, Colorado, are two vastly different cities with their own unique blends of benefits and drawbacks. The task at hand is to provide a comprehensive comparison between these two United States cities, highlighting the key differences and similarities in numerous sectors. This detailed comparison should assist individuals or families contemplating relocating or touring these cities.
In terms of safety, Denver has a higher crime rate than Queens, NY, per 100,000 people. However, both cities have made significant strides in improving safety with an apparent downward trend in crime rates over the recent years. In either city, safety greatly depends on the neighborhood, and it's crucial to research specific areas before committing to relocation or accommodation.
Cost of Living
In general, the cost of living in Denver is lower than in Queens, NY, which is one of the most expensive areas to live in the US. Prices for groceries, healthcare, and utilities are lower in Denver, although both cities come with their fair share of costly services and commodities.
Income Tax
New York has a higher maximum state income tax rate than Colorado. While New York's state income tax ranges from 4% to 8.82%, Colorado has a flat rate of 4.63%.
Property Tax
Property taxes in Denver are generally lower than in Queens, NY. Colorado has a lower median property tax rate as compared to New York State, but exact rates can vary based on location and city assessments.
Sales Tax
The sales tax in Queens, NY, is less than in Denver. At 8.875%, the combined sales tax in Queens is lower than Denver's combined sales tax, which is 8.31%.
Income
Type
Queens
Denver
Estimated median household income
$73,262
$81,630
Estimated per capita income
$34,969
$52,690
Cost of living index (U.S. average is 100)
173.2
111.3
If you make $50,000 in Denver, you will have to make $77,808 in Queens to maintain the same standard of living.
Geographical Conditions
Geographically, Queens, NY, is mostly flat and sits at sea level while Denver is famously known as the "Mile High City," located exactly one mile above sea level. Denver's location at the foot of the Rocky Mountains offers access to myriad outdoor activities not found in Queens.
Geographical information
Type
Queens
Denver
Land area
109.2 sq. miles
153.4 sq. miles
Population density
20,847 people per sq. mile
4,639.5 people per sq. mile
Relative area comparison
Queens, NY Denver, CO
Education
In terms of education, both cities offer a variety of top-rated K-12 schools, colleges, and universities. New York City's school system is much larger, and Queens has access to some excellent public and private schools, but Denver also has a solid education system with increasing school ratings.
New York City and Denver's economies differ significantly, with the former heavily involved in finance, media, real estate, and technology, while the latter is targeted towards aerospace, telecommunications, and manufacturing. Although New York City has a larger economy, Denver's is growing rapidly and offers ample job opportunities.
Biggest Employers
In Denver, some of the biggest employers are telecommunications corporation DISH Network, airline company United Airlines, and healthcare provider HealthONE. On the other hand, JetBlue Airways, Mount Sinai Queens, and Silvercup Studios are some of the top employers in Queens.
In Queens (Queens County), 79.2% voted for Democrats and 20.0% for Republicans in 2012 Presidential Election. In Denver (Denver County), 73.9% voted for Democrats and 24.3% for Republicans.
Elections
Type
Democrats
Republicans
Other
Year
Queens
Denver
Queens
Denver
Queens
Denver
2020
72.3%
80.1%
27.0%
18.3%
0.7%
1.6%
2016
75.4%
74.2%
21.8%
19.0%
2.8%
6.8%
2012
79.2%
73.9%
20.0%
24.3%
0.8%
1.7%
2008
75.4%
75.8%
24.3%
23.2%
0.3%
1.0%
2004
71.8%
69.7%
27.5%
29.3%
0.8%
0.9%
2000
75.2%
62.0%
22.0%
30.9%
2.8%
7.0%
1996
72.9%
61.8%
21.1%
30.0%
6.0%
8.2%
Breakdown of population affiliated with a religious congregation
Type
Adherents
Congregations
Religion
Queens
Denver
Queens
Denver
CATHOLIC CHURCH
30.4%
26.6%
7.7%
8.7%
MUSLIM ESTIMATE
3.7%
0.5%
4.4%
0.9%
SEVENTH DAY ADVENTIST CHURCH
0.6%
0.7%
3.4%
3.0%
AMERICAN BAPTIST CHURCHES IN THE USA
0.5%
2.1%
2.5%
4.3%
EPISCOPAL CHURCH
0.4%
1.1%
2.1%
3.2%
EVANGELICAL LUTHERAN CHURCH IN AMERICA
0.3%
0.4%
2.6%
2.7%
SOUTHERN BAPTIST CONVENTION
0.2%
0.9%
3.8%
6.8%
LUTHERAN CHURCH
0.1%
0.3%
1.8%
2.3%
SALVATION ARMY
0.1%
1.1%
0.4%
0.7%
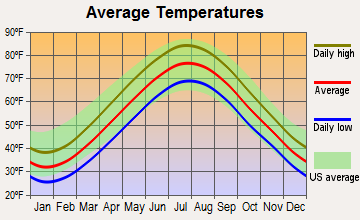
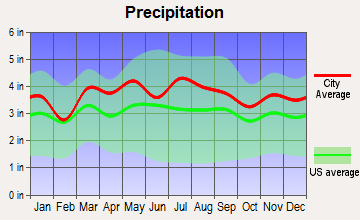
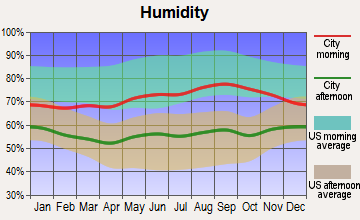
Weather
The weather in Queens, NY, is typically humid, with warm summers and cold, wet winters, while Denver experiences a semi-arid continental climate marked by sharp everyday temperature changes, dry, sunny summers, and snowy winters. Denver boasts more sunny days per year, making it an attractive location for those who crave a lot of sunshine.
Weather and climate
Type
Queens
Denver
Temperature - Average
54.6°F
49.5°F
Humidity - Average morning or afternoon humidity
68.5%
50.6%
Humidity - Differences between morning and afternoon humidity
25.1%
20%
Humidity - Maximum monthly morning or afternoon humidity
76.3%
55%
Humidity - Minimum monthly morning or afternoon humidity
51.1%
35%
Precipitation - Yearly average
44.5 in
17 in
Snowfall - Yearly average
52.7 in
114 in
Clouds - Number of days clear of clouds
16.3%
19.2%
Sunshine amount - Average
60.2%
75.6%
Sunshine amount - Differences during a year
20%
10%
Sunshine amount - Maximum monthly
64%
74%
Sunshine amount - Minimum monthly
44%
64%
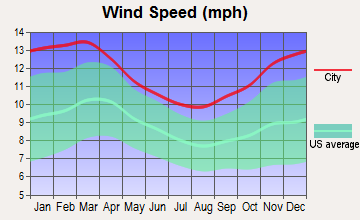
Wind speed - Average
11.6 mph
8.6 mph
Average climate in Queens, New York
Average climate in Denver, Colorado
Air pollution
Type
AQI
CO
NO2
OZONE
PB
PM10
PM25
SO2
Year
Queens
Denver
Queens
Denver
Queens
Denver
Queens
Denver
Queens
Denver
Queens
Denver
Queens
Denver
Queens
Denver
2018
97
100
0.26
0.50
14.7
25.4
25.4
27.9
N/A
N/A
N/A
29.2
6.4
8.6
0.4
0.7
2017
98
95
0.23
0.49
15.4
25.9
25.8
27.6
N/A
N/A
N/A
22.0
6.4
8.4
0.5
0.8
2016
97
90
0.24
0.53
16.0
27.7
25.5
27.2
N/A
N/A
N/A
22.6
6.7
8.7
0.6
1.0
2015
104
101
0.26
0.53
17.4
27.8
24.1
25.2
N/A
N/A
N/A
21.0
7.9
10.4
0.8
1.0
2014
99
94
0.25
0.53
17.0
25.4
24.3
24.6
N/A
N/A
N/A
25.1
7.8
10.1
1.1
1.3
2013
101
85
0.23
0.45
17.7
21.9
25.8
24.0
N/A
N/A
N/A
24.4
8.7
N/A
1.2
1.5
2012
105
91
0.26
0.33
17.6
18.9
25.8
26.2
N/A
N/A
N/A
24.9
9.1
N/A
1.8
1.4
2011
112
91
0.27
0.34
20.4
18.1
24.2
25.8
N/A
N/A
N/A
23.7
10.6
N/A
2.7
1.6
2010
112
82
0.35
0.43
19.4
16.3
23.6
23.6
N/A
N/A
N/A
26.4
10.3
N/A
2.9
1.0
2009
107
79
0.24
0.41
21.0
14.1
21.0
23.1
N/A
0.005
N/A
22.2
9.7
N/A
3.4
1.3
2008
113
85
0.44
0.43
22.6
17.3
22.0
26.0
0.013
0.008
N/A
25.2
11.0
N/A
4.1
1.6
2007
121
96
0.46
0.37
22.9
20.6
20.2
21.9
0.016
0.007
N/A
30.2
11.6
N/A
4.9
1.2
2006
120
89
0.46
0.51
23.5
19.0
20.3
22.1
0.018
0.008
N/A
28.0
12.7
N/A
5.3
1.4
2005
110
86
0.54
0.57
25.5
21.3
19.7
20.9
N/A
0.068
N/A
30.9
N/A
N/A
6.7
1.5
2004
107
82
0.55
0.60
25.1
21.2
18.2
19.2
0.030
0.012
N/A
28.6
N/A
N/A
5.8
1.8
2003
110
106
0.63
0.60
26.9
21.2
18.9
20.8
0.022
0.015
26.9
32.6
N/A
N/A
7.0
1.9
2002
124
86
0.58
0.65
27.9
19.2
19.2
20.4
0.008
0.014
25.7
35.7
N/A
N/A
6.5
2.5
2001
124
95
0.60
0.86
28.8
23.6
19.3
18.6
0.020
0.012
24.5
32.6
N/A
N/A
7.8
2.6
2000
115
93
0.67
0.81
28.4
13.4
17.6
19.2
0.022
0.013
22.2
12.2
N/A
N/A
7.3
2.1
Natural disasters
Type
Queens
Denver
Tornado activity compared to U.S. average
54%
129.5%
Earthquake activity compared to U.S. average
30.6%
811.7%
Natural disasters compared to U.S. average
19%
10%
Transportation
Denver's light rail system and buses serve the city relatively well, with Denverites also enjoying a prominent bike culture. However, public transportation in Queens, with access to the expansive New York City Subway system and numerous bus lines, is much more comprehensive.
Transport
Type
Queens
Denver
Amtrak stations
2
2
Amtrak stations nearby
3
2
FAA registered aircraft
4
602
FAA registered aircraft manufacturers and dealers
0
28
Means of transportation to work
Type
Queens
Denver
Bicycle
0.3%
1.5%
Bus
10%
2.6%
Carpooled
10.2%
8.8%
Car alone
34.3%
81.1%
Railroad
2.2%
1.2%
Streetcar
0.2%
0.2%
Subway
34.3%
0.1%
Taxicab
0.7%
0.1%
Walked
5.7%
2.8%
Average travel time to work
Type
Queens
Denver
Average
44 min
29.4 min
Real Estate
The real estate market in both cities is robust, although property in Queens, NY, is significantly more expensive than in Denver. Though the median home price in Denver is rising, it still remains more affordable than in Queens.
Neighborhoods
Both Queens and Denver contain a wide range of neighborhoods, from hip and trendy locales to quieter residential areas. Queens offers diverse communities like Flushing, Astoria, and Jamaica, while Denver's popular neighborhoods include Five Points, Capitol Hill, and Cherry Creek.
Houses and residents
Type
Queens
Denver
Houses
817,250
351,829
Average household size (people)
2.8
2.2
Houses occupied
782,664 (95.8%)
326,634 (92.8%)
Houses occupied by owners
334,894 (42.8%)
164,429 (50.3%)
Houses occupied by renters
447,770 (57.2%)
162,205 (49.7%)
Median rent asked for vacant for-rent units
$1,666
$1,674
Median price asked for vacant for-sale houses and condos
$615,765
$970,375
Estimated median house or condo value
$642,000
$541,500
Median number of rooms in apartments
3.7
3.5
Median number of rooms in houses and condos
5.4
6.4
Renting percentage
57%
50%
Housing density (houses/condos per square mile)
7,481.6
2,294.3
Household income disparities
44.9%
44%
Housing units without a mortgage
64,617 (34.6%)
2,112 (1.7%)
Housing units with both a second mortgage and home equity loan
311 (0.2%)
9,615 (7.6%)
Housing units with a mortgage
122,366 (65.4%)
123,690 (98.3%)
Housing units with a home equity loan
9,927 (5.3%)
273 (0.2%)
Housing units with a second mortgage
10,707 (5.7%)
12,819 (10.2%)
Housing units lacking complete kitchen facilities
1%
1.3%
Housing units lacking complete plumbing facilities
Self-employed workers in own not incorporated business
48,383
24,661
State government workers
21,536
15,204
Unpaid family workers
2,382
763
Industries and Occupations
Denver's economy is largely powered by industries such as technology, renewable energy, and the aerospace industry. In contrast, Queens, NY, has a diverse economy, with sectors like technology, entertainment, and healthcare driving job growth. Both cities offer varied job opportunities in different sectors.
Both Queens and Denver have access to world-class healthcare facilities. Queens is home to many top-rated hospitals, including NewYork-Presbyterian, while Denver is home to highly reputed hospitals such as UCHealth University of Colorado Hospital.
Health (county statistics)
Type
Queens
Denver
General health status score of residents in this county from 1 (poor) to 5 (excellent)
New York City, compared to Denver, has a much denser infrastructure, with rows of high-rises and a comprehensive public transport network. Denver's infrastructure, while not as dense, scores high on walkability and bicycling paths, catering to its outdoor-oriented lifestyle.
Infrastructure
Type
Queens
Denver
Hospitals
1
16
TV stations
30
17
Schools
School facilities
Type
Queens
Denver
Private elementary/middle schools
8
36
Private high schools
1
21
Public elementary/middle schools
6
151
Public high schools
2
58
Colleges/Universities
1
31
Culture and Food
Culture and food are unique in both cities. Queens is renowned for its cultural diversity, offering a variety of cuisines from all around the globe. Denver, on the other hand, is known for its Western heritage, craft beer scene, and regional mountain cuisine, which offers an entirely different experience to foodies.
Sports Teams
Sports enthusiasts will find multiple professional teams in both cities – in Queens, there are the Mets (MLB) and in Denver, there are the Broncos (NFL), Nuggets (NBA), and Rockies (MLB).


 Queens, NY
 Denver, CO