Queens, NY, and Detroit, MI, undoubtedly provide unique benefits and challenges to their residents and tourists alike. How they compare hinges on various factors, like safety, weather, cost of living, and cultural experiences, among others. Queens, being a part of the pulsating city of New York, offers vibrant diversity, better public transit system, and more employment opportunities albeit at a higher cost of living while Detroit, though marred by a high crime rate, affords a lower cost of living, teeming with music, art, and sport culture and the ongoing revival of its economy and infrastructure.
The crime rate in Detroit is relatively higher than in Queens. Detroit has worked relentlessly over the years to reduce its crime rates; however, safety remains a relative issue for both residents and tourists. Queens, in comparison, is safer, although like any urban area, it has neighbourhoods where crime occurs more frequently.
Cost of Living
The cost of living in Queens is significantly higher when compared to Detroit, with a high disparity in housing costs playing a significant role in this difference. Everything from groceries to healthcare tends to be more expensive in Queens.
Income Tax
Both cities impose income taxes, but rates vary. Detroit imposes a 2.4% resident income tax and 1.2% for non-residents, while New York City’s tax rates range from 3.078% up to 3.876%.
Property Tax
Property taxes are considerably higher in Detroit when compared to Queens, despite Detroit's lower home values.
Sales Tax
New York City’s sales tax, including the tax for Queens is 8.875%, which is higher than Detroit's rate of 6%.
Income
Type
Queens
Detroit
Estimated median household income
$73,262
$36,140
Estimated per capita income
$34,969
$22,122
Cost of living index (U.S. average is 100)
173.2
94.1
If you make $50,000 in Detroit, you will have to make $92,030 in Queens to maintain the same standard of living.
Geographical Conditions
Queens, located at the western end of Long Island, presents an array of landscapes including beaches, parks and urban areas. Detroit, known as the "Motor City," is located on the Detroit River, with Canada across the river to the south.
Geographical information
Type
Queens
Detroit
Land area
109.2 sq. miles
138.8 sq. miles
Population density
20,847 people per sq. mile
4,557.7 people per sq. mile
Relative area comparison
Queens, NY Detroit, MI
Education
Both Queens and Detroit offer a range of educational opportunities. In Queens, access to quality education could be easier due to the presence of diverse and numerous institutions. Detroit, on the other hand, struggles with public school performance although it has good Universities.
New York's economic power makes Queens a place bubbling with ample job opportunities in various sectors. Detroit's economy, while not as robust, is on an upswing with an encouraging job market primarily driven by the auto industry, healthcare and IT.
Biggest Employers
In Queens, some of the largest employers include the JFK Airport, Northwell Health, and the Mount Sinai Hospital. Detroit's largest employers are General Motors, Ford, and St. John Providence Health System.
In Queens (Queens County), 79.2% voted for Democrats and 20.0% for Republicans in 2012 Presidential Election. In Detroit (Wayne County), 73.1% voted for Democrats and 26.2% for Republicans.
Elections
Type
Democrats
Republicans
Other
Year
Queens
Detroit
Queens
Detroit
Queens
Detroit
2020
72.3%
68.6%
27.0%
30.4%
0.7%
1.0%
2016
75.4%
66.6%
21.8%
29.4%
2.8%
4.0%
2012
79.2%
73.1%
20.0%
26.2%
0.8%
0.6%
2008
75.4%
74.4%
24.3%
24.7%
0.3%
0.9%
2004
71.8%
69.7%
27.5%
29.9%
0.8%
0.4%
2000
75.2%
69.1%
22.0%
29.1%
2.8%
1.8%
1996
72.9%
69.0%
21.1%
24.0%
6.0%
7.0%
Breakdown of population affiliated with a religious congregation
Type
Adherents
Congregations
Religion
Queens
Detroit
Queens
Detroit
CATHOLIC CHURCH
30.4%
16.3%
7.7%
11.2%
MUSLIM ESTIMATE
3.7%
3.7%
4.4%
2.9%
SEVENTH DAY ADVENTIST CHURCH
0.6%
0.4%
3.4%
1.4%
AMERICAN BAPTIST CHURCHES IN THE USA
0.5%
1.5%
2.5%
2.4%
EPISCOPAL CHURCH
0.4%
0.4%
2.1%
2.5%
EVANGELICAL LUTHERAN CHURCH IN AMERICA
0.3%
0.7%
2.6%
2.8%
SOUTHERN BAPTIST CONVENTION
0.2%
0.4%
3.8%
3.2%
LUTHERAN CHURCH
0.1%
1.2%
1.8%
3.9%
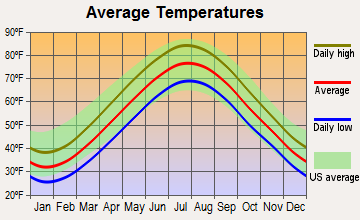
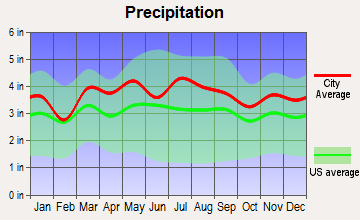
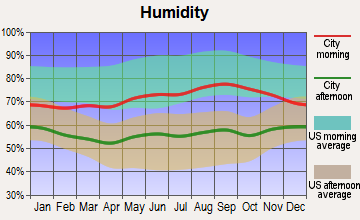
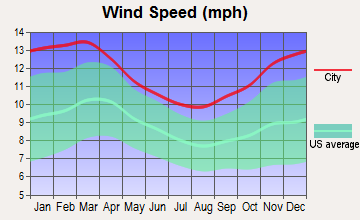
Weather
Weather patterns vary greatly between these cities. Detroit features a humid continental climate with distinct seasons - hot summers and cold, snowy winters. Queens also experiences four seasons, but its humid subtropical climate means milder winters and hot, humid summers.
Weather and climate
Type
Queens
Detroit
Temperature - Average
54.6°F
50°F
Humidity - Average morning or afternoon humidity
68.5%
75.3%
Humidity - Differences between morning and afternoon humidity
25.1%
33%
Humidity - Maximum monthly morning or afternoon humidity
76.3%
86%
Humidity - Minimum monthly morning or afternoon humidity
51.1%
53%
Precipitation - Yearly average
44.5 in
33.6 in
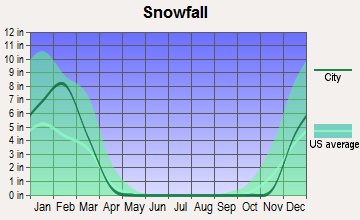
Snowfall - Yearly average
52.7 in
86.5 in
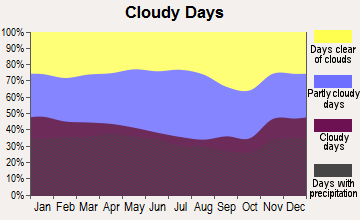
Clouds - Number of days clear of clouds
16.3%
12.7%
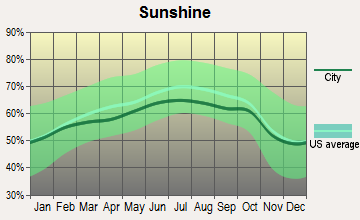
Sunshine amount - Average
60.2%
56.8%
Sunshine amount - Differences during a year
20%
38%
Sunshine amount - Maximum monthly
64%
69%
Sunshine amount - Minimum monthly
44%
31%
Wind speed - Average
11.6 mph
10.2 mph
Average climate in Queens, New York
Average climate in Detroit, Michigan
Air pollution
Type
AQI
CO
NO2
OZONE
PB
PM10
PM25
SO2
Year
Queens
Detroit
Queens
Detroit
Queens
Detroit
Queens
Detroit
Queens
Detroit
Queens
Queens
Detroit
Queens
Detroit
2018
97
90
0.26
0.44
14.7
12.9
25.4
25.8
N/A
N/A
N/A
N/A
6.4
10.1
0.4
1.1
2017
98
87
0.23
0.56
15.4
12.7
25.8
20.9
N/A
N/A
N/A
N/A
6.4
10.1
0.5
1.3
2016
97
86
0.24
0.47
16.0
13.2
25.5
22.0
N/A
N/A
N/A
N/A
6.7
10.9
0.6
0.8
2015
104
95
0.26
0.49
17.4
14.8
24.1
26.5
N/A
N/A
N/A
N/A
7.9
11.9
0.8
1.2
2014
99
95
0.25
0.48
17.0
14.2
24.3
24.2
N/A
N/A
N/A
N/A
7.8
12.0
1.1
1.7
2013
101
80
0.23
0.53
17.7
14.4
25.8
24.5
N/A
N/A
N/A
N/A
8.7
11.0
1.2
1.3
2012
105
99
0.26
0.49
17.6
14.6
25.8
25.7
N/A
N/A
N/A
N/A
9.1
6.6
1.8
1.7
2011
112
94
0.27
0.32
20.4
12.9
24.2
24.3
N/A
N/A
N/A
N/A
10.6
6.5
2.7
1.6
2010
112
96
0.35
0.28
19.4
11.8
23.6
24.7
N/A
0.006
N/A
N/A
10.3
12.1
2.9
1.6
2009
107
68
0.24
0.27
21.0
12.7
21.0
23.4
N/A
N/A
N/A
N/A
9.7
N/A
3.4
1.9
2008
113
67
0.44
0.27
22.6
12.8
22.0
N/A
0.013
N/A
N/A
N/A
11.0
N/A
4.1
2.0
2007
121
81
0.46
0.29
22.9
13.7
20.2
25.8
0.016
0.017
N/A
N/A
11.6
N/A
4.9
N/A
2006
120
63
0.46
0.31
23.5
14.0
20.3
19.8
0.018
0.022
N/A
N/A
12.7
N/A
5.3
3.2
2005
110
83
0.54
0.36
25.5
17.4
19.7
22.6
N/A
0.019
N/A
N/A
N/A
N/A
6.7
4.0
2004
107
70
0.55
0.43
25.1
15.0
18.2
N/A
0.030
0.014
N/A
N/A
N/A
N/A
5.8
3.7
2003
110
86
0.63
0.40
26.9
18.5
18.9
N/A
0.022
0.013
26.9
N/A
N/A
N/A
7.0
4.8
2002
124
88
0.58
0.36
27.9
18.3
19.2
N/A
0.008
0.019
25.7
N/A
N/A
N/A
6.5
4.3
2001
124
83
0.60
0.36
28.8
19.0
19.3
N/A
0.020
0.020
24.5
N/A
N/A
N/A
7.8
4.4
2000
115
71
0.67
0.35
28.4
18.2
17.6
N/A
0.022
0.027
22.2
N/A
N/A
N/A
7.3
5.2
Natural disasters
Type
Queens
Detroit
Tornado activity compared to U.S. average
54%
128.5%
Earthquake activity compared to U.S. average
30.6%
53.2%
Natural disasters compared to U.S. average
19%
14%
Transportation
Queens has an extensive public transit system with subways, buses, and cabs readily available while Detroit's public transit is more limited, with residents reliant on personal vehicles.
Transport
Type
Queens
Detroit
Amtrak stations
2
1
Amtrak stations nearby
3
3
FAA registered aircraft
4
93
FAA registered aircraft manufacturers and dealers
0
3
Means of transportation to work
Type
Queens
Detroit
Bicycle
0.3%
0.5%
Bus
10%
4%
Carpooled
10.2%
7.5%
Car alone
34.3%
83.4%
Railroad
2.2%
0%
Streetcar
0.2%
0.1%
Subway
34.3%
0.1%
Taxicab
0.7%
0.5%
Walked
5.7%
2.7%
Average travel time to work
Type
Queens
Detroit
Average
44 min
30.6 min
Real Estate
Real estate prices in Queens are significantly higher as compared to Detroit, which has become notable for its affordable housing.
Neighborhoods
Queens is known for its diverse and thriving neighbourhoods while Detroit is home to some historic districts with character, although many neighborhoods are still grappling with the impact of depopulation.
Houses and residents
Type
Queens
Detroit
Houses
817,250
322,906
Average household size (people)
2.8
2.6
Houses occupied
782,664 (95.8%)
251,729 (78%)
Houses occupied by owners
334,894 (42.8%)
129,084 (51.3%)
Houses occupied by renters
447,770 (57.2%)
122,645 (48.7%)
Median rent asked for vacant for-rent units
$1,666
$798.06
Median price asked for vacant for-sale houses and condos
$615,765
$86,452
Estimated median house or condo value
$642,000
$69,300
Median number of rooms in apartments
3.7
5
Median number of rooms in houses and condos
5.4
6.3
Renting percentage
57%
48.9%
Housing density (houses/condos per square mile)
7,481.6
2,326.9
Household income disparities
44.9%
49.3%
Housing units without a mortgage
64,617 (34.6%)
2,599 (5.6%)
Housing units with both a second mortgage and home equity loan
311 (0.2%)
2,270 (4.9%)
Housing units with a mortgage
122,366 (65.4%)
43,675 (94.4%)
Housing units with a home equity loan
9,927 (5.3%)
357 (0.8%)
Housing units with a second mortgage
10,707 (5.7%)
3,466 (7.5%)
Housing units lacking complete kitchen facilities
1%
17.1%
Housing units lacking complete plumbing facilities
Self-employed workers in own not incorporated business
48,383
11,725
State government workers
21,536
8,763
Unpaid family workers
2,382
441
Industries and Occupations
While Queens’ job market is incredibly diverse, with sectors like healthcare, retail, education, and accommodation dominating, Detroit remains famed for its automotive manufacturing with increasing opportunities in healthcare, IT and education.
Queens boasts impressive healthcare facilities and hospitals including Mount Sinai Queens Hospital while Detroit's healthcare is up to par as well, with renowned institutions like the Detroit Medical Center.
Health (county statistics)
Type
Queens
Detroit
General health status score of residents in this county from 1 (poor) to 5 (excellent)
Notably better infrastructure is witnessed in Queens, with consistent improvements and developments. On the other hand, Detroit's infrastructure, historically underserved, is slowly being revitalized.
Infrastructure
Type
Queens
Detroit
Hospitals
1
41
TV stations
30
16
Schools
School facilities
Type
Queens
Detroit
Private elementary/middle schools
8
14
Private high schools
1
7
Public elementary/middle schools
6
132
Public high schools
2
68
Colleges/Universities
1
13
Culture and Food
Both cities have robust cultural and food scenes. Queens is one of the most diverse urban areas in the world and this reflects in its food. Detroit’s cultural scene is defined by Motown music, auto heritage, and a fast-growing arts and culinary scene.
Sports Teams
Queens is home to the New York Mets (MLB) and has hosts US open tennis. Detroit is a sports-crazy city housing teams in all major sports - Lions (NFL), Pistons (NBA), Tigers (MLB), and Red Wings (NHL).


 Queens, NY
 Detroit, MI