Queens, New York and East San Gabriel Valley, California offer unique lifestyles rooted in their distinctive geographical and cultural attributes. Historically diverse Queens offers bustling urban living, an expansive cultural scene, and a strategic location for work opportunities. In contrast, East San Gabriel Valley presents a more relaxed lifestyle with a heavy focus on nature, suburban living, and prominent industries such as health and education. This comparison will delve into various aspects of the two locations to help you decide where your next destination might be, whether for relocation or just a visit.
While no place is immune to crime, Queens has a higher crime rate compared to East San Gabriel Valley. This discrepancy can be largely attributed to Queens' much larger population. However, the New York City Police Department employs stringent strategies to curb crime, and neighborhoods like Bayside and Whitestone in Queens are considered very safe. Meanwhile, East San Gabriel Valley is generally safe, with crime rates tending to vary among specific neighborhoods.
Cost of Living
In general, the cost of living in Queens is higher than in East San Gabriel Valley, with housing being one of the primary factors driving this difference. Living in New York City, one of the most expensive cities in the U.S., comes with its hefty price tag. On the contrary, while California is not cheap, East San Gabriel Valley is considerably more affordable than Queens, especially when it comes to housing.
Income Tax
New York State has a progressive income tax system, and living in Queens, you'll also pay a New York City income tax. All told, high earners could face taxes close to 13% on their income. In comparison, California also has a progressive income tax system, which tends to be higher than most other states with a top rate of 13.3%.
Property Tax
Property taxes in Queens are generally lower than those in East San Gabriel Valley. Homeowners in New York City pay about 0.90% of their property's value each year compared to the California average of 0.73%, with many homeowners in East San Gabriel paying above the state median.
Sales Tax
New York City, including Queens, has a combined state and local sales tax rate of 8.875%, while California's state sales tax is 7.25% with East San Gabriel Valley having an additional local sales tax, leading to a combined tax rate of about 9-10%.
Income
Type
Queens
East San Gabriel Valley
Estimated median household income
$73,262
$95,242
Estimated per capita income
$34,969
$34,474
Cost of living index (U.S. average is 100)
173.2
150.2
If you make $50,000 in East San Gabriel Valley, you will have to make $57,656 in Queens to maintain the same standard of living.
Geographical Conditions
Queens, situated on Long Island, is on relatively flat terrain and surrounded by water bodies including the East River and Jamaica Bay. East San Gabriel Valley offers diverse geographical conditions, from the suburban plains to the San Gabriel Mountains' picturesque foothills.
Geographical information
Type
Queens
East San Gabriel Valley
Land area
109.2 sq. miles
212.6 sq. miles
Population density
20,847 people per sq. mile
4,478.5 people per sq. mile
Relative area comparison
Queens, NY East San Gabriel Valley, CA
Education
Queens is home to top-rated public schools like Baccalaureate School for Global Education and Townsend Harris High School, as well as CUNY Queens College. East San Gabriel Valley also has reputable schools like Glen A. Wilson High and Diamond Bar High School. Notably, East San Gabriel also offers various community colleges and vocational schools.
Queens' economy is largely influenced by industries such as healthcare, retail trade, and educational services, with rapid growth in the technology sector recently. In contrast, East San Gabriel Valley's economy heavily leans towards healthcare, social assistance, and retail trade. Job growth across various sectors is expected in both regions.
Biggest Employers
In Queens, the biggest employers include Mount Sinai Queens and JetBlue Airways. Many residents also commute to Manhattan for work. In East San Gabriel Valley, prominent employers include the City of Hope National Medical Center, Citrus College, Azusa Pacific University, and numerous other healthcare and educational institutions.
In Queens (Queens County), 79.2% voted for Democrats and 20.0% for Republicans in 2012 Presidential Election. In East San Gabriel Valley (Los Angeles County), 69.7% voted for Democrats and 27.8% for Republicans.
Elections
Type
Democrats
Republicans
Other
Year
Queens
East San Gabriel Valley
Queens
East San Gabriel Valley
Queens
East San Gabriel Valley
2020
72.3%
71.0%
27.0%
26.9%
0.7%
2.1%
2016
75.4%
72.0%
21.8%
22.5%
2.8%
5.5%
2012
79.2%
69.7%
20.0%
27.8%
0.8%
2.4%
2008
75.4%
69.2%
24.3%
28.8%
0.3%
1.9%
2004
71.8%
63.3%
27.5%
35.7%
0.8%
1.0%
2000
75.2%
63.6%
22.0%
32.4%
2.8%
4.0%
1996
72.9%
59.3%
21.1%
31.0%
6.0%
9.7%
Breakdown of population affiliated with a religious congregation
Type
Adherents
Congregations
Religion
Queens
East San Gabriel Valley
Queens
East San Gabriel Valley
CATHOLIC CHURCH
30.4%
36.1%
7.7%
4.7%
MUSLIM ESTIMATE
3.7%
0.7%
4.4%
1.0%
SEVENTH DAY ADVENTIST CHURCH
0.6%
0.5%
3.4%
2.4%
AMERICAN BAPTIST CHURCHES IN THE USA
0.5%
0.5%
2.5%
3.1%
EPISCOPAL CHURCH
0.4%
0.4%
2.1%
1.4%
EVANGELICAL LUTHERAN CHURCH IN AMERICA
0.3%
0.2%
2.6%
1.9%
SOUTHERN BAPTIST CONVENTION
0.2%
1.0%
3.8%
9.0%
Weather
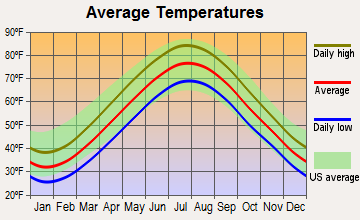
Those who prefer a warmer climate may lean towards East San Gabriel Valley, known for its Mediterranean climate with dry summers and mild, wet winters. Queens, on the other hand, has a humid subtropical climate with hot, humid summers and chilly winters that often include snowfall—a complete four-season experience. This difference in climate may affect your decision depending on your weather preferences.
Weather and climate
Type
Queens
East San Gabriel Valley
Temperature - Average
54.6°F
62.7°F
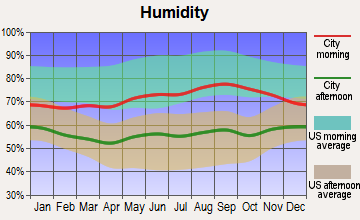
Humidity - Average morning or afternoon humidity
68.5%
64.7%
Humidity - Differences between morning and afternoon humidity
25.1%
19.6%
Humidity - Maximum monthly morning or afternoon humidity
76.3%
70.7%
Humidity - Minimum monthly morning or afternoon humidity
51.1%
51%
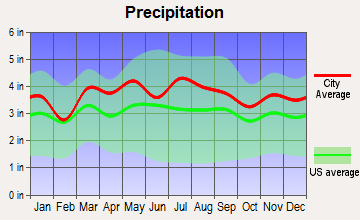
Precipitation - Yearly average
44.5 in
19.1 in
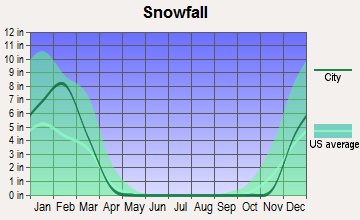
Snowfall - Yearly average
52.7 in
0 in
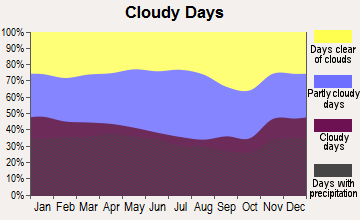
Clouds - Number of days clear of clouds
16.3%
28.3%
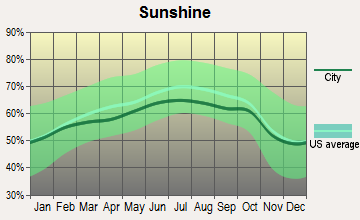
Sunshine amount - Average
60.2%
78.4%
Sunshine amount - Differences during a year
20%
22%
Sunshine amount - Maximum monthly
64%
85%
Sunshine amount - Minimum monthly
44%
63%
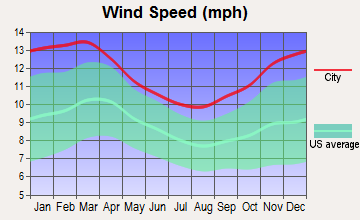
Wind speed - Average
11.6 mph
3.7 mph
Average climate in Queens, New York
Average climate in East San Gabriel Valley, California
Air pollution
Type
AQI
CO
NO2
OZONE
PB
PM10
PM25
SO2
Year
Queens
East San Gabriel Valley
Queens
East San Gabriel Valley
Queens
East San Gabriel Valley
Queens
East San Gabriel Valley
Queens
East San Gabriel Valley
Queens
East San Gabriel Valley
Queens
East San Gabriel Valley
Queens
East San Gabriel Valley
2018
97
143
0.26
0.36
14.7
14.1
25.4
29.2
N/A
0.007
N/A
29.6
6.4
13.4
0.4
0.3
2017
98
150
0.23
0.35
15.4
14.8
25.8
30.5
N/A
0.007
N/A
32.7
6.4
12.6
0.5
0.3
2016
97
141
0.24
0.31
16.0
15.5
25.5
29.3
N/A
0.007
N/A
30.3
6.7
12.0
0.6
0.3
2015
104
145
0.26
0.30
17.4
15.2
24.1
30.4
N/A
0.007
N/A
30.0
7.9
14.6
0.8
0.2
2014
99
142
0.25
0.32
17.0
16.8
24.3
29.7
N/A
0.008
N/A
33.6
7.8
11.7
1.1
0.3
2013
101
147
0.23
0.33
17.7
17.0
25.8
27.7
N/A
0.007
N/A
31.5
8.7
11.5
1.2
0.4
2012
105
149
0.26
0.39
17.6
18.3
25.8
27.5
N/A
0.005
N/A
30.9
9.1
15.6
1.8
0.6
2011
112
149
0.27
0.40
20.4
18.6
24.2
26.7
N/A
0.008
N/A
30.3
10.6
17.3
2.7
0.5
2010
112
139
0.35
0.44
19.4
19.3
23.6
26.8
N/A
N/A
N/A
26.6
10.3
14.8
2.9
0.4
2009
107
156
0.24
0.40
21.0
21.0
21.0
28.0
N/A
0.010
N/A
26.0
9.7
16.5
3.4
0.6
2008
113
156
0.44
0.48
22.6
22.7
22.0
27.7
0.013
0.012
N/A
27.0
11.0
15.1
4.1
1.0
2007
121
135
0.46
0.52
22.9
25.3
20.2
24.8
0.016
0.014
N/A
N/A
11.6
N/A
4.9
1.3
2006
120
128
0.46
0.55
23.5
25.1
20.3
24.0
0.018
0.009
N/A
N/A
12.7
N/A
5.3
1.9
2005
110
127
0.54
0.59
25.5
25.7
19.7
22.8
N/A
0.014
N/A
N/A
N/A
N/A
6.7
1.9
2004
107
132
0.55
0.68
25.1
25.4
18.2
24.6
0.030
0.016
N/A
N/A
N/A
N/A
5.8
1.7
2003
110
137
0.63
0.80
26.9
29.9
18.9
24.7
0.022
0.021
26.9
N/A
N/A
N/A
7.0
1.4
2002
124
134
0.58
0.83
27.9
31.4
19.2
23.1
0.008
0.021
25.7
N/A
N/A
N/A
6.5
2.0
2001
124
141
0.60
1.00
28.8
31.8
19.3
21.4
0.020
0.029
24.5
N/A
N/A
N/A
7.8
2.1
2000
115
150
0.67
1.05
28.4
34.7
17.6
20.7
0.022
0.027
22.2
N/A
N/A
N/A
7.3
2.0
Natural disasters
Type
Queens
East San Gabriel Valley
Tornado activity compared to U.S. average
54%
18.5%
Earthquake activity compared to U.S. average
30.6%
7,292.4%
Natural disasters compared to U.S. average
19%
57%
Transportation
Public transportation in Queens, part of the New York City metro, is excellent, with vast subway and bus networks, making commuting to Manhattan or other boroughs convenient. East San Gabriel Valley, however, is more car-oriented with limited public transit, though there's access to Metrolink trains and local buses for commuting.
Transport
Type
Queens
East San Gabriel Valley
Amtrak stations
2
0
Amtrak stations nearby
3
3
FAA registered aircraft
4
0
Means of transportation to work
Type
Queens
East San Gabriel Valley
Bicycle
0.3%
0.6%
Bus
10%
2.9%
Carpooled
10.2%
17.1%
Car alone
34.3%
73.3%
Motorcycle
0%
0.2%
Railroad
2.2%
0.6%
Streetcar
0.2%
0%
Subway
34.3%
0.1%
Taxicab
0.7%
0%
Walked
5.7%
2.2%
Average travel time to work
Type
Queens
East San Gabriel Valley
Average
44 min
32.3 min
Real Estate
Real estate in Queens is generally more expensive than in East San Gabriel Valley, reflecting the general cost of living differences. Queens offers various types of housing, from high-rise condo apartments to single-family homes. East San Gabriel Valley offers a more suburban real estate market with larger properties generally available at lower prices than in Queens.
Neighborhoods
Queens is composed of diverse neighborhoods each with its unique culture—from the bustling Flushing to the artsy Astoria. On the other hand, East San Gabriel Valley features calm suburban neighborhoods like Glendora and Walnut, known for their family-friendly environment and natural beauty.
Houses and residents
Type
Queens
East San Gabriel Valley
Houses
817,250
270,240
Average household size (people)
2.8
3.5
Houses occupied
782,664 (95.8%)
263,338 (97.4%)
Houses occupied by owners
334,894 (42.8%)
180,683 (68.6%)
Houses occupied by renters
447,770 (57.2%)
82,655 (31.4%)
Median rent asked for vacant for-rent units
$1,666
$1,935
Median price asked for vacant for-sale houses and condos
$615,765
$1,138,428
Estimated median house or condo value
$642,000
$643,048
Median number of rooms in apartments
3.7
3.7
Median number of rooms in houses and condos
5.4
5.9
Renting percentage
57%
32.3%
Housing density (houses/condos per square mile)
7,481.6
1,270.8
Household income disparities
44.9%
40.3%
Housing units without a mortgage
64,617 (34.6%)
26,635 (16.4%)
Housing units with both a second mortgage and home equity loan
311 (0.2%)
515 (0.3%)
Housing units with a mortgage
122,366 (65.4%)
136,243 (83.6%)
Housing units with a home equity loan
9,927 (5.3%)
11,429 (7%)
Housing units with a second mortgage
10,707 (5.7%)
21,150 (13%)
Housing units lacking complete kitchen facilities
1%
1%
Housing units lacking complete plumbing facilities
1.1%
0.8%
Housing units in structures
Housing units in structures
Queens
East San Gabriel Valley
One, detached
21.1%
68.5%
One, attached
9.8%
8.2%
Two
19.2%
1.0%
3 or 4
10.5%
3.9%
5 to 9
5.6%
3.0%
10 to 19
3.4%
2.4%
20 to 49
9.4%
2.8%
50 or more
20.9%
6.5%
Mobile homes
0.1%
3.6%
Boats, RVs, vans, etc.
0.0%
0.1%
Median real estate property taxes paid for housing units
Self-employed workers in own not incorporated business
48,383
25,753
State government workers
21,536
13,845
Unpaid family workers
2,382
1,494
Industries and Occupations
In Queens, the most common industries are Healthcare & Social Assistance, Retail Trade, and Educational Services. In East San Gabriel Valley, the dominating industry sectors are Health Care, Education, and Retail Trade, with a notable presence of manufacturing and professional services as well.
Queens has numerous reputable healthcare facilities, including Mount Sinai Queens and NewYork-Presbyterian Queens. East San Gabriel Valley is home to recognized healthcare institutions like the City of Hope National Medical Center.
Health (county statistics)
Type
Queens
East San Gabriel Valley
General health status score of residents in this county from 1 (poor) to 5 (excellent)
New York City, including Queens, has a well-developed infrastructure with planned urban design, matured transportation systems, and well-maintained civic amenities. Conversely, East San Gabriel, while not as high-density as Queens, boasts considerable infrastructural development with ongoing improvements to meet the needs of its growing population.
Infrastructure
Type
Queens
East San Gabriel Valley
TV stations
30
24
Culture and Food
Queens offers a rich multicultural scene reflected in its array of global cuisines from Greek fare in Astoria to Indian food in Jackson Heights. East San Gabriel Valley is known for its Asian cuisine, particularly Chinese, and a number of quality Mexican restaurants.
Sports Teams
Sports enthusiasts in Queens cheer for Big Apple teams like the Mets (MLB), Jets (NFL), and Knicks (NBA). Meanwhile, in East San Gabriel Valley, sports fans can root for Los Angeles teams, like the Dodgers (MLB), Lakers (NBA), and Rams (NFL).
 Queens, NY
 East San Gabriel Valley, CA