


Relative area comparison
 Queens, NY
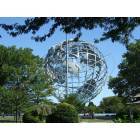
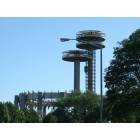
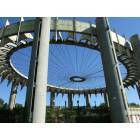
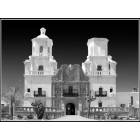
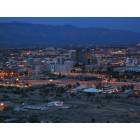
 Tucson, AZ
Queens, NY and Tucson, AZ are two very distinct cities, each offering unique experiences for residents and tourists alike. They differ in many aspects including crime rates and safety, weather, cost of living, education, economy, infrastructure, occupations, employers, real estate, neighborhoods, taxes, culture, sports, geographical conditions, and health care. This comprehensive look will delve into these factors, revealing the contrasts between these two locations. Whether for relocation or vacation, understanding these differences is crucial for making informed decisions.
 Queens, NY and
Tucson, AZ : 2,125.9 miles
Queens, NY and
Tucson, AZ : 2,125.9 miles
Queens's population is larger by 319%. The population of Tucson has grown by 56,543 people (11.6%) during that time.
| Population | ||
| Type | Queens | Tucson |
|---|---|---|
| Population | 2,277,251 | 543,242 |
| Female / male percentage | 51.8% / 48.2%
|
49.9% / 50.1%
|
When it comes to crime and safety, Queens, New York tends to have a higher crime rate compared to Tucson, Arizona. However, it's important to note that crime rates can vary widely within the borough itself. Certain neighborhoods like Bayside, Little Neck, and Belle Harbor are known to be safer than others. Tucson, on the other hand, is also diverse in terms of safety; areas like Catalina Foothills and Oro Valley are known to be safer parts of the town. Tourists should research their specific destinations for safety measures.
Cost of living in Queens, NY is significantly higher than in Tucson, AZ. Everything from housing, utilities, groceries to entertainment is costlier in Queens. Tucson, on the other hand, is known for its affordability which extends to various sectors of everyday life. For those looking to relocate, your dollar stretches further in Tucson.
New York City residents pay a city income tax that ranges from 3.078% to 3.876% additionally to the state income tax. Arizona has a state income tax that ranges from 2.59% to 4.5%, but there's no additional city income tax in Tucson.
Queens, NY has a lower property tax rate (0.88%) than Tucson, AZ (0.81%), but given the cost of property, you might end up paying more in Queens.
The combined city and state sales tax in Queens, NY, is currently 8.875%. Tucson, AZ has a combined city and state sales tax rate of 8.7%.
| Income | ||
| Type | Queens | Tucson |
|---|---|---|
| Estimated median household income | $73,262 | $50,306 |
| Estimated per capita income | $34,969 | $27,821 |
| Cost of living index (U.S. average is 100) | 173.2 | 90.1 |
If you make $50,000 in Tucson, you will have to make $96,115 in Queens to maintain the same standard of living.
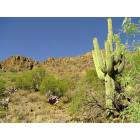
Surrounded by water, Queens offers city beaches and waterside activities. Tucson is surrounded by five minor mountain ranges, offering outdoor enthusiasts endless hiking and biking options.
| Geographical information | ||
| Type | Queens | Tucson |
|---|---|---|
| Land area | 109.2 sq. miles | 194.7 sq. miles |
| Population density | 20,847 people per sq. mile | 2,790.5 people per sq. mile |
Queens, NY
Tucson, AZ
The public schools in Queens are part of the New York City Department of Education, one of the largest school districts in America, offering diverse educational opportunities. Tucson, while smaller, is known for its higher education institutes, most notably the University of Arizona.
| Education level (25-year-olds and older) | ||
| Type | Queens | Tucson |
|---|---|---|
| Bachelor's degree or higher | 24.3% | 29.1% |
| Graduate or professional degree | 9.2% | 12.3% |
| High school or higher | 74.4% | 88.1% |
Queens offers diverse job opportunities, spanning sectors like healthcare, education, and retail. Tucson has primarily been driven by industries such as government, education and health services. For those in academia, healthcare or aerospace, Tucson presents plentiful opportunities.
The biggest employers in Queens are the city’s various agencies like the NYC Department of Health, Department of Education, and MTA. Tucson's largest employers include the University of Arizona, Raytheon Missile Systems, and State of Arizona.
In Queens (Queens County), 79.2% voted for Democrats and 20.0% for Republicans in 2012 Presidential Election. In Tucson (Pima County), 52.7% voted for Democrats and 45.7% for Republicans.
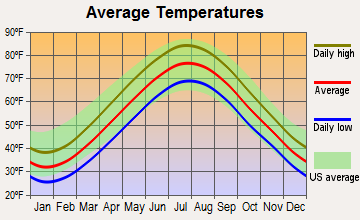
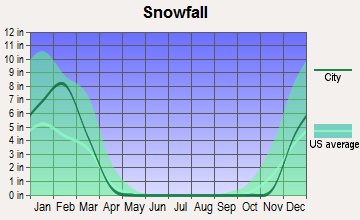
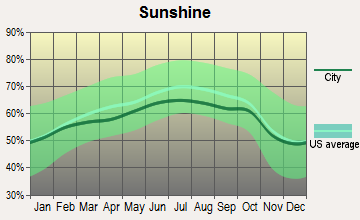
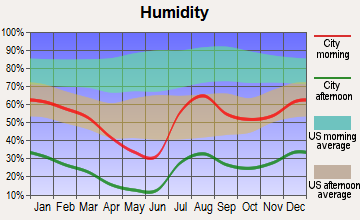
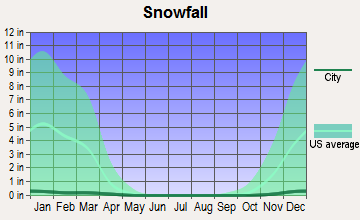
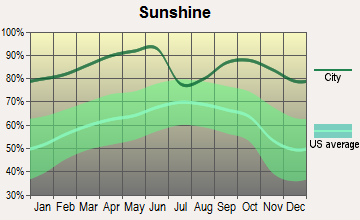
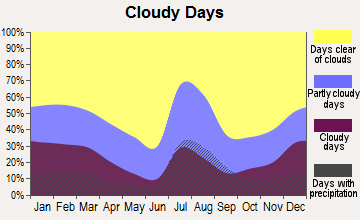
Weather is a stark contrasting factor. Queens experiences a mixed bag of weather conditions including warm, humid summers and potentially freezing winters. Snowfall during winter can disrupt everyday life. Tucson, Arizona, enjoys mild winters and very hot summers. The city has over 350 days of sunshine per year, making it a popular destination for tourists and retirees.
| Weather and climate | ||
| Type | Queens | Tucson |
|---|---|---|
| Temperature - Average | 54.6°F | 70°F |
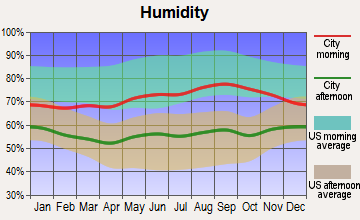
| Humidity - Average morning or afternoon humidity | 68.5% | 38.6% |
| Humidity - Differences between morning and afternoon humidity | 25.1% | 46% |
| Humidity - Maximum monthly morning or afternoon humidity | 76.3% | 58% |
| Humidity - Minimum monthly morning or afternoon humidity | 51.1% | 12% |
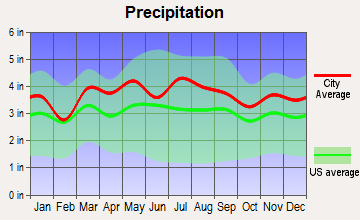
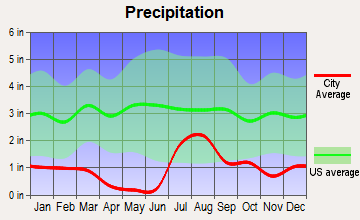
| Precipitation - Yearly average | 44.5 in | 12 in |
| Snowfall - Yearly average | 52.7 in | 2 in |
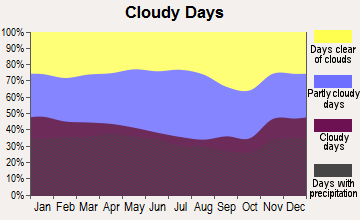
| Clouds - Number of days clear of clouds | 16.3% | 32.3% |
| Sunshine amount - Average | 60.2% | 92.8% |
| Sunshine amount - Differences during a year | 20% | 15% |
| Sunshine amount - Maximum monthly | 64% | 94% |
| Sunshine amount - Minimum monthly | 44% | 79% |
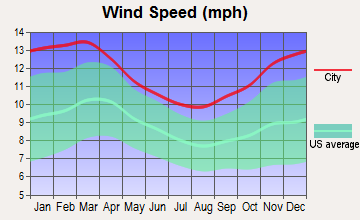
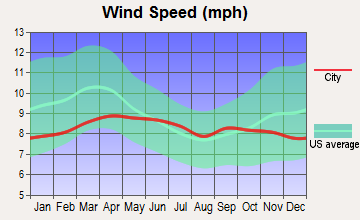
| Wind speed - Average | 11.6 mph | 8.3 mph |
| Natural disasters | ||
| Type | Queens | Tucson |
|---|---|---|
| Tornado activity compared to U.S. average | 54% | 8.9% |
| Earthquake activity compared to U.S. average | 30.6% | 1,584.9% |
| Natural disasters compared to U.S. average | 19% | 13% |
Public transport in Queens is well-developed and reliable, with the MTA running buses and trains throughout the city. Tucson's Sun Tran bus service provides public transit, besides which the city is also very bike-friendly. Commuting times in Tucson are typically shorter than in Queens.
| Transport | ||
| Type | Queens | Tucson |
|---|---|---|
| Amtrak stations | 2 | 1 |
| Amtrak stations nearby | 3 | 1 |
| FAA registered aircraft | 4 | 983 |
| FAA registered aircraft manufacturers and dealers | 0 | 14 |
| Means of transportation to work | ||
| Type | Queens | Tucson |
|---|---|---|
| Bicycle | 0.3% | 1% |
| Bus | 10% | 1.9% |
| Carpooled | 10.2% | 11.5% |
| Car alone | 34.3% | 81.9% |
| Motorcycle | 0% | 0.5% |
| Railroad | 2.2% | 0% |
| Streetcar | 0.2% | 0% |
| Subway | 34.3% | 0% |
| Taxicab | 0.7% | 0.1% |
| Walked | 5.7% | 2.3% |
| Average travel time to work | ||
| Type | Queens | Tucson |
|---|---|---|
| Average | 44 min | 26 min |
Real estate in Queens can be quite expensive, with a mix of single-family homes and apartment buildings. Tucson offers considerably cheaper options, with more space for single-family homes, making it an attractive spot for relocation.
Queens consists of various neighborhoods each offering a unique cultural mix, including Flushing, Jamaica, and Astoria. Tucson neighborhoods such as Sam Hughes, Catalina Foothills, and El Presidio each have their unique appeal, offering a blend of urban and suburban amenities.
| Houses and residents | ||
| Type | Queens | Tucson |
|---|---|---|
| Houses | 817,250 | 242,816 |
| Average household size (people) | 2.8 | 2.4 |
| Houses occupied | 782,664 (95.8%) | 223,068 (91.9%) |
| Houses occupied by owners | 334,894 (42.8%) | 114,708 (51.4%) |
| Houses occupied by renters | 447,770 (57.2%) | 108,360 (48.6%) |
| Median rent asked for vacant for-rent units | $1,666 | $801.80 |
| Median price asked for vacant for-sale houses and condos | $615,765 | $557,132 |
| Estimated median house or condo value | $642,000 | $224,800 |
| Median number of rooms in apartments | 3.7 | 4 |
| Median number of rooms in houses and condos | 5.4 | 5.8 |
| Renting percentage | 57% | 48.1% |
| Housing density (houses/condos per square mile) | 7,481.6 | 1,247.3 |
| Household income disparities | 44.9% | 44.9% |
| Housing units without a mortgage | 64,617 (34.6%) | 1,087 (1.5%) |
| Housing units with both a second mortgage and home equity loan | 311 (0.2%) | 2,785 (3.9%) |
| Housing units with a mortgage | 122,366 (65.4%) | 70,054 (98.5%) |
| Housing units with a home equity loan | 9,927 (5.3%) | 211 (0.3%) |
| Housing units with a second mortgage | 10,707 (5.7%) | 4,051 (5.7%) |
| Housing units lacking complete kitchen facilities | 1% | 1.2% |
| Housing units lacking complete plumbing facilities | 1.1% | 0.8% |
Both cities host diverse industries. In Queens, health care and social assistance is dominant followed by retail trade and education. Tucson, in contrast, has a more technology-oriented economy, largely driven by aerospace, optics and research & development.
Queens has access to renowned New York-based hospitals and healthcare facilities. Tucson houses the Banner University Medical Center and is known for its retirement and elder care facilities, given its popularity amongst retirees.
| Health (county statistics) | ||
| Type | Queens | Tucson |
|---|---|---|
| General health status score of residents in this county from 1 (poor) to 5 (excellent) | 3.4 | 3.5 |
| Average weight of females (lbs) | 156.2 lbs | 157.7 lbs |
| Average weight of males (lbs) | 183.8 lbs | 190.8 lbs |
| Residents visited a dentist within the past year | 71.1% | 70.2% |
| Residents exercised in the past month | 68.7% | 77.7% |
| Residents keep firearms around their homes | 5.2% | 26.8% |
| Adult residents drank alcohol in the past 30 days | 75.3% | 73.9% |
| Residents smoked 100+ cigarettes in their lives | 41.4% | 48.4% |
Queens offers a robust infrastructure with a variety of public resources including public libraries, parks, and shared coworking spaces. Tucson's infrastructure, while still developing, offers a competitive array of resources including local parks, city-managed golf courses, and recreational centers.
| Infrastructure | ||
| Type | Queens | Tucson |
|---|---|---|
| Hospitals | 1 | 24 |
| TV stations | 30 | 20 |
Queens reflects diverse cultures which are visible in their food, art, and lifestyle. The harmony of multicultural experiences offers rich culinary experiences ranging from Asian, European to Latino. Tucson, a UNESCO City of Gastronomy, has unique food traditions shaped by Native American, Mexican, and Western influences.
Queens is home to the New York Mets (MLB) and has easy access to other New York teams. Tucson, having no major professional sports teams, is nonetheless sports-crazy with many supporting the University of Arizona Wildcats.