Riverside and Moreno Valley are both cities located in Southern California within Riverside County. Both cities offer unique charms and present different lifestyles to their residents and potential re-locators. While Riverside is known for its rich history and arts scene, Moreno Valley is hailed for its natural beauty and vast outdoor recreational activities. In this comprehensive comparison, we shall delve into various aspects that define these cities including crime, weather, cost of living, education, and more. Understanding these factors is particularly important for would-be residents and tourists as well.
Distance between
Riverside, CA and
Moreno Valley, CA : 9.7 miles
Riverside's population is larger by 50%. Its population has grown by 62,095 people (24.3%) since 2000. The population of Moreno Valley has grown by 69,219 people (48.6%) during that time.
When it comes to safety, Moreno Valley generally has a higher crime rate compared to Riverside. This is according to the FBI's annual crime report. However, most of these are property crimes, with violent crimes being fairly low. Riverside, on the other hand, has experienced a significant decrease in crime rate over the years, making it safer overall.
City-data.com crime index counts serious crimes and violent crime more heavily. It adjusts for the number of visitors and daily workers commuting into cities. (higher means more crime, U.S. average = 301.1)
City-data.com crime index counts serious crimes and violent crime more heavily. It adjusts for the number of visitors and daily workers commuting into cities. (higher means more crime, U.S. average = 301.1)
Sex Offenders
According to our data, there are 616 registered sex offenders living in Riverside and 306 registered sex offenders living in . The ratio of residents to sex offenders in Riverside is 527 to 1; the ratio in Moreno Valley is 672 to 1. The number of registered sex offenders compared to the number of residents is larger in Riverside than in Moreno Valley.
Cost of Living
The cost of living in Riverside is slightly higher than in Moreno Valley. Generally, you're likely to spend more on housing, healthcare, and transportation in Riverside compared to Moreno Valley. However, this also comes with added benefits such as availability of more amenities and attractions.
Income Tax
The state income tax is uniform across California, so both cities have the same income tax rates. The rate depends on income levels, with brackets ranging from 1% to 13.3%.
Property Tax
The average effective property tax rate in Riverside County, where both Riverside and Moreno Valley are located, is 1.07%. Thus, the property tax in both cities is roughly the same given the county levies property taxes in California.
Sales Tax
Both Riverside and Moreno Valley have the same sales tax rate, which is currently at 7.75%, a rate that's relatively high compared to the national average.
Income
Type
Riverside
Moreno Valley
Estimated median household income
$76,558
$79,840
Estimated per capita income
$29,013
$25,319
Cost of living index (U.S. average is 100)
83
82.3
If you make $50,000 in Moreno Valley, you will have to make $50,425 in Riverside to maintain the same standard of living.
Geographical Conditions
Riverside and Moreno Valley share a similar geographical condition, given they are located within the same county. Both are characterized by warm, dry climates and are surrounded by beautiful mountain ranges.
Both cities have good educational facilities but Riverside stands out with its top-rated institutions like the University of California Riverside. Moreno Valley also has decent schools but with lower ratings in comparison to Riverside.
Riverside's economy is diversified with sectors like education, healthcare, and manufacturing making the biggest contributions. Moreno Valley also thrives on similar industries, but distribution and logistics are more predominant due to the city's strategic location as a transportation hub.
Biggest Employers
The biggest employers in Riverside are the University of California, Riverside, and Riverside Community Hospital. Meanwhile, in Moreno Valley, some of the biggest employers include the Moreno Valley Unified School District and Amazon.
There were 293 building permits issued in Riverside in 2012 (250 more than in 2011) compared to 377 building permits issued in Moreno Valley in 2012 (354 more than in 2011).
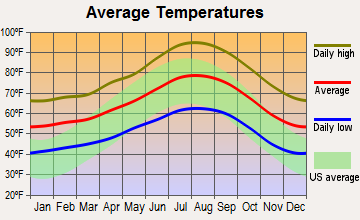
Weather
The weather in both areas is often warm and sunny, typical of Southern California. Riverside, usually experiences hotter summers, with temperatures often exceeding 100°F. As for Moreno Valley, it generally has a cooler climate with average summer temperatures ranging from 90-95°F.
Weather and climate
Type
Riverside
Moreno Valley
Temperature - Average
66°F
65.1°F
Humidity - Average morning or afternoon humidity
66.7%
66.7%
Humidity - Differences between morning and afternoon humidity
21.4%
21.1%
Humidity - Maximum monthly morning or afternoon humidity
73.5%
73.3%
Humidity - Minimum monthly morning or afternoon humidity
52.1%
52.3%
Precipitation - Yearly average
10.3 in
11.6 in
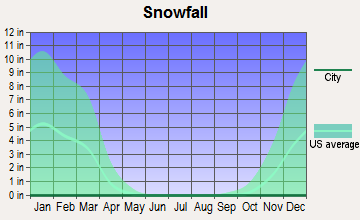
Snowfall - Yearly average
0 in
0 in
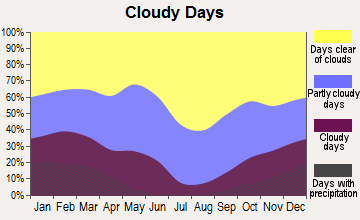
Clouds - Number of days clear of clouds
27.3%
27.3%
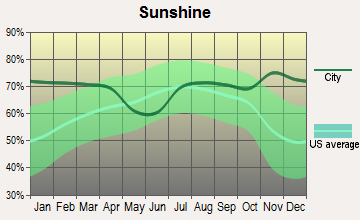
Sunshine amount - Average
78.2%
78%
Sunshine amount - Differences during a year
21.5%
20.8%
Sunshine amount - Maximum monthly
84.2%
83%
Sunshine amount - Minimum monthly
62.6%
62.2%
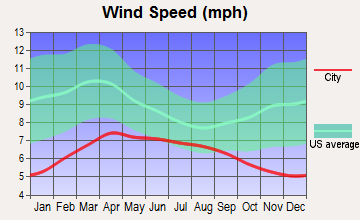
Wind speed - Average
4.5 mph
4.5 mph
Average climate in Riverside, California
Average climate in Moreno Valley, California
Air pollution
Type
AQI
CO
NO2
OZONE
PB
PM10
PM25
SO2
Year
Riverside
Moreno Valley
Riverside
Moreno Valley
Riverside
Moreno Valley
Riverside
Moreno Valley
Riverside
Moreno Valley
Riverside
Moreno Valley
Riverside
Moreno Valley
Riverside
Moreno Valley
2018
153
154
0.35
0.33
14.4
12.3
29.8
33.4
0.006
0.006
44.6
35.0
13.6
11.6
0.4
0.4
2017
151
145
0.34
0.34
14.7
12.2
31.5
35.1
0.004
0.004
48.4
37.6
14.8
13.2
0.3
0.3
2016
140
143
0.33
0.34
14.8
12.4
30.9
33.4
0.006
0.006
44.4
36.8
14.5
12.9
0.2
0.3
2015
147
145
0.33
0.32
14.5
12.2
30.8
33.2
0.004
0.004
43.6
34.7
15.4
13.7
0.3
0.3
2014
147
146
0.37
0.35
15.9
14.4
30.7
33.1
0.006
0.006
34.1
37.2
16.5
15.6
0.3
0.3
2013
147
150
0.38
0.35
16.4
14.7
29.2
32.7
0.006
0.006
33.2
35.7
16.4
14.4
0.2
0.3
2012
148
145
0.35
0.33
16.4
15.2
30.2
32.6
0.007
0.007
32.3
34.4
16.0
15.2
0.3
0.3
2011
150
149
0.37
0.34
16.3
15.3
32.0
33.0
0.006
0.006
33.1
34.4
15.2
16.6
0.3
0.4
2010
144
146
0.42
0.37
17.8
16.4
30.9
32.5
0.008
0.008
31.9
31.5
15.5
15.8
1.3
1.2
2009
151
151
0.37
0.34
20.0
17.8
29.0
32.1
0.009
0.010
38.0
35.0
19.6
17.0
1.5
1.4
2008
157
156
0.41
0.38
20.5
18.1
30.0
32.6
0.010
0.011
43.6
41.2
16.3
15.7
0.9
1.1
2007
135
127
0.65
0.55
20.8
19.0
28.3
31.3
0.011
0.013
N/A
N/A
N/A
N/A
1.6
1.6
2006
129
129
0.58
0.51
21.0
19.7
28.0
30.6
0.005
0.007
N/A
N/A
N/A
N/A
1.4
1.5
2005
134
131
0.53
0.50
22.8
21.1
27.3
27.5
0.012
0.012
N/A
N/A
N/A
N/A
3.3
3.0
2004
142
140
0.72
0.63
18.5
18.1
29.5
31.3
0.013
0.013
N/A
N/A
N/A
N/A
3.1
2.7
2003
144
144
0.75
0.78
22.7
21.7
28.5
31.9
0.013
0.021
N/A
N/A
N/A
N/A
2.0
1.8
2002
142
142
0.82
0.79
24.9
22.9
28.5
31.3
0.015
0.016
N/A
N/A
N/A
N/A
0.2
0.4
2001
145
147
0.79
0.79
25.7
24.2
26.1
30.8
0.025
0.039
N/A
N/A
N/A
N/A
0.9
1.0
2000
157
157
0.82
0.83
24.2
23.4
25.0
28.2
0.031
0.034
N/A
N/A
N/A
N/A
1.2
1.4
Natural disasters
Type
Riverside
Moreno Valley
Tornado activity compared to U.S. average
17.4%
16.4%
Earthquake activity compared to U.S. average
7,322.6%
7,327.3%
Natural disasters compared to U.S. average
46%
46%
Transportation
Public transit systems are well-established in both Riverside and Moreno Valley, with Riverside offering more options like the Metrolink train service. Commuting is generally easier in Riverside due to its more developed road network and public transportation system.
Transport
Type
Riverside
Moreno Valley
Amtrak stations
1
1
Amtrak stations nearby
3
3
FAA registered aircraft
307
27
FAA registered aircraft manufacturers and dealers
15
2
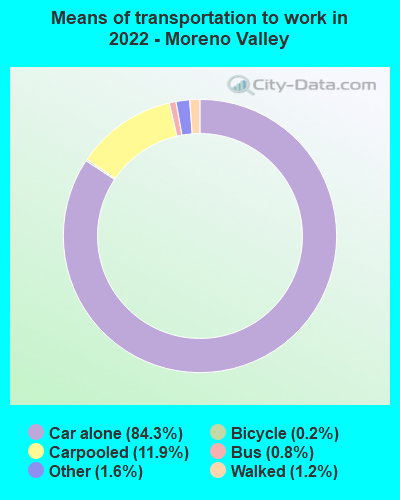
Means of transportation to work
Type
Riverside
Moreno Valley
Bicycle
0.5%
0.1%
Bus
0.9%
1.2%
Carpooled
9%
11.2%
Car alone
85.7%
84.7%
Motorcycle
0.3%
0.3%
Railroad
0.4%
0%
Streetcar
0%
0.1%
Walked
2.3%
1.2%
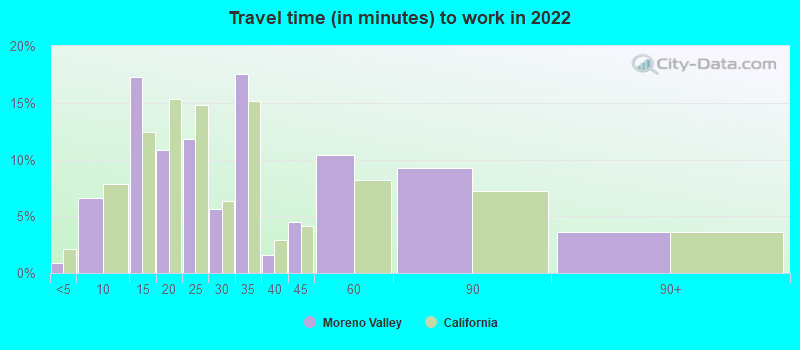
Average travel time to work
Type
Riverside
Moreno Valley
Average
31.3 min
29.1 min
Other means
28.7 min
34.1 min
Public transportation
45.3 min
55.2 min
Private vehicle occupancy
Type
Riverside
Moreno Valley
Average
1.1
1.2
Drove alone
89.1%
84.3%
In 2 person carpool
8.4%
12.3%
In 3 person carpool
2%
2.7%
In 4 person carpool
0.2%
0.4%
In 5-6 person carpool
0.2%
0.1%
In 7+ person carpool
0.1%
0.2%
How many people usually rode to work in the car, truck or van.
Real Estate
The real estate market in Riverside is more competitive, with higher property prices compared to Moreno Valley. This is because of Riverside's established neighborhoods, historical charm, and proximity to numerous amenities.
Neighborhoods
Riverside is known for its unique, historical neighborhoods, such as the Downtown and Wood Streets areas, which are beloved for their historical charm. Moreno Valley has newer neighborhoods attracting families with its peaceful and family-friendly surroundings.
Houses and residents
Type
Riverside
Moreno Valley
Houses
94,246
55,128
Average household size (people)
3.2
3.7
Median year apartment built
1982
1990
Median year house/condo built
1974
1987
Length of stay in the house since moving in
14.2 years
13.4 years
Houses occupied
91,110 (96.7%)
54,104 (98.1%)
Houses occupied by owners
51,211 (56.2%)
33,152 (61.3%)
Houses occupied by renters
39,899 (43.8%)
20,952 (38.7%)
Median rent asked for vacant for-rent units
$1,277
$1,620
Median monthly housing costs
$1,680
$1,773
Median price asked for vacant for-sale houses and condos
$414,585
$478,171
Estimated median house or condo value
$483,300
$422,500
Median numbers of rooms
5.2
5.9
Median number of rooms in apartments
3.9
4.9
Median number of rooms in houses and condos
6.1
6.3
Median house price - detached houses
$548,362
$408,231
Median house price - in 2-unit structures
$525,372
Over $1,000,000
Median house price - in 3-to-4-unit structures
$450,463
$287,962
Median house price - in 5 or more unit structures
$408,213
$227,600
Median house price - mobile homes
$81,780
$77,425
Median house price - Townhouses or other attached units
$442,670
$416,724
Median house price - All housing units
$529,360
$396,904
Median house age
44
33
Renting percentage
44.3%
35.3%
Housing density (houses/condos per square mile)
1,206.8
1,076.1
House value disparities
21%
18.2%
Household income disparities
40.5%
37.8%
Median household income for houses/condes with a mortgage
$104,161
$96,852
Median household income for apartments without a mortgage
$71,925
$72,290
Housing units without a mortgage
393 (1%)
207 (0.8%)
Housing units with both a second mortgage and home equity loan
1,312 (3.3%)
1,146 (4.3%)
Housing units with a mortgage
39,744 (99%)
26,147 (99.2%)
Housing units with a home equity loan
123 (0.3%)
24 (0.1%)
Housing units with a second mortgage
2,112 (5.3%)
1,290 (4.9%)
House/condo owner moved in on average (years ago)
13
13
House/condo renter moved in on average (years ago)
3
4
Housing units lacking complete kitchen facilities
2.5%
1.7%
Housing units lacking complete plumbing facilities
0.4%
0.1%
Housing units in structures
Housing units in structures
Riverside
Moreno Valley
One, detached
63.1%
79.5%
One, attached
5.6%
2.4%
Two
1.1%
0.7%
3 or 4
3.7%
2.2%
5 to 9
6.8%
5.6%
10 to 19
7.0%
2.7%
20 to 49
4.6%
1.5%
50 or more
6.4%
3.3%
Mobile homes
1.8%
1.9%
Median real estate property taxes paid for housing units
Self-employed workers in own not incorporated business
8,164
4,730
State government workers
8,293
1,746
Unpaid family workers
199
181
Industries and Occupations
Moreno Valley is a leading player in logistics and distribution thanks to big companies like Amazon, which is also one of its largest employers. Riverside's economy is more diversified, with education, healthcare, retail, and public administration contributing significantly to employment rates.
Health diagnosing and treating practitioners and other technical occupations
5.1%
4.9%
Production occupations
4.7%
3.6%
Business and financial operations occupations
4.1%
7.7%
Community and social service occupations
3.5%
2.6%
Building and grounds cleaning and maintenance occupations
3.1%
3.3%
Personal care and service occupations
2.6%
2.2%
Health technologists and technicians
2.3%
3.3%
Arts, design, entertainment, sports, and media occupations
1.9%
1.1%
Life, physical, and social science occupations
1.2%
0.2%
Legal occupations
1.0%
1.2%
Transportation occupations
0.9%
1.5%
Health Care
Riverside's health care system is more developed, boasting several medical centers and hospitals like the Riverside Community Hospital. Moreno Valley healthcare, though not as established, offers good services through facilities like the Riverside University Health System.
Riverside boasts a well-developed infrastructure, owing to its rich history and continued development efforts. Moreno Valley is a younger city with more modern infrastructure but less variety.
Infrastructure
Type
Riverside
Moreno Valley
Hospitals
20
8
TV stations
5
5
Bank branches located here
61
15
Bank institutions located here
18
7
Drinking water stations with no reported violations in the past
2
1
Drinking water stations with reported violations in the past
HMDA - Conventional home purchase loans - Applications denied
Year
Riverside
Moreno Valley
1999
794
253
2000
375
0
2001
310
0
2002
405
0
2003
1,399
1,150
2004
1,892
1,936
2005
2,728
2,705
2006
3,235
2,993
2007
1,568
1,542
2008
544
599
2009
285
269
Culture and Food
Riverside's cultural scene is quite vibrant due to the presence of arts and cultural institutions such as the Riverside Art Museum and various arts events that are often held in the city. In terms of food, both cities have diverse culinary scenes but Riverside, being larger, provides more variety.
Sports Teams
Neither Riverside nor Moreno Valley have any major professional sports teams. However, residents and visitors can enjoy a vareity of sporting events at the University of California, Riverside.

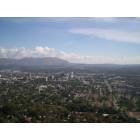
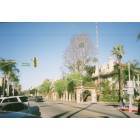
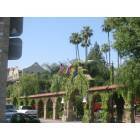
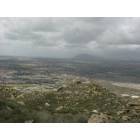
 Riverside, CA
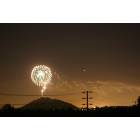
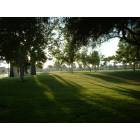
 Moreno Valley, CA