Riverside, CA and Perris Valley, CA are two distinctive locations in the Golden State, each offering its own unique experiences for residents and tourists alike. Riverside, the larger city, boasts historical charm, rich cultural experiences, and a robust economy. Perris Valley, being a smaller locale, offers a serener environment with smaller communities and an economy driven by a handful of industries. This comparative analysis will delve into key perspectives—such as crime/safety, weather, cost of living, education, work and economy, and more—to provide a detailed snapshot of life in both Riverside and Perris Valley.
Crime rates in Riverside are higher compared to Perris Valley, making it potentially less desirable for those prioritizing safety. Riverside has a crime rate slightly above the national average, whereas Perris Valley's crime rates are significantly lower. However, it should be noted that both cities invest heavily in public safety, with numerous community policing initiatives in operation.
Cost of Living
Living in Riverside is generally more expensive than living in Perris Valley. Riverside's cost of living index is higher than the national average, reflecting higher costs in housing, food, and transportation. In contrast, Perris Valley remains more affordable, with a cost of living index below the national average.
Income Tax
Both cities fall under California's progressive state income tax structure. The exact tax burden varies depending on the taxpayer's level of income.
Property Tax
Property taxes in both Riverside and Perris Valley are comparable and align with the state's average property tax rate of approximately 0.76% of assessed home value.
Sales Tax
Both Riverside and Perris Valley are subject to California's state sales tax rate of 7.25%. However, Riverside has an additional district tax, resulting in a slightly higher overall sales tax.
Income
Type
Riverside
Perris Valley
Estimated median household income
$76,558
$71,187
Estimated per capita income
$29,013
$27,699
Cost of living index (U.S. average is 100)
83
85.6
If you make $50,000 in Riverside, you will have to make $51,566 in Perris Valley to maintain the same standard of living.
Geographical Conditions
Riverside offers varied geography, with flatlands, rolling hills, and the Santa Ana River. Perris Valley's geography is characterized by gentle sloping hills and the beautiful man-made Lake Perris.
Geographical information
Type
Riverside
Perris Valley
Land area
78.1 sq. miles
276.5 sq. miles
Population density
4,062.3 people per sq. mile
689.3 people per sq. mile
Relative area comparison
Riverside, CA Perris Valley, CA
Education
Educational opportunities are abundant in both cities, albeit more so in Riverside due to its larger size. Riverside is home to various renowned universities, including the University of California, Riverside. Perris Valley, on the other hand, primarily offers education through the Val Verde Unified School District, with access to a handful of community colleges.
Riverside boasts a diverse economy, with leading sectors including healthcare, education, and manufacturing. The city is home to a majority of the region's large employers. In contrast, Perris Valley's economy is smaller and more reliant on its logistics and warehouse sector due to its proximity to major transportation routes.
Biggest Employers
Riverside has several large employers, including the University of California, Riverside, the Riverside Community Hospital, and the City of Riverside. Meanwhile, top employers in Perris Valley include Ross Stores Distribution Center, the Perris Elementary School District, and the Val Verde Unified School District.
Weather
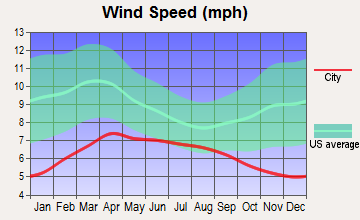
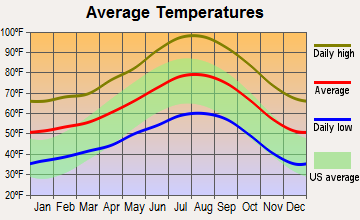
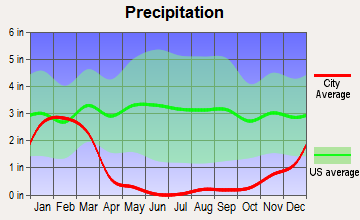
Both Riverside and Perris Valley experience Mediterranean climates, characterized by hot, dry summers, and mild, wet winters. However, Riverside is slightly hotter, with summers reaching peak temperatures in the 90s, while Perris Valley usually sees highs in the upper 80s. The weather in both cities is often considered pleasant, making them ideal for outdoor activities year-round.
Weather and climate
Type
Riverside
Perris Valley
Temperature - Average
66°F
64.1°F
Humidity - Average morning or afternoon humidity
66.7%
68%
Humidity - Differences between morning and afternoon humidity
21.4%
22.4%
Humidity - Maximum monthly morning or afternoon humidity
73.5%
75.1%
Humidity - Minimum monthly morning or afternoon humidity
52.1%
52.7%
Precipitation - Yearly average
10.3 in
11.5 in
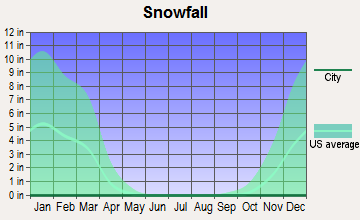
Snowfall - Yearly average
0 in
0 in
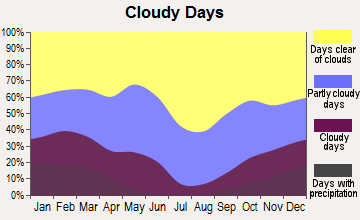
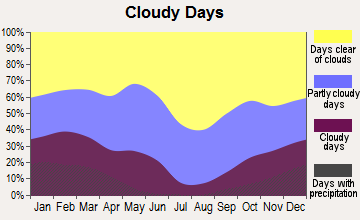
Clouds - Number of days clear of clouds
27.3%
27.1%
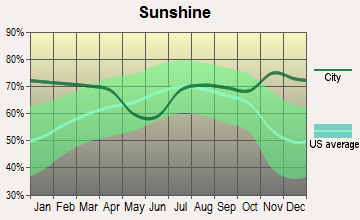
Sunshine amount - Average
78.2%
77.6%
Sunshine amount - Differences during a year
21.5%
20.5%
Sunshine amount - Maximum monthly
84.2%
82%
Sunshine amount - Minimum monthly
62.6%
61.5%
Wind speed - Average
4.5 mph
5 mph
Average climate in Riverside, California
Average climate in Perris Valley, California
Air pollution
Type
AQI
CO
NO2
OZONE
PB
PM10
PM25
SO2
Year
Riverside
Perris Valley
Riverside
Perris Valley
Riverside
Perris Valley
Riverside
Perris Valley
Riverside
Perris Valley
Riverside
Perris Valley
Riverside
Perris Valley
Riverside
Perris Valley
2018
153
154
0.35
0.28
14.4
9.3
29.8
33.0
0.006
0.006
44.6
27.9
13.6
8.9
0.4
0.5
2017
151
146
0.34
0.28
14.7
8.7
31.5
33.0
0.004
0.004
48.4
28.9
14.8
11.4
0.3
0.3
2016
140
143
0.33
0.25
14.8
8.9
30.9
31.6
0.006
0.006
44.4
27.6
14.5
11.0
0.2
0.2
2015
147
145
0.33
0.22
14.5
9.0
30.8
31.6
0.004
0.004
43.6
25.5
15.4
11.6
0.3
0.3
2014
147
148
0.37
0.24
15.9
10.5
30.7
32.6
0.006
0.006
34.1
31.9
16.5
13.6
0.3
0.3
2013
147
150
0.38
0.24
16.4
10.8
29.2
32.4
0.006
0.006
33.2
30.8
16.4
11.7
0.2
0.2
2012
148
145
0.35
0.23
16.4
11.3
30.2
31.4
0.007
0.007
32.3
28.3
16.0
12.1
0.3
0.2
2011
150
149
0.37
0.26
16.3
11.7
32.0
31.0
0.006
0.006
33.1
30.1
15.2
13.2
0.3
0.3
2010
144
146
0.42
0.29
17.8
12.3
30.9
31.4
0.008
0.008
31.9
27.8
15.5
13.3
1.3
1.3
2009
151
151
0.37
0.26
20.0
14.3
29.0
31.3
0.009
0.010
38.0
30.8
19.6
13.8
1.5
1.6
2008
157
155
0.41
0.34
20.5
14.9
30.0
32.3
0.010
0.011
43.6
40.0
16.3
12.0
0.9
0.9
2007
135
125
0.65
0.41
20.8
15.6
28.3
31.8
0.011
0.013
N/A
N/A
N/A
N/A
1.6
1.5
2006
129
126
0.58
0.37
21.0
16.2
28.0
30.9
0.005
0.007
N/A
N/A
N/A
N/A
1.4
1.3
2005
134
129
0.53
0.35
22.8
15.7
27.3
25.4
0.012
0.012
N/A
N/A
N/A
N/A
3.3
3.4
2004
142
137
0.72
0.42
18.5
15.5
29.5
30.2
0.013
0.013
N/A
N/A
N/A
N/A
3.1
3.4
2003
144
140
0.75
0.57
22.7
18.3
28.5
31.9
0.013
0.020
N/A
N/A
N/A
N/A
2.0
2.2
2002
142
138
0.82
0.57
24.9
18.3
28.5
33.2
0.015
0.015
N/A
N/A
N/A
N/A
0.2
0.1
2001
145
145
0.79
0.79
25.7
19.2
26.1
32.5
0.025
0.052
N/A
N/A
N/A
N/A
0.9
0.8
2000
157
157
0.82
0.83
24.2
18.4
25.0
28.8
0.031
0.033
N/A
N/A
N/A
N/A
1.2
1.1
Natural disasters
Type
Riverside
Perris Valley
Tornado activity compared to U.S. average
17.4%
16.2%
Earthquake activity compared to U.S. average
7,322.6%
7,175.7%
Natural disasters compared to U.S. average
46%
46%
Transportation
Riverside provides extensive public transportation services, including bus and train options. Additionally, its strategic location in Southern California makes commuting reasonably easy. Perris Valley, on the other hand, is more car-dependent but also offers basic public transit services.
Transport
Type
Riverside
Perris Valley
Amtrak stations
1
0
Amtrak stations nearby
3
3
FAA registered aircraft
307
0
FAA registered aircraft manufacturers and dealers
15
0
Means of transportation to work
Type
Riverside
Perris Valley
Bicycle
0.5%
0.3%
Bus
0.9%
1%
Carpooled
9%
18%
Car alone
85.7%
73.6%
Motorcycle
0.3%
0.1%
Railroad
0.4%
0.2%
Walked
2.3%
1.4%
Average travel time to work
Type
Riverside
Perris Valley
Average
31.3 min
37 min
Real Estate
Riverside's real estate market is pricier than Perris Valley's, with a median home value significantly higher than the national average. Perris Valley, in comparison, offers more affordable housing options, making it appealing for first-time homebuyers or those with tight budgets.
Neighborhoods
Riverside offers a range of neighborhoods, from historic districts to modern subdivisions, each with its own distinct charm. Perris Valley, while smaller, boasts tight-knit communities that often foster a strong sense of neighborhood spirit.
Houses and residents
Type
Riverside
Perris Valley
Houses
94,246
51,323
Average household size (people)
3.2
3.4
Houses occupied
91,110 (96.7%)
46,991 (91.6%)
Houses occupied by owners
51,211 (56.2%)
36,693 (78.1%)
Houses occupied by renters
39,899 (43.8%)
10,298 (21.9%)
Median rent asked for vacant for-rent units
$1,277
$1,322
Median price asked for vacant for-sale houses and condos
$414,585
$464,486
Estimated median house or condo value
$483,300
$376,802
Median number of rooms in apartments
3.9
5.7
Median number of rooms in houses and condos
6.1
6.2
Renting percentage
44.3%
27.2%
Housing density (houses/condos per square mile)
1,206.8
185.6
Household income disparities
40.5%
42.4%
Housing units without a mortgage
393 (1%)
6,227 (22.3%)
Housing units with both a second mortgage and home equity loan
1,312 (3.3%)
116 (0.4%)
Housing units with a mortgage
39,744 (99%)
21,647 (77.7%)
Housing units with a home equity loan
123 (0.3%)
962 (3.5%)
Housing units with a second mortgage
2,112 (5.3%)
3,573 (12.8%)
Housing units lacking complete kitchen facilities
2.5%
1.1%
Housing units lacking complete plumbing facilities
Self-employed workers in own not incorporated business
8,164
4,282
State government workers
8,293
1,900
Unpaid family workers
199
195
Industries and Occupations
Riverside's diverse economy supports a broad range of industries, including healthcare, education, manufacturing, and professional services. In Perris Valley, logistics and warehousing dominate, owing to its strategic location near vital Southern California transport corridors.
Health Care
Riverside has a well-established healthcare system with multiple hospitals, specialized clinics, and medical centers. Perris Valley's healthcare infrastructure, while adequate, is not as extensive, with residents often relying on neighboring cities for certain types of specialized care.
Infrastructure
Riverside's infrastructure is more developed than Perris Valley's, with an extensive network of roads, highways, public transportation, and utilities. Perris Valley's infrastructure, while sufficient for its population, does not have the same level of complexity and growth due to its smaller size and fewer urban demands.
Infrastructure
Type
Riverside
Perris Valley
TV stations
5
4
Culture and Food
Riverside is known for its vibrant arts scene, various museums, multiple arts festivals, and a diverse culinary landscape. Perris Valley, while not as culturally diverse, offers a cozier atmosphere with local eateries serving traditional and international cuisines.
Sports Teams
While neither city hosts major professional sports teams, Riverside's sports culture is more vibrant, featuring collegiate sports from the University of California, Riverside. Perris Valley residents often follow Los Angeles-based sports teams due to the city's proximity.
 Riverside, CA
 Perris Valley, CA