Sacramento, the capital city of California, compared to the North Coast region of the state, offers different experiences for both residents and tourists. Both places vary in terms of crime rates, weather, cost of living, and more. In the following sections, the comparison between Sacramento and North Coast will be drawn out in detail to provide a comprehensive look at what life and visits could entail in these areas.
Sacramento, although being a state capital, has a crime rate higher than the national average. Neighborhoods like Meadowview, Valley Hi, and parts of North Sacramento have experienced significantly higher crime rates than other areas. In contrast, the North Coast region, marked by small towns and rural landscapes, generally boasts a lower crime rate, providing a safer environment for both residents and tourists. However, the crime level can still vary from town to town.
Cost of Living
The cost of living in Sacramento is quite high compared to the national average, with factors such as housing and transportation significantly above national averages. However, it's still relatively affordable compared to many other Californian cities such as San Francisco or Los Angeles. In contrast, the cost of living on the North Coast can vary widely between areas, with towns like Mendocino and Eureka being relatively expensive, but generally, it's lower than in Sacramento.
Income Tax
California levies a progressive income tax which applies statewide, with rates ranging from 1% to 13.3%. Both residents of Sacramento and the North Coast will pay the same state income tax rates.
Property Tax
Both areas are subject to state property taxes. However, owing to the higher home values in Sacramento, property taxes paid here are generally higher than on the North Coast.
Sales Tax
Both Sacramento and the North Coast have the same state sales tax rate of 7.25%, as the state of California levies both. However, Sacramento has an additional district tax, making the combined sales tax reach 8.75%.
Income
Type
Sacramento
North Coast
Estimated median household income
$75,311
$102,807
Estimated per capita income
$37,916
$50,809
Cost of living index (U.S. average is 100)
102.9
96.1
If you make $50,000 in North Coast, you will have to make $53,538 in Sacramento to maintain the same standard of living.
Geographical Conditions
Sacramento is located in the Central Valley at the confluence of two rivers, having a mostly flat terrain. The North Coast features diverse geography, from beautiful coastal cliffs and beaches to towering redwood forests and vineyards.
Geographical information
Type
Sacramento
North Coast
Land area
97.2 sq. miles
59.4 sq. miles
Population density
5,404 people per sq. mile
6,335.5 people per sq. mile
Relative area comparison
Sacramento, CA North Coast, CA
Education
Sacramento offers many quality education opportunities, both public and private. It hosts the University of California, Davis, and a variety of prestigious private universities. Meanwhile, the North Coast offers fewer educational opportunities due to the lower density of population. But it's home to the respected Humboldt State University and numerous community colleges.
Sacramento's economy is very diverse, with sectors such as government, healthcare, education, and technology playing significant roles. The North Coast economy is more reliant on industries such as fishing, timber, and wine production, alongside a growing tourism sector.
In Sacramento (Sacramento County), 58.1% voted for Democrats and 39.1% for Republicans in 2012 Presidential Election. In North Coast (Orange County), 45.8% voted for Democrats and 52.0% for Republicans.
Elections
Type
Democrats
Republicans
Other
Year
Sacramento
North Coast
Sacramento
North Coast
Sacramento
North Coast
2020
61.4%
53.6%
36.1%
44.6%
2.5%
1.8%
2016
58.0%
50.9%
33.8%
42.4%
8.3%
6.7%
2012
58.1%
45.8%
39.1%
52.0%
2.8%
2.3%
2008
58.4%
47.8%
39.4%
50.3%
2.2%
1.9%
2004
49.8%
39.3%
49.6%
60.2%
0.6%
0.5%
2000
49.4%
40.4%
45.4%
55.9%
5.2%
3.7%
1996
49.8%
37.9%
40.8%
51.7%
9.4%
10.5%
Breakdown of population affiliated with a religious congregation
Type
Adherents
Congregations
Religion
Sacramento
North Coast
Sacramento
North Coast
CATHOLIC CHURCH
16.2%
26.5%
5.1%
4.4%
SOUTHERN BAPTIST CONVENTION
1.7%
2.3%
8.6%
8.8%
MUSLIM ESTIMATE
0.9%
0.8%
1.3%
1.3%
NORTH AMERICAN BAPTIST CONFERENCE
0.6%
0.1%
2.2%
0.5%
SEVENTH DAY ADVENTIST CHURCH
0.6%
0.4%
2.1%
1.3%
EVANGELICAL LUTHERAN CHURCH IN AMERICA
0.5%
0.4%
1.8%
2.3%
AMERICAN BAPTIST CHURCHES IN THE USA
0.4%
0.2%
1.7%
1.7%
EPISCOPAL CHURCH
0.3%
0.4%
1.4%
1.4%
LUTHERAN CHURCH
0.2%
0.6%
1.1%
2.0%
REFORMED CHURCH IN AMERICA
0.1%
0.3%
0.3%
0.2%
Weather
Sacramento typically has a hot-summer Mediterranean climate, with hot, dry summers and mild, wet winters. Average temperatures can reach the high 90s in summer and the mid-40s in winter. The North Coast enjoys a very different climate, influenced heavily by the Pacific Ocean, with cool, damp winters and mild, dry summers - it's generally cooler and more moderate than in Sacramento.
Weather and climate
Type
Sacramento
North Coast
Temperature - Average
62.2°F
64.4°F
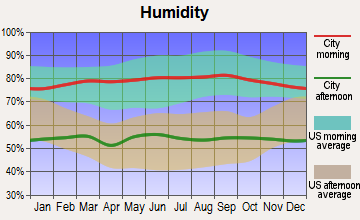
Humidity - Average morning or afternoon humidity
66.8%
70.2%
Humidity - Differences between morning and afternoon humidity
58%
26.7%
Humidity - Maximum monthly morning or afternoon humidity
87%
78.7%
Humidity - Minimum monthly morning or afternoon humidity
29%
52%
Precipitation - Yearly average
19 in
13 in
Snowfall - Yearly average
0 in
0 in
Clouds - Number of days clear of clouds
31.5%
26.5%
Sunshine amount - Average
83.6%
78.4%
Sunshine amount - Differences during a year
52%
21.9%
Sunshine amount - Maximum monthly
97%
84.9%
Sunshine amount - Minimum monthly
45%
62.9%
Wind speed - Average
6.8 mph
6 mph
Average climate in Sacramento, California
Average climate in North Coast, California
Air pollution
Type
AQI
CO
NO2
OZONE
PB
PM10
PM25
SO2
Year
Sacramento
North Coast
Sacramento
North Coast
Sacramento
North Coast
Sacramento
North Coast
Sacramento
North Coast
Sacramento
North Coast
Sacramento
North Coast
Sacramento
North Coast
2018
121
119
0.32
0.35
9.7
14.4
24.7
26.1
0.002
N/A
28.9
27.5
12.7
12.6
N/A
0.7
2017
117
116
0.33
0.34
9.0
13.8
25.2
28.8
0.002
N/A
22.1
26.7
8.8
13.8
N/A
0.5
2016
103
102
0.44
0.33
8.0
12.2
25.3
29.3
0.002
N/A
14.0
24.1
9.0
12.5
N/A
0.2
2015
105
106
0.25
0.32
9.7
13.2
24.9
29.8
0.002
N/A
16.2
25.0
10.9
14.5
N/A
0.2
2014
99
110
0.24
0.29
10.2
12.9
24.9
28.6
0.002
N/A
15.6
26.7
9.6
15.5
N/A
0.4
2013
102
107
0.29
0.34
11.1
13.9
23.2
27.8
0.002
0.003
21.3
29.5
11.9
14.2
N/A
0.3
2012
107
103
0.31
0.30
10.5
12.7
25.2
26.8
0.002
0.004
15.2
28.2
7.9
14.3
N/A
0.1
2011
106
109
0.29
0.31
11.2
14.7
24.0
27.0
0.002
0.006
17.7
27.7
10.8
15.9
N/A
0.7
2010
109
102
0.29
0.33
11.2
14.3
22.8
26.2
N/A
0.011
16.9
23.6
9.3
14.0
0.5
0.6
2009
118
118
0.40
0.35
12.4
15.5
23.3
27.6
0.003
0.009
20.6
24.3
11.4
14.5
0.5
1.1
2008
130
124
0.40
0.39
14.9
16.5
25.4
28.2
N/A
0.010
24.3
29.5
13.6
21.6
0.5
1.1
2007
129
100
0.39
0.36
14.8
16.3
23.7
27.0
0.005
0.012
19.9
N/A
13.5
N/A
0.6
0.8
2006
124
114
0.49
0.40
15.4
17.2
22.7
26.4
N/A
0.007
23.7
N/A
13.0
N/A
0.5
1.3
2005
125
95
0.42
0.39
15.9
17.7
20.0
27.9
N/A
0.012
22.1
N/A
13.5
N/A
0.6
1.3
2004
119
119
0.49
0.50
15.8
19.2
19.1
30.5
N/A
0.014
22.7
N/A
13.3
N/A
0.6
1.6
2003
119
122
0.47
0.64
16.8
21.9
20.3
28.9
N/A
0.030
23.1
N/A
N/A
N/A
0.9
1.1
2002
114
106
0.50
0.65
18.1
22.0
21.2
25.5
0.004
0.018
25.1
N/A
N/A
N/A
1.5
1.8
2001
111
116
0.43
0.73
18.0
22.0
21.2
25.4
0.004
0.033
20.7
N/A
N/A
N/A
1.4
1.5
2000
107
125
0.55
0.80
17.9
24.4
19.5
24.0
0.004
0.027
19.1
N/A
N/A
N/A
1.4
1.9
Natural disasters
Type
Sacramento
North Coast
Tornado activity compared to U.S. average
8.8%
18.6%
Earthquake activity compared to U.S. average
7,798.9%
6,843.6%
Natural disasters compared to U.S. average
18%
32%
Transportation
Sacramento has a robust public transit system, served by busses, light rails, and even ferries in some areas. Commuting is generally easier due to the well-maintained road network. On the other hand, the North Coast relies more on private transportation due to its rural nature. Public transit is less available but steadily improving.
Transport
Type
Sacramento
North Coast
Amtrak stations
1
0
Amtrak stations nearby
3
3
FAA registered aircraft
414
0
FAA registered aircraft manufacturers and dealers
20
0
Means of transportation to work
Type
Sacramento
North Coast
Bicycle
1.1%
0.7%
Bus
1%
1.2%
Carpooled
12%
10.7%
Car alone
80%
81.4%
Motorcycle
0.2%
0.2%
Railroad
0.4%
0%
Taxicab
0.1%
0%
Walked
2.8%
1.4%
Average travel time to work
Type
Sacramento
North Coast
Average
28.5 min
28.8 min
Real Estate
Real estate in Sacramento can be quite costly, with prices considerably above the national median. However, prices vary greatly depending on the neighborhood. Real estate on the North Coast tends to be less expensive, although prices can substantially increase in highly desirable or scenic locations.
Houses and residents
Type
Sacramento
North Coast
Houses
210,715
137,450
Average household size (people)
2.6
2.7
Houses occupied
202,093 (95.9%)
133,254 (96.9%)
Houses occupied by owners
103,994 (51.5%)
84,546 (63.4%)
Houses occupied by renters
98,099 (48.5%)
48,708 (36.6%)
Median rent asked for vacant for-rent units
$976.09
$2,340
Median price asked for vacant for-sale houses and condos
$398,191
$1,099,558
Estimated median house or condo value
$449,600
$883,291
Median number of rooms in apartments
4.1
3.9
Median number of rooms in houses and condos
5.8
6.1
Renting percentage
50.6%
37.7%
Housing density (houses/condos per square mile)
2,168.8
2,312.7
Household income disparities
44%
41.2%
Housing units without a mortgage
1,166 (1.6%)
13,396 (19.5%)
Housing units with both a second mortgage and home equity loan
4,385 (6.1%)
282 (0.4%)
Housing units with a mortgage
70,415 (98.4%)
55,188 (80.5%)
Housing units with a home equity loan
204 (0.3%)
6,297 (9.2%)
Housing units with a second mortgage
5,362 (7.5%)
7,643 (11.1%)
Housing units lacking complete kitchen facilities
1.2%
1%
Housing units lacking complete plumbing facilities
Self-employed workers in own not incorporated business
12,891
15,532
State government workers
40,274
5,751
Unpaid family workers
755
744
Industries and Occupations
While government, healthcare, and IT are key industries in Sacramento, the North Coast's economy is driven by sectors like tourism, fishing, and wineries. Both areas offer unique job opportunities depending on one's chosen career path.
Sacramento has numerous hospitals and health centers, providing excellent healthcare facilities. The North Coast, while providing adequate healthcare, may not offer as many specialized services due to its rural nature.
Health (county statistics)
Type
Sacramento
North Coast
General health status score of residents in this county from 1 (poor) to 5 (excellent)
Sacramento has more developed infrastructure, with a sophisticated public transportation system, and a strong network of highways and roads. The North Coast is less developed, given its rural character, and has a more limited public transport network.
Infrastructure
Type
Sacramento
North Coast
TV stations
23
2
Culture and Food
Sacramento is known for its vibrant cultural scene and rich history, hosting many museums, festivals, and music events. Known as America's Farm-to-Fork Capital, it offers a diverse food scene. The North Coast, while quieter, boasts a rich cultural heritage linked to the Native American and early pioneer communities, and holds delicious seafood festivals.
Sports Teams
Sacramento is home to the NBA’s Sacramento Kings and the minor league Sacramento River Cats. The North Coast doesn't host any major sports teams, but local college and high school sports are followed passionately.

 Sacramento, CA
 North Coast, CA